Now there is a requirement on the project that the mouse be moved to the X-axis label to show the total number of labels, and to the pointer to show the fast numbers.
But the official tooltip.trigger is only item, axis and none. Its effect can not meet the requirements of my project.
So I had to look at the api document. First, I had to turn on the trigger switch of the X-axis label. The trigger switch of the X-axis label was turned off by default.
xAxis.triggerEvent boolean
[ default: false ]
Whether the label of coordinate axis responds to and triggers mouse events is not responded by default.
The event parameters are as follows:
{
    // Component type, xAxis, yAxis, radius Axis, angleAxis
    // Each component type has an attribute representing the component's index, such as xAxis, which is xAxis Index.
    componentType: string,
    // Unformatted scale values, click on the scale label to be valid
    value: '',
    // Name of coordinate axis, click on the name of coordinate axis to be valid
    name: ''
}
In xAxis, set the triggerEvent value to true. So the trigger of the X-axis label opens.
Next, add events to it. There are many mouse events in echarts, such as'click','dblclick','mousedown','mousemove','mouseup','mouseover','mouseout'.
I used mousemove.
myChart.on('mousemove', function (params) {
   //Function content
});

paramsContains the following information
{
    // The name of the component to which the graphic element currently clicked belongs.
    // Its values are'series','markLine','markPoint','timeLine', etc.
    componentType: string,
    // Series type. Values may be:'line','bar','pie', etc. It makes sense when componentType is'series'.
    seriesType: string,
    // The index of the series in the incoming option.series. It makes sense when componentType is'series'.
    seriesIndex: number,
    // Series name. It makes sense when componentType is'series'.
    seriesName: string,
    // Data Name, Category Name
    name: string,
    // index of data in the incoming data array
    dataIndex: number,
    // Input raw data item
    data: Object,
    // Charts such as sankey and graph contain both nodeData and edgeData.
    // The value of dataType will be'node'or'edge', indicating whether the current click is on node or edge.
    // There is only one data in most other graphs, and dataType is meaningless.
    dataType: string,
    // Input data values
    value: number|Array
    // The color of data graphics. It makes sense when componentType is'series'.
    color: string
}
In order to distinguish the trigger of the X-axis tag from the trigger of the pointer, we need to judge the values in the params.
myChart.on('mousemove', function (params) {
        if(params.componentType =='xAxis')
        {
            if(params.value=="Class0"){
                isXLabel=true;
                var offsetX =params.event.offsetX+10;
                var offsetY =params.event.offsetY+10;
                if(params.value="Class1"){
                    myChart.dispatchAction({
                        type: 'showTip',
                        seriesIndex: 0,
                        dataIndex: 0,
                        position:[offsetX,offsetY]
                    });

                }

                console.info(params);

            }

        }

    });
     myChart.on('mouseover', function (params) {
       isXLabel=false;

    });
isXLabel is for tiptool to choose which formatter to use
tooltip: {
hideDelay:2000,
formatter: function (a) {
if(isXLabel){
console.info(a);
return "total: "+(parseFloat(data1[a.seriesIndex])+parseFloat(data2[a.seriesIndex])+parseFloat(data3[a.seriesIndex])+parseFloat(data4[a.seriesIndex]));
}else {
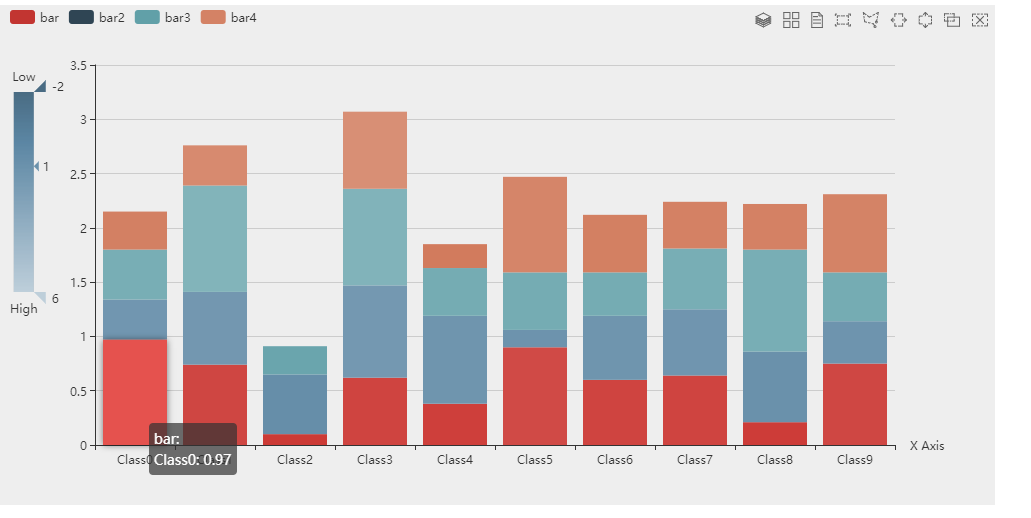
return a.componentSubType+":<br>"+a.name+": "+a.value;
}
}
},Only one of the Class0 displays is implemented here, and the effect is as follows 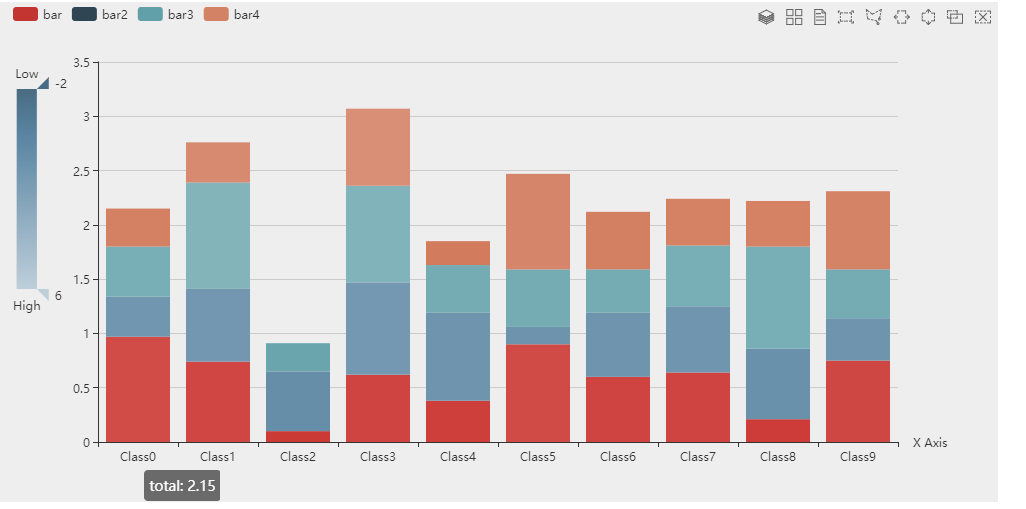
This is the end of the course. There are shortcomings. If you set the delay time to 2 seconds, the tooltip will have 2 seconds to disappear. If you don't set the X-axis label, the tooltip will disappear in seconds. If you have a better way, welcome to discuss the message!!!