Echarts functional defragmentation
. (Note: since the echarts in the system are all displayed in the foreground after data encapsulation in the background, I can only use the examples provided on the official website for some screenshots.)
1. Data mark in curve (markPoint)
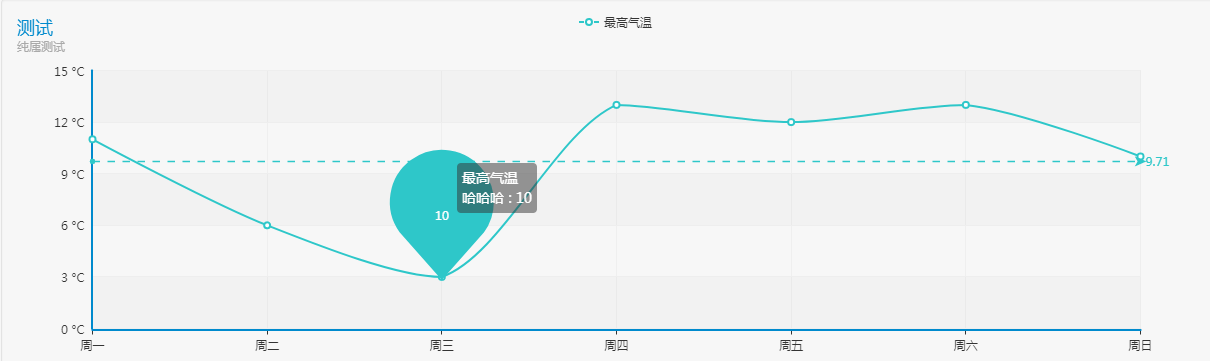
- Application scenario: in a set of data, some special points need to be marked as the key display.
  series : [
        {
            name:'Maximum temperature',
            type:'line',
            data:[11, 6,3, 13, 12, 13, 10],
            markPoint : {
                data : [
                  {
                    name:'Ha ha ha',
                    value:'10',
                    xAxis:'Wednesday',//Controls the position of dimensions in the x-axis direction
                    yAxis:'3'//Controls the position of dimensions in the y-axis direction
                  }
                ],
               symbolSize :50//Control dimension size
            },
            markLine : {
                data : [
                    {type : 'average', name: 'average value'}
                ]
            }
        }
    ]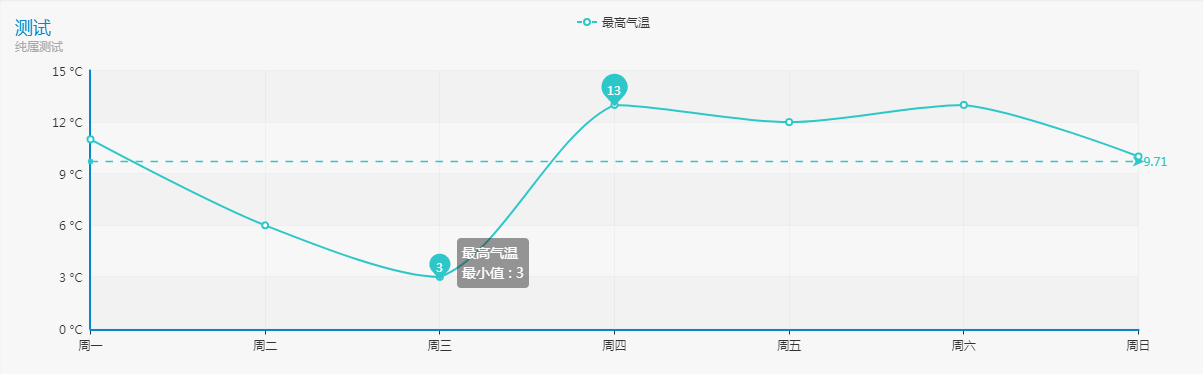
- Application scenario: input a set of data, mark the maximum and minimum values automatically, and draw the average line automatically
 series : [
        {
            name:'Maximum temperature',
            type:'line',
            data:[11, 6,3, 13, 12, 13, 10],
            markPoint : {
                data : [
                    {type : 'max', name: 'Maximum value'},
                    {type : 'min', name: 'minimum value'}
                ]
            },
            markLine : {
                data : [
                    {type : 'average', name: 'average value'}
                ]
            }
        }
    ]
2. Content format and position control of custom mouse hover prompt box
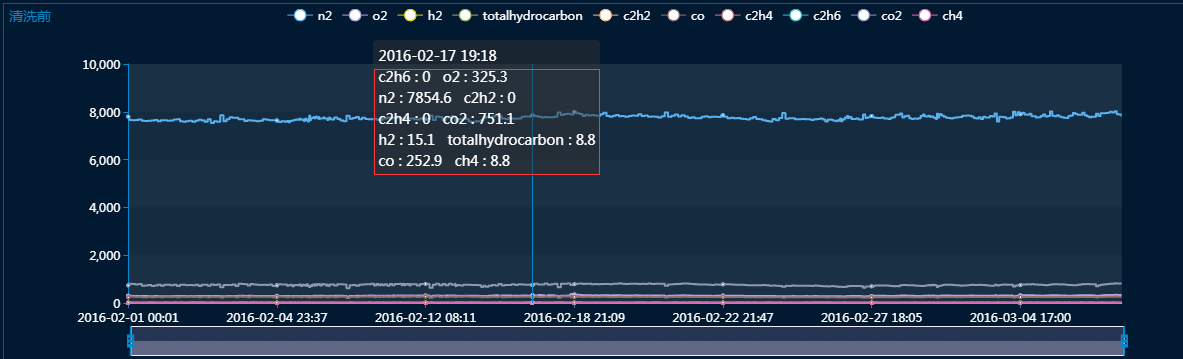
- Application scenario: if there are many content in the prompt box or other special requirements, you need to customize the content of the prompt box and display location.
tooltip : {
trigger: 'axis',
formatter: function(params) {//You can customize the content of the prompt box here
var res = params[0].name+'<br/>';
for(var i=0;i<params.length;i++){
if(i%2==1){
res+=params[i].seriesName+' : '+params[i].data+'<br/>';
}else{
res+=params[i].seriesName+' : '+params[i].data+'   ';
}
}
return res;
},
position: function (point, params, dom, rect, size) {
// Fixed on top
return [point[0]*0.7, '10%'];//Here you can control the position of the prompt box
}
},3. Font size, color and other style control
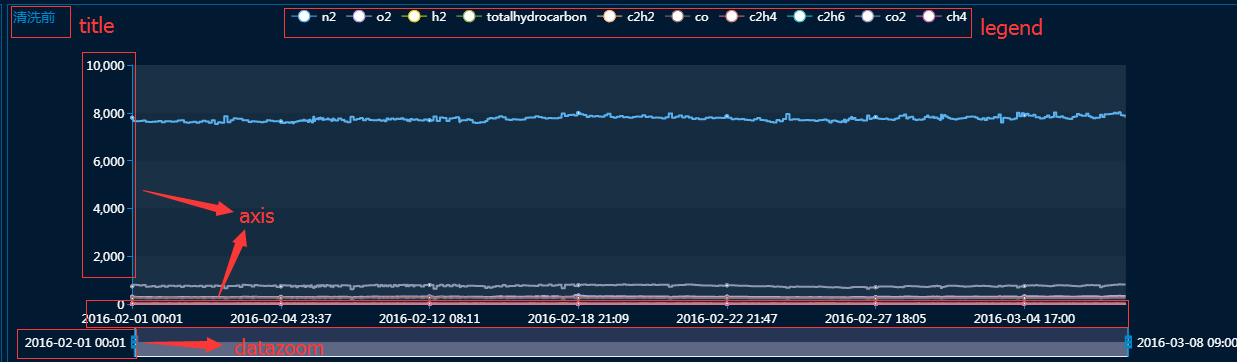
- Application scenario: different systems may have different fonts and colors
            title : {
                text: 'Before cleaning',
                subtext: '',
                textStyle:{
                    fontSize: 14
                    fontWeight: 'bolder'
                    color: '#333'
                }
             },
             legend: {
                    data:chartMap.legendData[0],
                    textStyle : {
                        color : 'white'
                    },
             },
             dataZoom : {
                    textStyle:{
                        color : 'white'
                    },
                    show : true,
                    realtime : true,
                    start : 0,
                    end : 100
            },
            axisLabel : {
                    show : true,
                    textStyle : {
                        color : 'white',
                        fontFamily : 'sans-serif'
                    }
            },