Baidu Echarts 3.0 As an important open source library for front-end domain visualization, it is often used in our daily work and life, so it is necessary to understand the source code of Echarts together. I'm going to introduce the use and source code of Echarts 3.x in a series. Some demo s and other source codes that are not introduced in the blog please come to me. github warehouse.
The Echarts version of this blog is based on 3.3.2.
The source code of Echarts is encapsulated on the basis of zrender, so to understand the source code of echarts, you need to know the source code of zrender first, but for the independent readability of this blog, here will also be a brief description of the source code of zrender used. If you want to know the specific source code of zrender, this paper gives the source code interpretation blog and source code annotation repository of zrender.
Github warehouse: https://github.com/zrysmt/echarts3/tree/master/zrender
ECharts 3.0 Bottom Level zrender 3.x Source Analysis 1-Overall Architecture
ECharts 3.0 Bottom Level zrender 3.x Source Analysis 2-Painter (Layer V)
ECharts 3.0 Bottom Level zrender 3.x Source Analysis 3-Handler (Layer C)
1. Source structure and packaging
1.1 Source Packaging
The source code is packaged with webpack. Looking at the file webpack.config.js, we can see that the echarts source code is compiled into three versions: common version, compact version and complete version. The corresponding webpack entry files are index.common.js, index.simple.js and index.js, respectively.
Note: The three files refer to the files under the lib file. After executing the command npm insall, you can get the lib folder. The main contents of the files in the lib folder are the same as those in the src folder. The difference is that the former file is packaged in a CMD-like mode, while the latter file is packaged through webpack. We will analyze the source code under the src folder below. Notes are also included.
The order of execution is
npm install  //Install all dependency packages
webpack      //Pack
webpack -p   //Put it into a compressed package (.min.js)
The final generated file is in the dist folder.
1.2 Source Architecture
First of all, we need to understand two important concepts: components and charts: charts refer to various types of graphs, such as line, bar, pie, etc. In configuration items, they refer to the corresponding configuration of series; components refer to other items in configuration items besides series, such as title, legend, toobox, etc.
Important directories of source code and instructions are as follows (Note: dist is a compiled folder)
- extension (used in extensions)
- lib (not in source code, only after webpack compilation)
- Map (js and json file formats for world map, Chinese map and map of China's provinces)
- src (core source code)
- test (example demo)
- theme
2 Rendering
Complete example code Poke me.
The outermost layer is the div with id as main, which we wrote ourselves to render echarts charts.
echarts renders two divs. One div is used to render the main chart. A canvas tag is embedded in the Div.
The second div is to display the hover layer information. 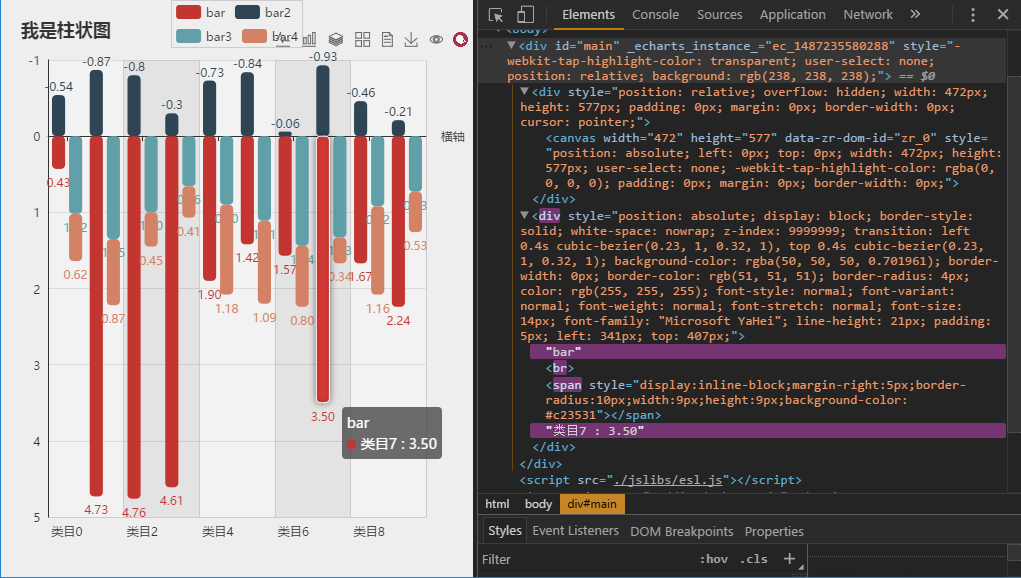
3. Entry echarts.js
Location: src/echarts.js.
The general structure is a constructor (ECharts), multiple methods on the prototype (ECharts.prototype), and an echarts object (including attributes and methods on the object).
Like zrender, init method is used for initialization.
3.1 init method
Source code:
echarts.init = function(dom, theme, opts) {
    if (__DEV__) {//Is it debug mode?
        //...//Misjudgement is omitted
    }

    var chart = new ECharts(dom, theme, opts);//Instantiate ECharts
    chart.id = 'ec_' + idBase++;//chart instance id number, unique, incremental one by one
    instances[chart.id] = chart;//Unique instance object

    dom.setAttribute &&
        dom.setAttribute(DOM_ATTRIBUTE_KEY, chart.id);//An attribute is set for the outer dom with a value equal to chart.id

    enableConnect(chart);//Update the status in sequence, a total of three states
        /*var STATUS_PENDING = 0;
        var STATUS_UPDATING = 1;
        var STATUS_UPDATED = 2;*/

    return chart;
};- If (_DEV_) verification is debug mode, if it is there will be an error prompt (error judgment is omitted), or is it production mode, no error prompt?____________
- Parameter description
/**
*@ Param {HTML DomElement} DOM instance container, typically a div element with a high width
 *@ param {Object} [theme] theme (see below for instructions)
*@ param {Object} opts configuration properties, the following properties
* @param {number} [opts.devicePixelRatio] Use window.devicePixelRatio by default
* @param {string} [opts.renderer] Currently only 'canvas' is supported.
* @param {number} [opts.width] Use clientWidth of the input `dom` by default.
*                              Can be 'auto' (the same as null/undefined)
* @param {number} [opts.height] Use clientHeight of the input `dom` by default.
*                               Can be 'auto' (the same as null/undefined)
*/- Theme theme
/* Themes can be downloaded from the official website (http://echarts.baidu.com/download-theme.html), or built by yourself.
 * use:
 * <script src="theme/vintage.js"></script>
 * <script>
 *// The second parameter specifies the previously introduced topic
 * var chart = echarts.init(document.getElementById('main'), 'vintage');
 * </script>
 */
Use:
var chart = echarts.init(document.getElementById('main'), null, {
   renderer: 'canvas'});
3.2 constructor
Inside the constructor are the initialization of attributes and the initialization of zrender (this._zr).
function ECharts(dom, theme, opts) {
    opts = opts || {};
    if (typeof theme === 'string') {
        theme = themeStorage[theme];
    }
    this.id;
    this.group;
    this._dom = dom;
    var zr = this._zr = zrender.init(dom, {
        renderer: opts.renderer || 'canvas',
        devicePixelRatio: opts.devicePixelRatio,
        width: opts.width,
        height: opts.height
    });//The zrender processing used for the third parameter of the constructor

    this._throttledZrFlush = throttle.throttle(zrUtil.bind(zr.flush, zr), 17);
    this._theme = zrUtil.clone(theme);
    this._chartsViews = [];//Store all charts for later rendering of this variable
    this._chartsMap = {};
    this._componentsViews = [];//Store the properties of the configuration item component to render it for later convenience
    this._componentsMap = {};
    this._api = new ExtensionAPI(this);
    //this._api has'getDom','getZr','getWidth','getHeight','dispatchAction','Is Disposed',
    //'on','off','getData URL','getConnectedData URL','getModel','getOption'method object
    this._coordSysMgr = new CoordinateSystemManager();
    Eventful.call(this);
    this._messageCenter = new MessageCenter();
    this._initEvents();//Initialize mouse events
    this.resize = zrUtil.bind(this.resize, this);

    this._pendingActions = [];
    function prioritySortFunc(a, b) {
        return a.prio - b.prio;
    }
    timsort(visualFuncs, prioritySortFunc);
    timsort(dataProcessorFuncs, prioritySortFunc);
    zr.animation.on('frame', this._onframe, this);
}
3.3 setOption
First, let's look at the use of api. As we mentioned earlier, we initialize echarts using init method. Next, we only need to configure option to get the rendered graph. There are many omitted examples, complete example code Poke me.
chart.setOption({
    backgroundColor: '#eee',
    title: {
        text: 'I'm a histogram.',
        padding: 20
    },
    legend: {
        inactiveColor: '#abc',
        borderWidth: 1,
        data: [{name: 'bar'}, 'bar2', '\n', 'bar3', 'bar4'],
        align: 'left',
        tooltip: {show: true }
    },
    toolbox: {
        top: 25,
        feature: {
            magicType: { type: ['line', 'bar', 'stack', 'tiled']},
            dataView: {},
            saveAsImage: {pixelRatio: 2}
        },
        iconStyle: {
            emphasis: {textPosition: 'top'}
        }
    },
    tooltip: {},
    xAxis: { //...
    },
    yAxis: { //...
    },
    series: [{
        name: 'bar',   type: 'bar',   stack: 'one',
        itemStyle: itemStyle,  data: data1
    }, {
        name: 'bar2',  type: 'bar',  stack: 'one',
        itemStyle: itemStyle,  data: data2
    }, { //... ...
    }, { //... ...
    }]
});
The main parts of the source code are listed below:
/**
 * @param {Object} option Configuration item
 * @param {boolean} notMerge Optionally, do not merge with the previously set option, default to false, that is, merge.
 * @param {boolean} [lazyUpdate=false] Useful when setOption frequently.
 * //Optionally, if the chart is not updated immediately after the option is set, the default is false, that is to say, it is updated immediately.
 */
echartsProto.setOption = function(option, notMerge, lazyUpdate) {

    this[IN_MAIN_PROCESS] = true;

    if (!this._model || notMerge) { //Not merging with previous option s
        var optionManager = new OptionManager(this._api); //option configuration management
        var theme = this._theme;
        var ecModel = this._model = new GlobalModel(null, null, theme, optionManager);
        ecModel.init(null, null, theme, optionManager);
        //When not merged, it is redrawn, and option is the last parameter to use the setOption method
    }


    this.__lastOnlyGraphic = !!(option && option.graphic); //Whether the graphic s property is set
    //Graphics is a component of native graphic elements. Graphic elements that can be supported include: image, text, circle, sector,
    //ring, polygon, polyline, rect, line, bezierCurve, arc, group,
    //http://echarts.baidu.com/option.html#graphic
    zrUtil.each(option, function(o, mainType) {
        mainType !== 'graphic' && (this.__lastOnlyGraphic = false);
    }, this);

    //The list of functions that were executed before setOption optionPreprocessorFuncs
    this._model.setOption(option, optionPreprocessorFuncs);

    if (lazyUpdate) { //For true, do not update immediately
        this[OPTION_UPDATED] = true;
    } else {
        updateMethods.prepareAndUpdate.call(this); //Prepare for renewal
        // Ensure zr refresh sychronously, and then pixel in canvas can be
        // fetched after `setOption`.
        this._zr.flush(); //Call the method in zrender to refresh immediately
        this[OPTION_UPDATED] = false;
    }

    this[IN_MAIN_PROCESS] = false;

    flushPendingActions.call(this, false);
};
Note: The order of setOption calls here is echarts. setOption=> GlobalModel. setOption (GlobalModel. js)=> OptionManager. setOption (OptionMManager. js)
There are two key methods: prepareAndUpdate and flush, which are used to prepare for refresh and refresh and render graphs respectively. Let's take a step-by-step look at the prepareAndUpdate method.
3.4 doRender method
Next, the prepareAndUpdate method above looks at the order of execution for preparing to render graph views: updateMethods. prepareAndUpdate=> updateMethods. update=> doRender=> render.
Render all components and charts in the doRneder function. The render method should be implemented in each component and charts respectively.
function doRender(ecModel, payload) {
    var api = this._api;
    // Render all components render all configuration components, such as title,grid,toolbox,tooltip, etc.
    each(this._componentsViews, function(componentView) {
        var componentModel = componentView.__model;
        console.info("componentModel:", componentModel);
        componentView.render(componentModel, ecModel, api, payload);
        //Call the render method under the componentModal folder
        updateZ(componentModel, componentView);
    }, this);

    each(this._chartsViews, function(chart) {
        chart.__alive = false;
    }, this);

    // Render all charts render all charts
    ecModel.eachSeries(function(seriesModel, idx) {
        var chartView = this._chartsMap[seriesModel.__viewId]; //this._chartsMap
        chartView.__alive = true;

        chartView.render(seriesModel, ecModel, api, payload);
        chartView.group.silent = !!seriesModel.get('silent');

        updateZ(seriesModel, chartView);
        updateProgressiveAndBlend(seriesModel, chartView);

    }, this);

    // If use hover layer, update hover layer if use hover layer
    updateHoverLayerStatus(this._zr, ecModel);

    each(this._chartsViews, function(chart) {
        if (!chart.__alive) {
            chart.remove(ecModel, api);
        }
    }, this);
}
4. Processing of option
Part 3.3 has already said how to use setOption to handle configuration options. Here's how to manage configuration items in the source code. The main source code is echarts/model/Model (hereinafter referred to as Model), echarts/model/Global (hereinafter referred to as Global Model, inheritance model), echarts/model/Option Manager (hereinafter referred to as Option Manager)
this._model.setOption(option, optionPreprocessorFuncs);Note that there is an object, this._model, that stores configuration options.
Model module is a basic method, the main method is get,getModel obtains the object value through the object name of options. It also mixes lineStyle, areaStyle, textStyle,itemStyle methods to manage options attributes related to lines, text, and projects.
GlobalModel inherits the Model, exposes the Model's methods, and encapsulates some of its own unique methods.
Option Manager is used to manage options configuration items. There are important setOption methods, mergeOption methods (private methods, merge options), parseRawOption methods (private methods, parse options)
5.component components and charts charts
component components and charts charts have render methods, which we will focus on exploring.
5.1 component component
Component components correspond to the attributes of configuration items one by one. For complex configuration items, the management mode under component folders is MVC. For example, there are basic LegendModel.js(M),LegendView(V),LegendAction(C) under the legend folder. Like other components, there may be other js files.
Let's start with a simpler example, title.js, and analyze its render method.
- The first is to use the extended Component Model, which is equivalent to the Model layer, to configure some default configuration items (some of the complexities separate these into a Model file).
- Then there is the extended ComponentView, which is equivalent to the View layer, where the render method (some complex points will separate these into a single View file).
The first step in the render method, of course, is to get the content of the configuration options object. Get the corresponding attribute path by titleModel.getModel (path) (each component will have a corresponding Model name).
Then call new graphic.Text() to call the method in zrender and render it to canvas. The specific implementation refers to the analysis content of zrender source code given above.
5.2 charts chart
Under the charts folder are various types of charts, including line, bar, pie, map and so on. Under each type of folder, there are several js files at the end of the following files.
+ ** Series.js inherits the basic methods in src/modal/series.js to manage the series attributes in the configuration, and also provides default Option for some default configurations.
+ ** Veiw.js inherits to src/view/Chart.js (which corresponds to the interface and has no specific implementation), the main method is render, rendering the view
The render method calls the contents of zrender.js, such as lineView.js, which calls new graphic.Rect.
6. incident
Use in the example:
chart.on('click', function(params) {
    console.log(params);
});
Key source code:
function createRegisterEventWithLowercaseName(method) {
  return function (eventName, handler, context) {
     // Event name is all lowercase
     eventName = eventName && eventName.toLowerCase();
     Eventful.prototype[method].call(this, eventName, handler, context);
   };
}
echartsProto.on = createRegisterEventWithLowercaseName('on');
echartsProto.off = createRegisterEventWithLowercaseName('off');
echartsProto.one = createRegisterEventWithLowercaseName('one');
Eventful uses zrender/mixin/Eventful, which is event extension, including on,off,one,trigger and so on.
We know that the canvas API does not provide a mechanism for monitoring each element, which requires some processing. The idea is to listen for the coordinates of the event (such as the coordinates at the time of clicking), determine which drawing element is in the range, and if it is in an element, listen for the event. Specific ideas can be seen Event Processing of Graphics Drawn by HTML5 Canvas.
Reference reading:
- Chinese official website in echarts 3
- echarts 3 github website
- ECharts 3.0 Bottom Level zrender 3.x Source Analysis 1-Overall Architecture
- ECharts 3.0 Bottom Level zrender 3.x Source Analysis 2-Painter (Layer V)
- ECharts 3.0 Bottom Level zrender 3.x Source Analysis 3-Handler (Layer C)