Decision tree is the basic building block of gradient elevator and random forest. Visual decision tree is very helpful in learning the working principle and interpretability of these models. However, the current visualization package is still very rudimentary and does not help novices much.
When I visited Github recently, I found a great dtreeviz tool library: it is used for decision tree visualization and model interpretation. Using dtreeviz, we can visualize how the feature space is divided on the decision node, how the training samples are distributed in the leaf nodes, how the tree predicts specific observations, and so on. These operations are critical to understanding how classification or regression decision trees work.
Note: technical exchange group is provided at the end of the text
install
pip install dtreeviz             # install dtreeviz for sklearn
pip install dtreeviz[xgboost]    # install XGBoost related dependency
pip install dtreeviz[pyspark]    # install pyspark related dependency
pip install dtreeviz[lightgbm]   # install LightGBM related dependency
usage
dtree: the main function of creating decision tree visualization. Given a decision tree regressor or classifier, create and return a tree visualization using graphviz.
Required libraries
Import the required basic libraries
from sklearn.datasets import *
from sklearn import tree
from dtreeviz.trees import *
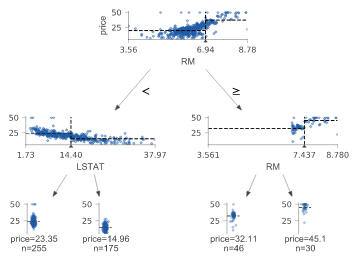
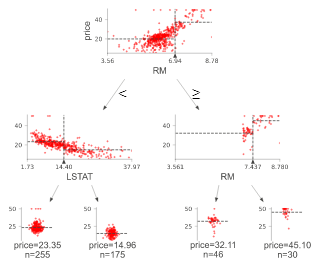
Regression decision tree
The default orientation of the tree is top-down, but you can use orientation = "LR" to change it from left to right. view() gives a pop-up window with a rendered graphviz object.
regr = tree.DecisionTreeRegressor(max_depth=2)
boston = load_boston()
regr.fit(boston.data, boston.target)

viz = dtreeviz(regr,
               boston.data,
               boston.target,
               target_name='price',
               feature_names=boston.feature_names)

viz.view()
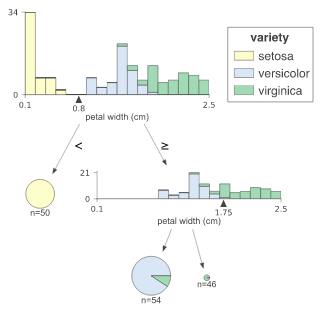
Classification decision tree
Class is required for classification tree_ Names, which gives the mapping between class value and class name.
classifier = tree.DecisionTreeClassifier(max_depth=2)  # limit depth of tree
iris = load_iris()
classifier.fit(iris.data, iris.target)

viz = dtreeviz(classifier,
               iris.data,
               iris.target,
               target_name='variety',
               feature_names=iris.feature_names,
               class_names=["setosa", "versicolor", "virginica"]  # need class_names for classifier
              )

viz.view()
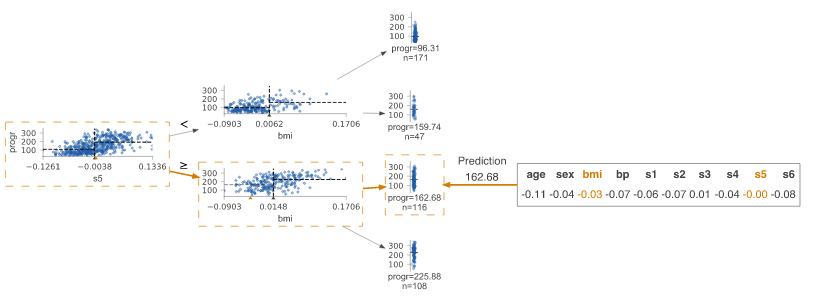
Prediction path
Highlight the decision node where the eigenvalue of a single observation passed in parameter X is located. The observed eigenvalues are given and the characteristics of the tree used to traverse the path are highlighted.
regr = tree.DecisionTreeRegressor(max_depth=2)  # limit depth of tree
diabetes = load_diabetes()
regr.fit(diabetes.data, diabetes.target)
X = diabetes.data[np.random.randint(0, len(diabetes.data)),:]  # random sample from training

viz = dtreeviz(regr,
               diabetes.data,
               diabetes.target,
               target_name='value',
               orientation ='LR',  # left-right orientation
               feature_names=diabetes.feature_names,
               X=X)  # need to give single observation for prediction

viz.view()
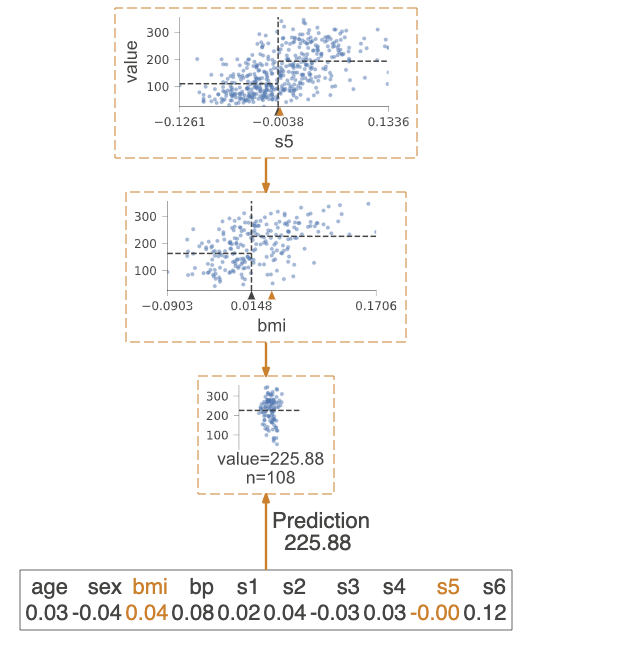
If you only want to visualize the prediction path, you need to set the parameter show_just_path=True
dtreeviz(regr,
        diabetes.data,
        diabetes.target,
        target_name='value',
        orientation ='TD',  # top-down orientation
        feature_names=diabetes.feature_names,
        X=X, # need to give single observation for prediction
        show_just_path=True
        )
Explain prediction path
These visualizations are useful for explaining to people without machine learning skills why your model makes specific predictions. In explain_ type=plain_ In the case of English, it searches in the prediction path and finds the eigenvalue range.
X = dataset[features].iloc[10]
print(X)
Pclass              3.0
Age                 4.0
Fare               16.7
Sex_label           0.0
Cabin_label       145.0
Embarked_label      2.0

print(explain_prediction_path(tree_classifier, X, feature_names=features, explanation_type="plain_english"))
2.5 <= Pclass
Age < 36.5
Fare < 23.35
Sex_label < 0.5
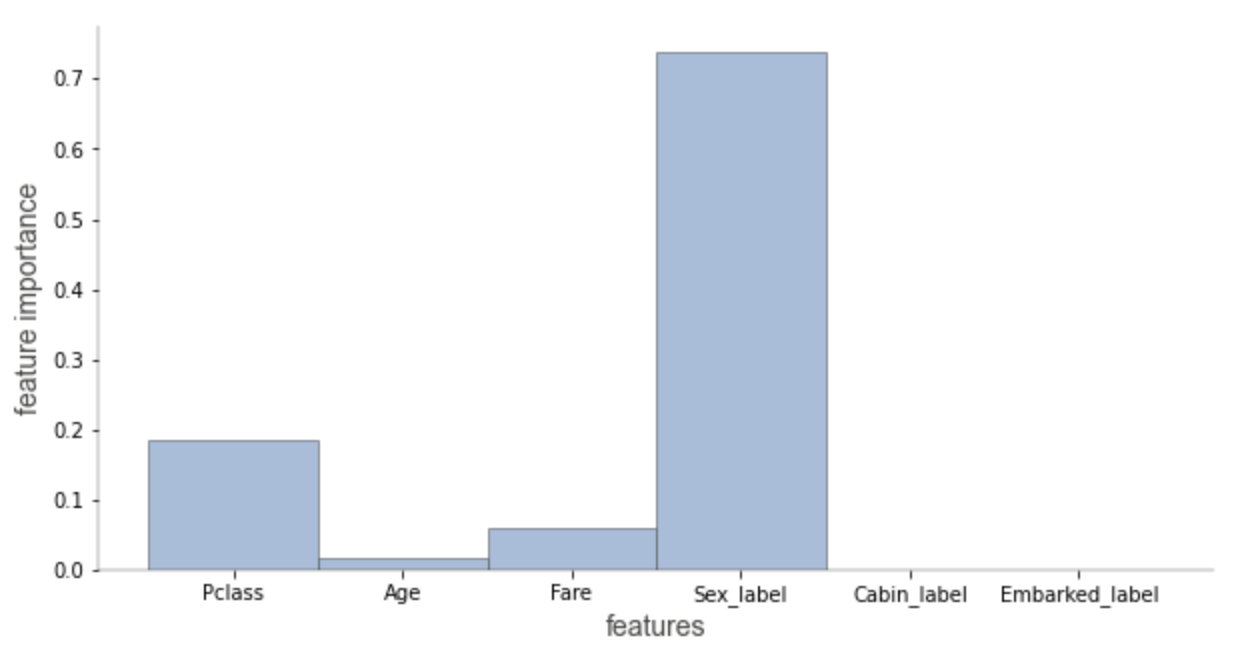
In explain_ type=sklearn_ In the case of default (scikit learn only), we can only visualize the importance of the features involved in the prediction path. The importance of characteristics is calculated based on the average reduction of impurities.
Check the beware default random forest imports article to compare the feature importance based on average impurity reduction and arrangement importance.
explain_prediction_path(tree_classifier, X, feature_names=features, explanation_type="sklearn_default")
In addition, we can also customize colors, such as
dtreeviz.trees.dtreeviz(regr,
                        boston.data,
                        boston.target,
                        target_name='price',
                        feature_names=boston.feature_names,
                        colors={'scatter_marker': '#00ff00'})
Technical exchange
Welcome to reprint, collect, gain, praise and support!

At present, a technical exchange group has been opened, with more than 2000 group friends. The best way to add notes is: source + Interest direction, which is convenient to find like-minded friends
- Method ① send the following pictures to wechat, long press identification, and the background replies: add group;
- Mode ②. Add micro signal: dkl88191, remarks: from CSDN
- WeChat search official account: Python learning and data mining, background reply: add group