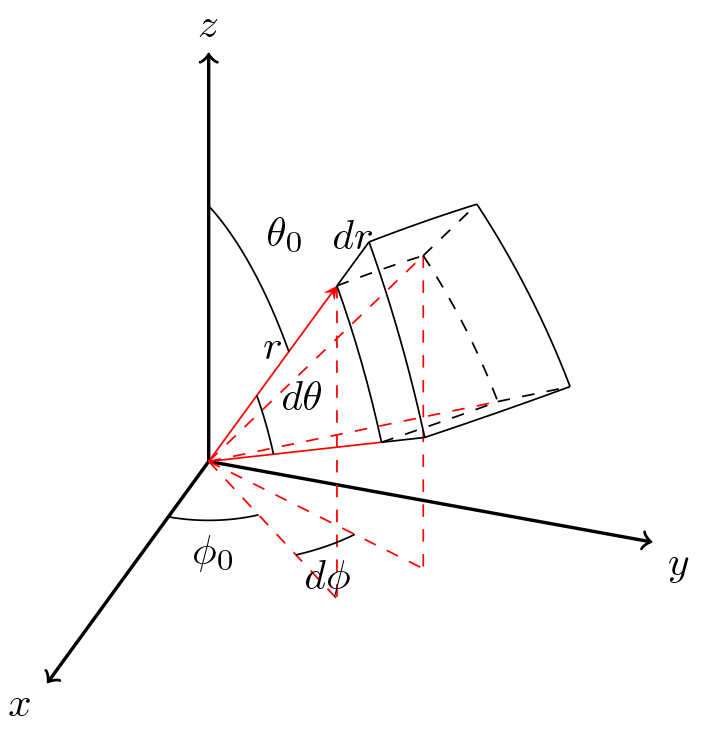
Recently, the first task is to deduce the differential equation of heat conduction in the spherical coordinate system. I think that since the derivation, it must start from drawing a good picture A kind of On the Internet, I found the diagram of volume microelements in spherical coordinate system. How to say, most of them are not very clear. Considering that they may have to mark in the diagram, the diagram on the Internet is not very satisfactory.
How about using our universal drawing tool Tikz to draw one? The idea is OK, but I haven't painted 3D before. No matter him, go first TEXample Look for it. There are many 3D examples, but an easy to understand code is the best.
After repeatedly searching, I see a relatively easy to understand: 3dplot , we decided to share it with you (you can download it on CTAN: http://www.ctan.org/tex-archive/graphics/pgf/contrib/tikz-3dplot/).
There are two main ways of drawing in this package, one is to draw in the xOy plane under the tdplot [Mian] coords, the other is to draw in the xOy plane under the tdplot [rotated] coords. The rotation parameters can be determined by the Euler angle with the command \ tdplotsetrotatedcoord{alpha}{beta}{gamma} (note that the Euler angle here is in the form of 'ZYZ'! Pay attention to the calculation). The command to draw an arc with O as the center and R as the radius under coord is \ tdplotdrawarc[coords]{(O)}{r} {θ} {θ + Δ θ}.
The effect is as follows. Well, it's very comfortable.
Attach the latex code of the drawing:
\documentclass{article}
\usepackage{verbatim}
\usepackage{tikz}
\usepackage{3dplot}
\usepackage[active,tightpage]{preview}
\PreviewEnvironment{tikzpicture}
\setlength\PreviewBorder{2mm}

\begin{document}

\tdplotsetmaincoords{60}{110}

\pgfmathsetmacro{\rvec}{.8}
\pgfmathsetmacro{\thetavec}{40}
\pgfmathsetmacro{\phivec}{45}

\pgfmathsetmacro{\dphivec}{20}
\pgfmathsetmacro{\dthetavec}{20}
\pgfmathsetmacro{\drvec}{.2}

\begin{tikzpicture}[scale=5,tdplot_main_coords]

\coordinate (O) at (0,0,0);

\tdplotsetcoord{A}{\rvec}{\thetavec}{\phivec}
\tdplotsetcoord{B}{\rvec}{\thetavec + \dthetavec}{\phivec}
\tdplotsetcoord{C}{\rvec}{\thetavec + \dthetavec}{\phivec + \dphivec}
\tdplotsetcoord{D}{\rvec}{\thetavec}{\phivec + \dphivec}

\tdplotsetcoord{E}{\rvec + \drvec}{\thetavec}{\phivec}
\tdplotsetcoord{F}{\rvec + \drvec}{\thetavec + \dthetavec}{\phivec}
\tdplotsetcoord{G}{\rvec + \drvec}{\thetavec + \dthetavec}{\phivec + \dphivec}
\tdplotsetcoord{H}{\rvec + \drvec}{\thetavec}{\phivec + \dphivec}

\draw[thick,->] (0,0,0) -- (0.8,0,0) node[anchor=north east]{$x$};
\draw[thick,->] (0,0,0) -- (0,0.8,0) node[anchor=north west]{$y$};
\draw[thick,->] (0,0,0) -- (0,0,0.8) node[anchor=south]{$z$};


\draw[-stealth,color=red] (O) -- (A) node[midway, anchor = south, color=black]{$r$};
\draw[color=red] (O) -- (B);
\draw[dashed, color=red] (O) -- (C);
\draw[dashed, color=red] (O) -- (D);

\draw[dashed, color=red] (O) -- (Axy);
\draw[dashed, color=red] (A) -- (Axy);
\draw[dashed, color=red] (O) -- (Dxy);
\draw[dashed, color=red] (D) -- (Dxy);
\draw[](A) -- (E) node[midway, anchor = south, color=black]{$dr$};
\draw[](B) -- (F);
\draw[dashed](C) -- (G);
\draw[dashed](D) -- (H);

\tdplotdrawarc{(O)}{0.2}{0}{\phivec}{anchor=north}{$\phi _0$}
\tdplotdrawarc{(O)}{0.35}{\phivec}{\phivec + \dphivec}{anchor=north}{$d\phi$}

\tdplotsetthetaplanecoords{\phivec}

\tdplotdrawarc[tdplot_rotated_coords]{(0,0,0)}{0.5}{0}{\thetavec}{anchor=south west}{$\theta _0$}
\tdplotdrawarc[tdplot_rotated_coords]{(0,0,0)}{0.3}{\thetavec}{\thetavec + \dthetavec}{anchor=south west}{$d\theta$}

\tdplotdrawarc[tdplot_rotated_coords]{(O)}{\rvec}{\thetavec}{\dthetavec + \thetavec}{}{}
\tdplotdrawarc[tdplot_rotated_coords]{(O)}{\rvec + \drvec}{\thetavec}{\dthetavec + \thetavec}{}{}

\tdplotsetthetaplanecoords{\phivec + \dphivec}
\tdplotdrawarc[dashed, tdplot_rotated_coords]{(O)}{\rvec}{\thetavec}{\dthetavec + \thetavec}{}{}
\tdplotdrawarc[tdplot_rotated_coords]{(O)}{\rvec + \drvec}{\thetavec}{\dthetavec + \thetavec}{}{}

\tdplotsetrotatedcoords{55}{-50.4313}{-6.4086}
\tdplotdrawarc[dashed, tdplot_rotated_coords]{(O)}{\rvec}{0}{12.8173}{}{}
\tdplotdrawarc[tdplot_rotated_coords]{(O)}{\rvec + \drvec}{0}{12.8173}{}{}

\tdplotsetrotatedcoords{55}{-30.3813}{-8.6492}
\tdplotdrawarc[dashed, tdplot_rotated_coords]{(O)}{\rvec}{0}{17.2983}{}{}
\tdplotdrawarc[tdplot_rotated_coords]{(O)}{\rvec + \drvec}{0}{17.2983}{}{}
\end{tikzpicture}

\end{document}
You should notice that when I rotate the coordinates, the Euler angle is the magic number!!!
In fact, this is because it uses the Euler angle of ZYZ. If it's the Euler angle of ZYX, we can directly calculate and use the directions φ and θ of point A and D(r, θ, Phi + d phi), but it's too much trouble to write analytical solutions for this ZYZ type (which may be why I can't find other people to paste the code of this volume micro element drawing ㊃). Here I use matlab to calculate it according to Phi and θ, and put it together.
function eul = getEul(theta, phi, dp)
    az=deg2rad(phi);
    el=deg2rad(90-theta);
    daz = deg2rad(dp);
    aa = [az az + daz];
    ee = [el el];
    rr = [1 1];
    [xx,yy,zz]=sph2cart(aa,ee,rr);
    p1 = [xx(1); yy(1); zz(1)];
    p2 = [xx(2); yy(2); zz(2)];
    e23 = cross(p1, p2);
    e23 = e23/norm(e23);
    e22 = cross(e23, p1);
    E0 = [1 0 0;
        0 1 0;
        0 0 1];
    rotM = [p1 e22 e23]/E0;
    eul = rotm2eul(rotM, 'ZYZ');
    eul = rad2deg(eul);
end
In the original version of matlab code, AOD (also magic number in the original Latex code) was added, but when I thought of writing blog, I couldn't find it, so I just scribbled A calculation of Euler angle. After all, I now know that the included angle of A (P1 in matlab code) and D (P2 in matlab code) is very simple.
reference material:
Euler angle and quaternion: https://www.cnblogs.com/21207-iHome/p/6894128.html
TEXample-3dplot: http://www.texample.net/tikz/examples/the-3dplot-package/

