In this article, we will introduce the use of Canvas.
Introduction to Canvas
Canvas, which we can call canvas, can draw all kinds of things on it. It's the foundation of 2D graphics rendering on Android platform. It's very powerful.
Generally speaking, there are two main characteristics of the more basic things:
1. Strong operability: Because these are the basis of the upper layer, so operability is bound to be very strong.
2. Difficult to use: various methods are too basic, it is difficult to combine these operations perfectly.
But don't worry, this series of articles will not only introduce the operation of Canvas, but also briefly introduce some design ideas and techniques.
II. Quick Lookup Table of Common Operation of Canvas
| Operation type | Related API | Remarks |
|---|---|---|
| Color rendering | drawColor, drawRGB, drawARGB | Fill the entire canvas with a single color |
| Draw basic shapes | drawPoint, drawPoints, drawLine, drawLines, drawRect, drawRoundRect, drawOval, drawCircle, drawArc | The order is point, line, rectangle, rounded rectangle, ellipse, circle and arc. |
| Draw pictures | drawBitmap, drawPicture | Drawing bitmaps and pictures |
| Draw text | drawText, drawPosText, drawTextOnPath | Drawing text, specifying the location of each text when drawing text, and drawing text according to the path in turn |
| Draw path | drawPath | This function is also needed to plot paths and Bessel curves. |
| vertex operations | drawVertices, drawBitmapMesh | By manipulating vertices, images can be deformed. DraVertices directly act on canvas and DraBitmapMesh only works on Bitmap. |
| Canvas cut | clipPath, clipRect | Set the display area of the canvas |
| Canvas snapshot | save, restore, saveLayerXxx, restoreToCount, getSaveCount | The order is to save the current state, rollback to the last saved state, save the layer state, rollback to the specified state, and get the number of saved times. |
| Canvas transformation | translate, scale, rotate, skew | The order is displacement, zooming, rotation and staggering. |
| Matrix (Matrix) | getMatrix, setMatrix, concat | The displacement and scaling of the actual canvas are all based on the image matrix Matrix, but Matrix is difficult to understand and use, so it encapsulates some commonly used methods. |
PS: The common methods of Canvas are listed in the table above. Of course, there are some other methods that are not listed. You can refer to the official documents specifically. Canvas
III. Canvas Explanation
This article mainly explains how to use Canvas to draw basic graphics.
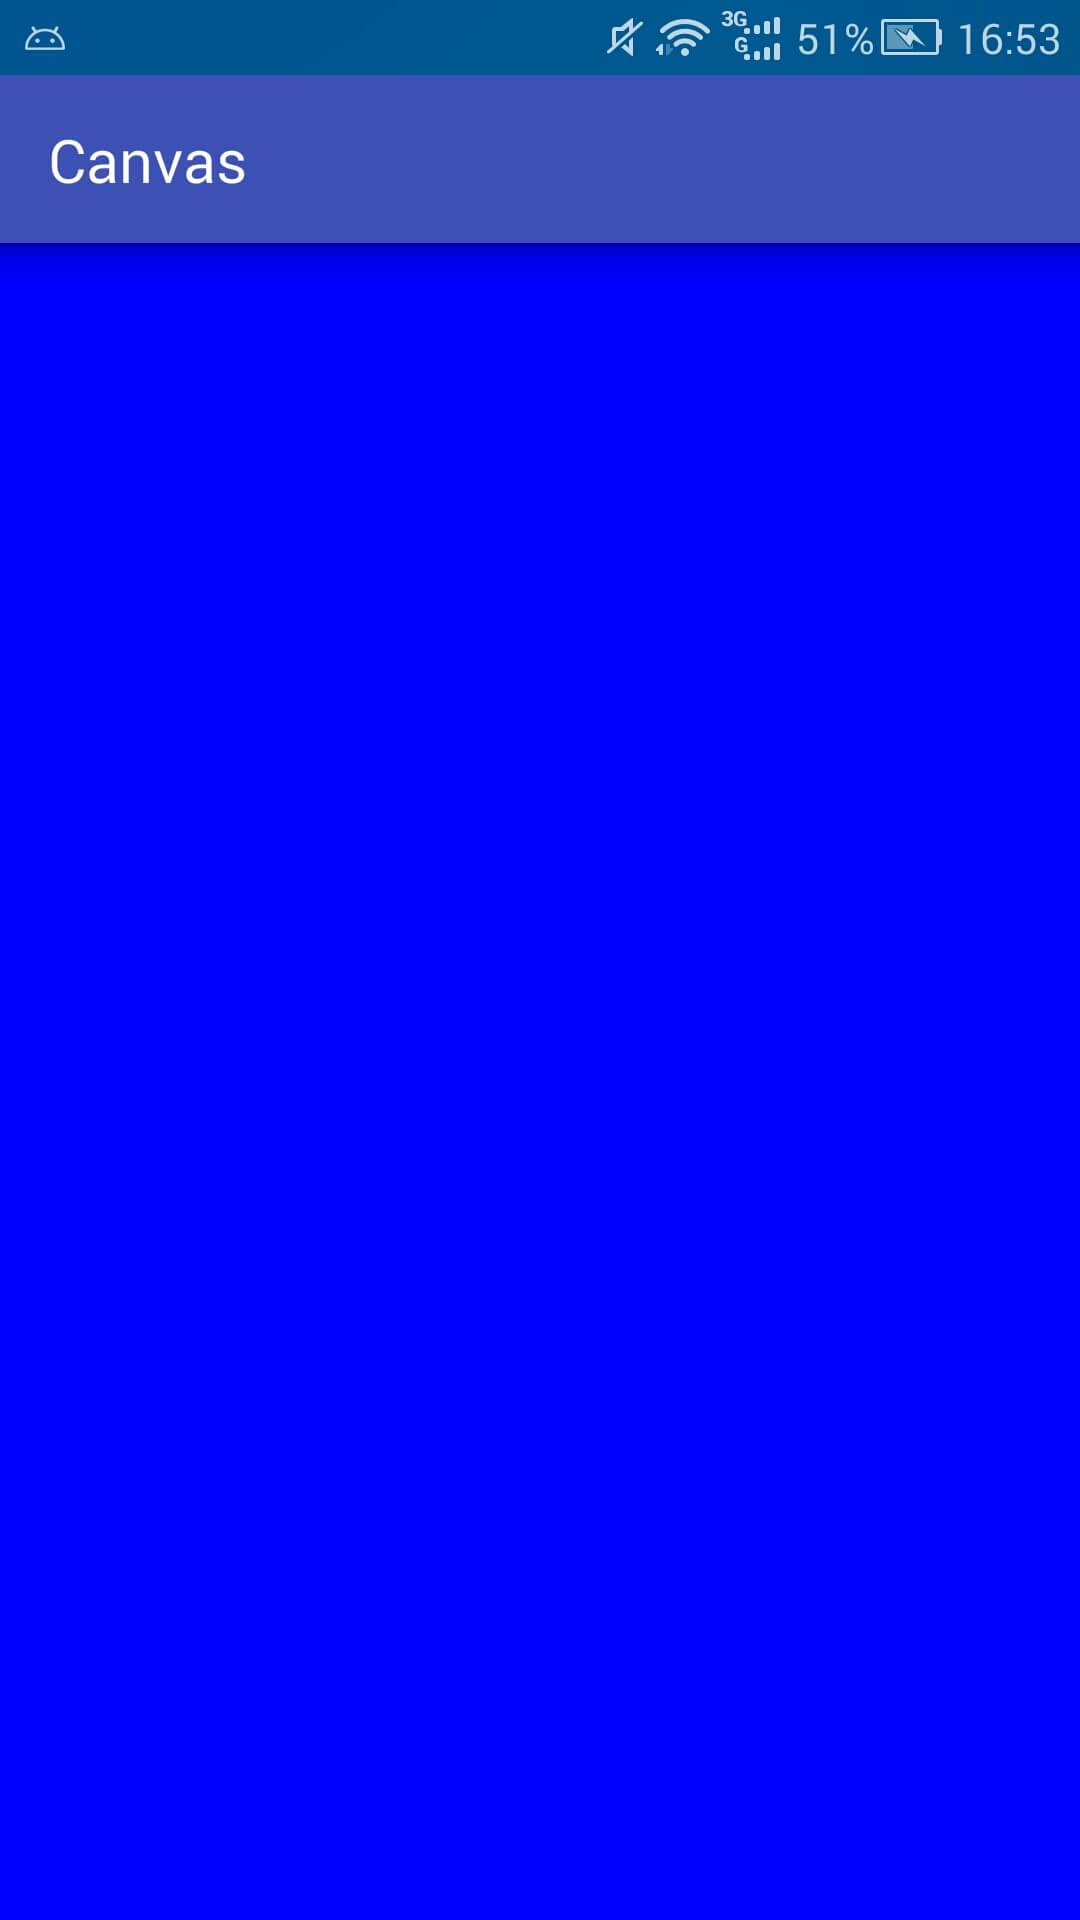
Draw color:
Drawing color is to fill the whole canvas, often used to draw background color.
canvas.drawColor(Color.BLUE); //Drawing blue
- 1
For more information on colours, please refer to Android custom View(3)_color
Create brushes:
To draw content, you first need to create a brush, as follows:
  // 1. Create a Brush
  private Paint mPaint = new Paint();

  // 2. Initialization Brush
    private void initPaint() {
        mPaint.setColor(Color.BLACK);       //setpc
        mPaint.setStyle(Paint.Style.FILL);  //Set Brush Mode to Fill
        mPaint.setStrokeWidth(10f);         //Set the brush width to 10px
    }

  // 3. Initialization in constructors
    public SloopView(Context context, AttributeSet attrs) {
        super(context, attrs);
        initPaint();
}- 1
- 2
- 3
- 4
- 5
- 6
- 7
- 8
- 9
- 10
- 11
- 12
- 13
- 14
- 15
After creating the brush, you can draw various contents in Canvas.
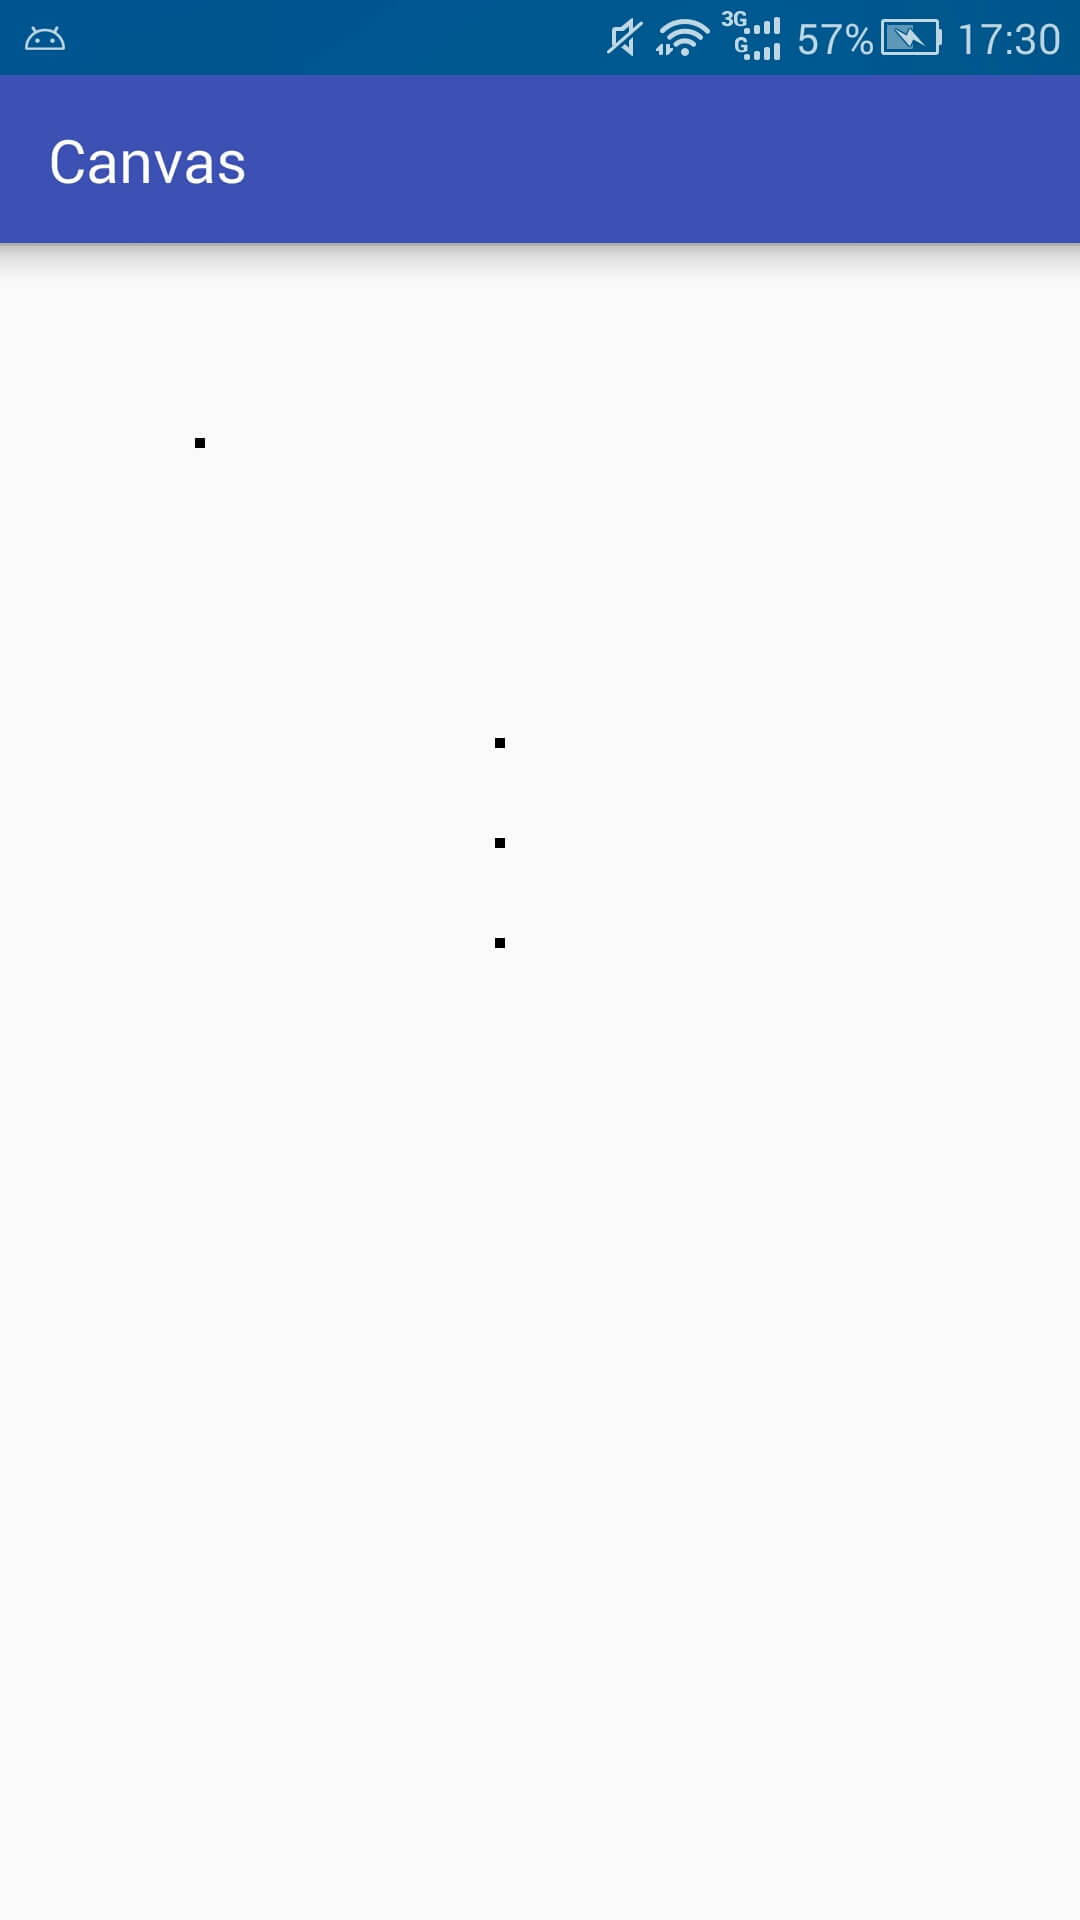
Draw points:
You can draw a point or a set of points as follows:
        canvas.drawPoint(200, 200, mPaint);     //Draw a point at coordinates (200,200)
        canvas.drawPoints(new float[]{          //Draw a set of points whose coordinate positions are specified by float arrays
                500,500,
                500,600,
                500,700
},mPaint);- 1
- 2
- 3
- 4
- 5
- 6
As for the origin of coordinates, it defaults to be in the upper left corner, increasing direction of x axis from horizontal to right, and increasing direction of y axis from vertical to downward.
See more here. Android Custom View(1)_ Coordinate System
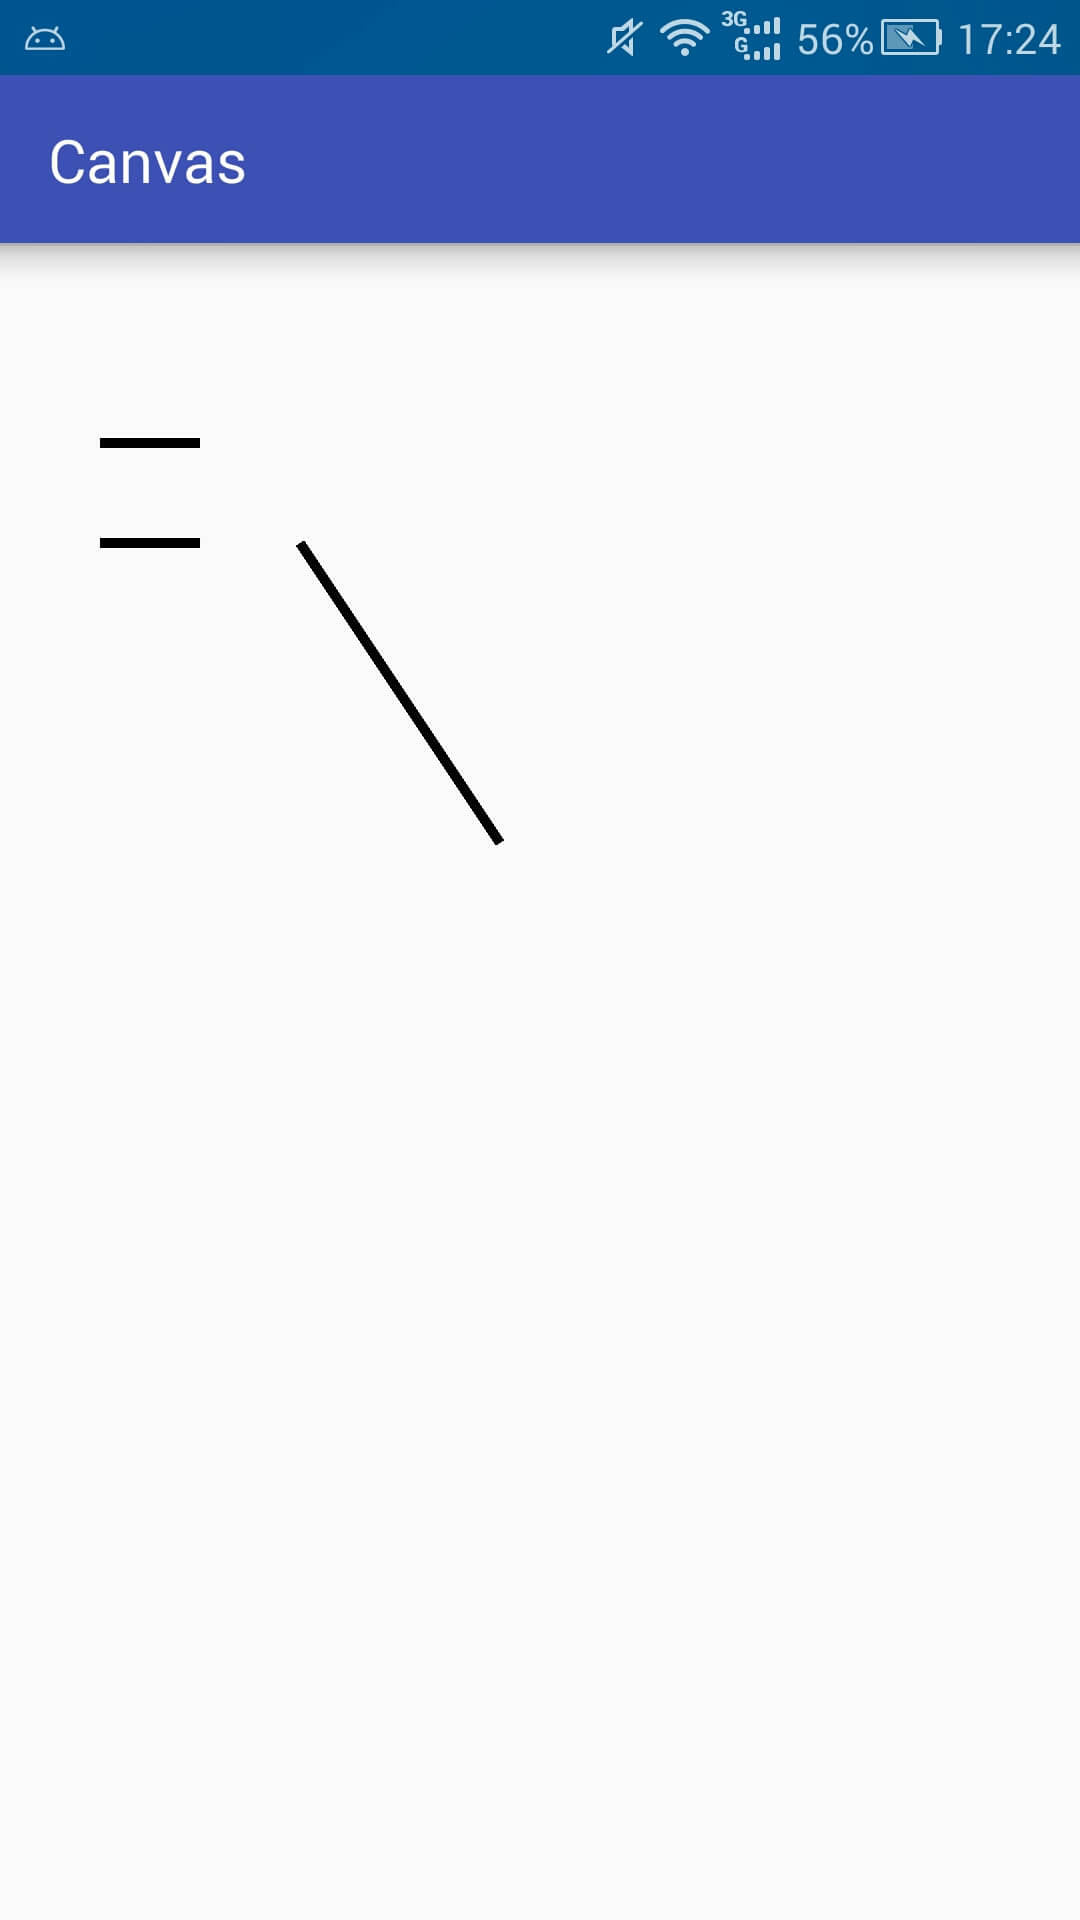
Draw a straight line:
Drawing a straight line requires two points, the initial point and the end point. Similarly, drawing a straight line can also draw one or a group of points:
 canvas.drawLine(300,300,500,600,mPaint);    // Draw a straight line between coordinates (300,300) (500,600)
        canvas.drawLines(new float[]{               // Draw a set of lines every four digits (coordinates of two points) to determine a line
                100,200,200,200,
                100,300,200,300
},mPaint);- 1
- 2
- 3
- 4
- 5
Draw a rectangle:
Determining a rectangle requires at least four data, that is, the coordinates of two points of the diagonal line, where the coordinates of the two points in the upper left corner and the lower right corner are generally used.
Canvas provides three overloading methods for drawing rectangles. The first is to provide four values (the coordinates of two points in the upper left corner and the lower right corner of the rectangle) to determine a rectangle for drawing. The other two are encapsulated as Rect or RectF (which is still a rectangle determined by two coordinate points) and then passed to Canvas for drawing, as follows:
        // First kind
        canvas.drawRect(100,100,800,400,mPaint);

        // Second kinds
        Rect rect = new Rect(100,100,800,400);
        canvas.drawRect(rect,mPaint);

        // Third kinds
        RectF rectF = new RectF(100,100,800,400);
canvas.drawRect(rectF,mPaint);- 1
- 2
- 3
- 4
- 5
- 6
- 7
- 8
- 9
- 10
The results of the above three methods are exactly the same. 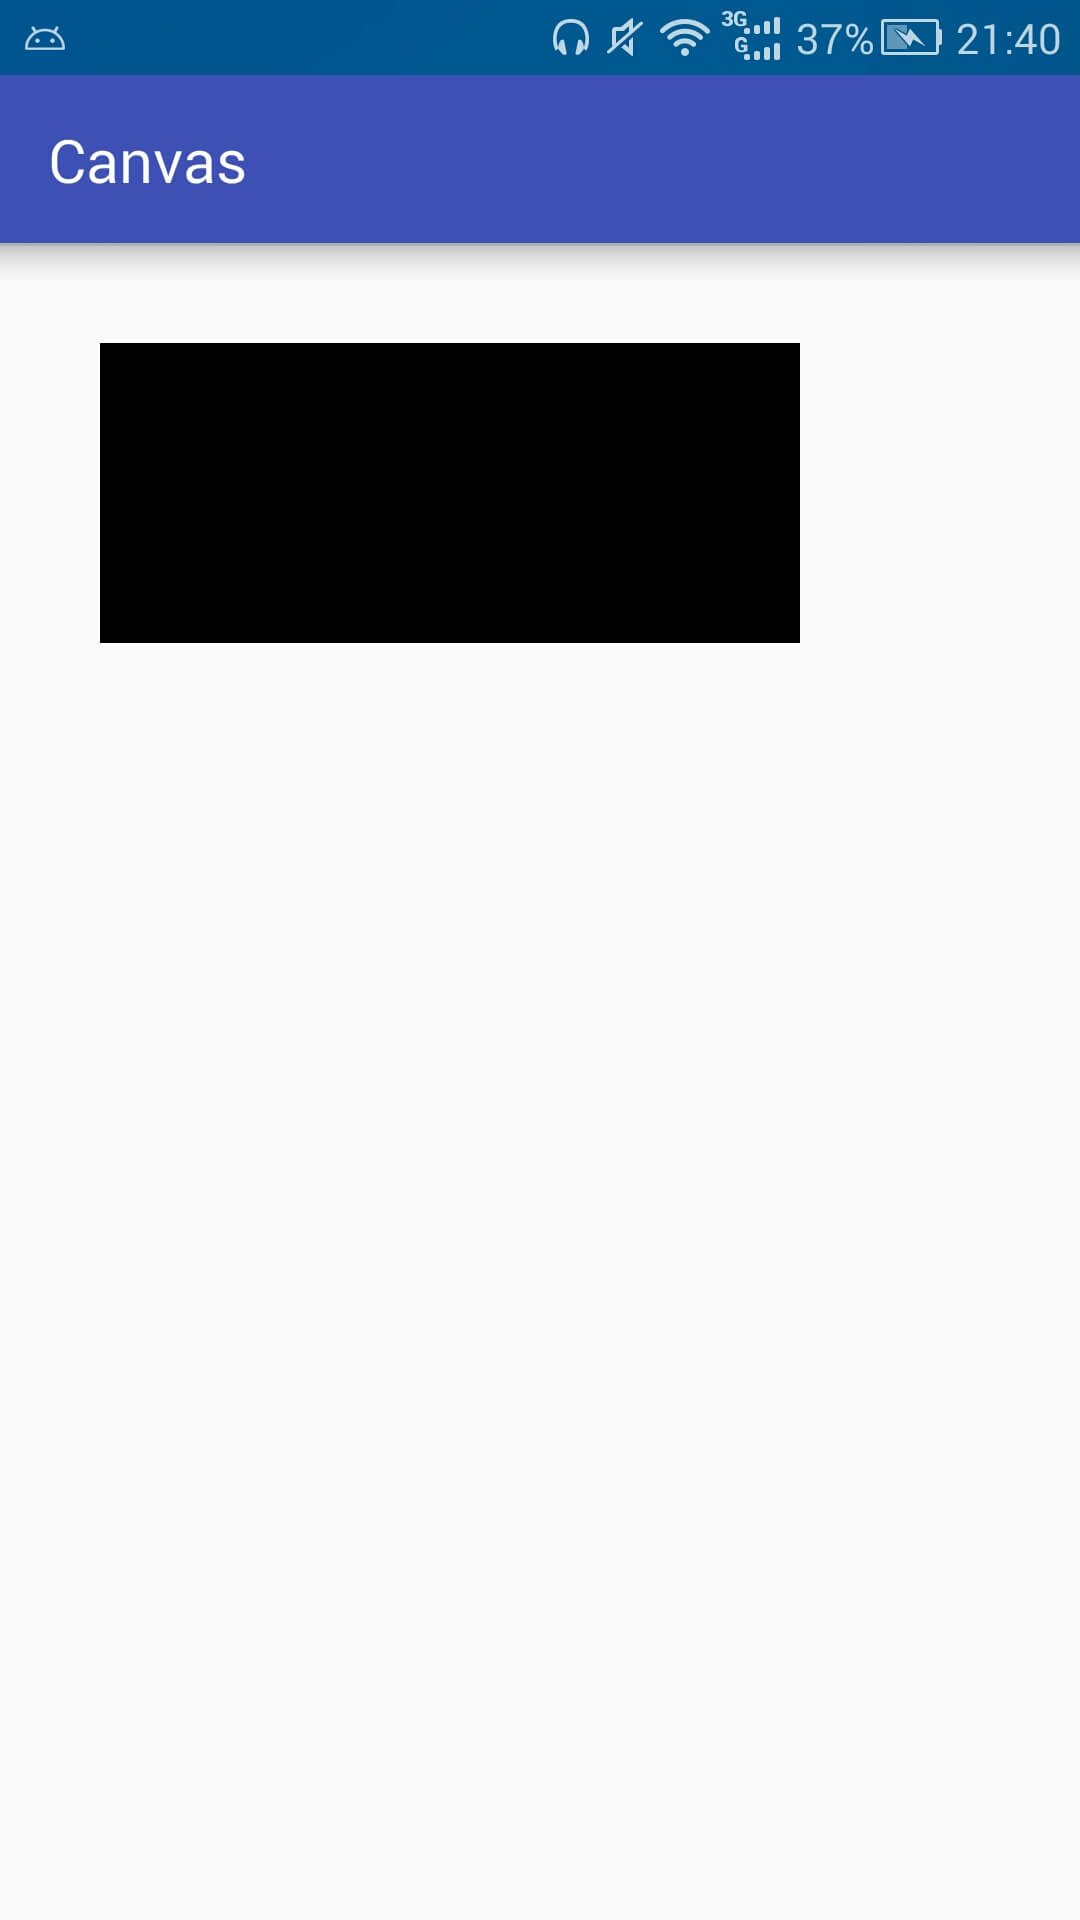
Seeing this, I believe that many audiences will have a question, why are there Rect and RectF? Is there any difference between the two?
The answer, of course, is different. The biggest difference between them is the accuracy. Rect is int, and RectF is float. In addition to the difference in accuracy, there are slight differences between the two methods.
Draw a rounded rectangle:
Drawing rounded rectangles also provides two overloading methods, as follows:
 // First kind
        RectF rectF = new RectF(100,100,800,400);
        canvas.drawRoundRect(rectF,30,30,mPaint);

        // Second kinds
canvas.drawRoundRect(100,100,800,400,30,30,mPaint);- 1
- 2
- 3
- 4
- 5
- 6
The effect of the above two methods is the same, but since the second method is added at API 21, we usually use the first method. 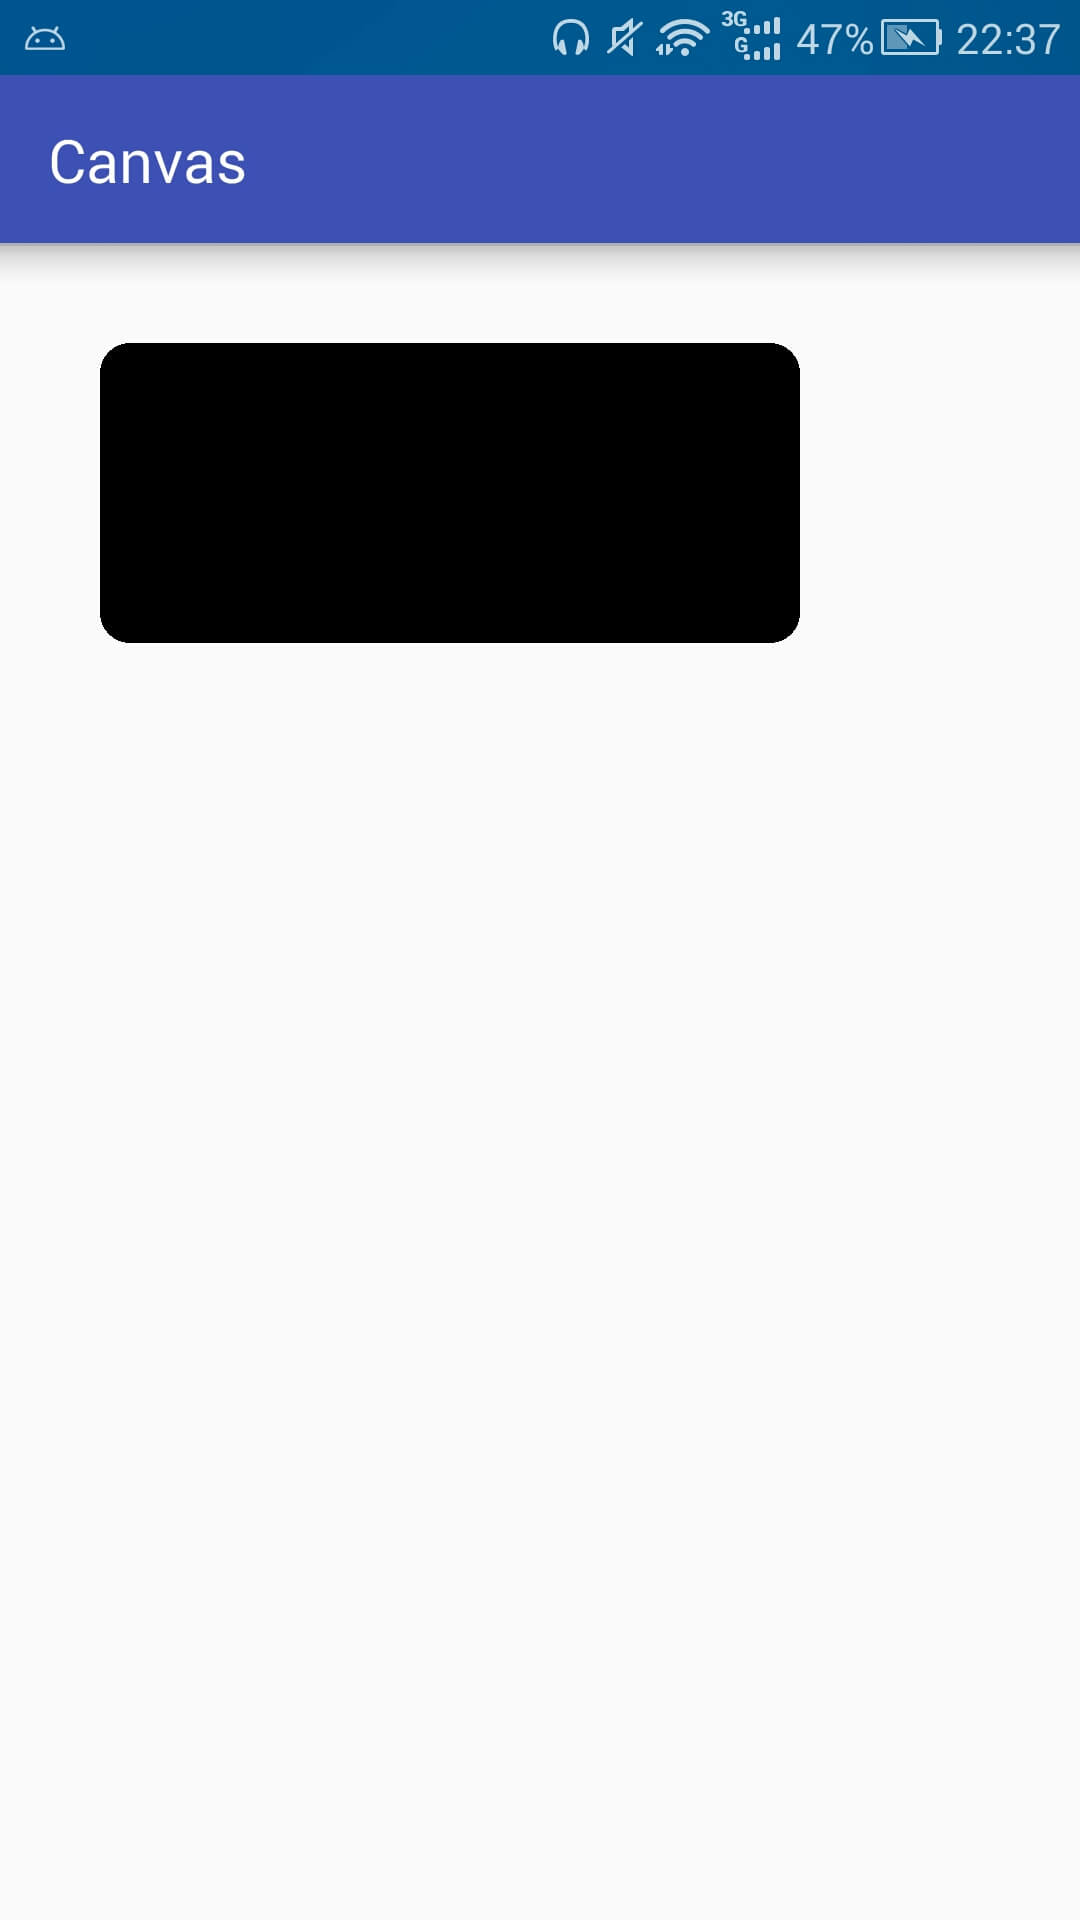
The following is a brief analysis of the meaning of several necessary parameters of a rounded rectangle.
Obviously, the first four parameters of the second method are the same as the Rotf of the first method. They are all for determining a rectangle. The last parameter Paint is a brush. Needless to say, compared with rectangle, there are two parameters rx and ry in rounded rectangle. What are these two parameters?
After a little analysis, since it is a rounded rectangle, its angle must be an arc (part of a circle). What do we usually use to determine a circle?
The answer is the center and radius, where the center is used to determine the position and the radius is used to determine the size.
Because the rectangle position has been determined, so its edge and corner position is also determined, then the parameters of determining the position can be omitted, and only the radius can be used to describe an arc.
But radius only needs one parameter, but how can there be two here?
Well, let's find out that the corner of the corner rectangle here is not actually an arc of a regular circle, but an arc of an ellipse. The two parameters here are actually two radii of the ellipse. They look like the following: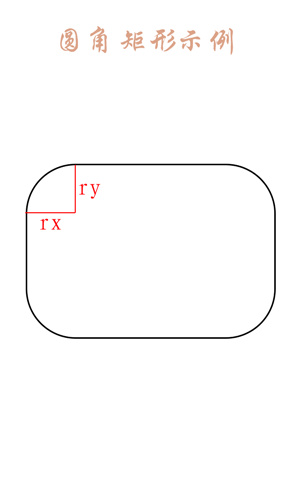
The red line labeled rx and ry are two radii, which are the two parameters that are more than the rectangle drawn.
When we understand the principle, we can do whatever we want. By calculating, we know that the width of the rectangle we drew last time is 700 and the height is 300. When you make rx greater than 350 (half of the width) and ry greater than 150 (half of the height), the miracle appears. You will find that the rounded rectangle becomes an ellipse. They draw it like this (to confirm that I changed the color of the brush, Rectangles and rounded rectangles are drawn at the same time:
  // rectangle
        RectF rectF = new RectF(100,100,800,400);

        // Draw Background Rectangle
        mPaint.setColor(Color.GRAY);
        canvas.drawRect(rectF,mPaint);

        // Draw rounded rectangle
        mPaint.setColor(Color.BLUE);
canvas.drawRoundRect(rectF,700,400,mPaint);- 1
- 2
- 3
- 4
- 5
- 6
- 7
- 8
- 9
- 10
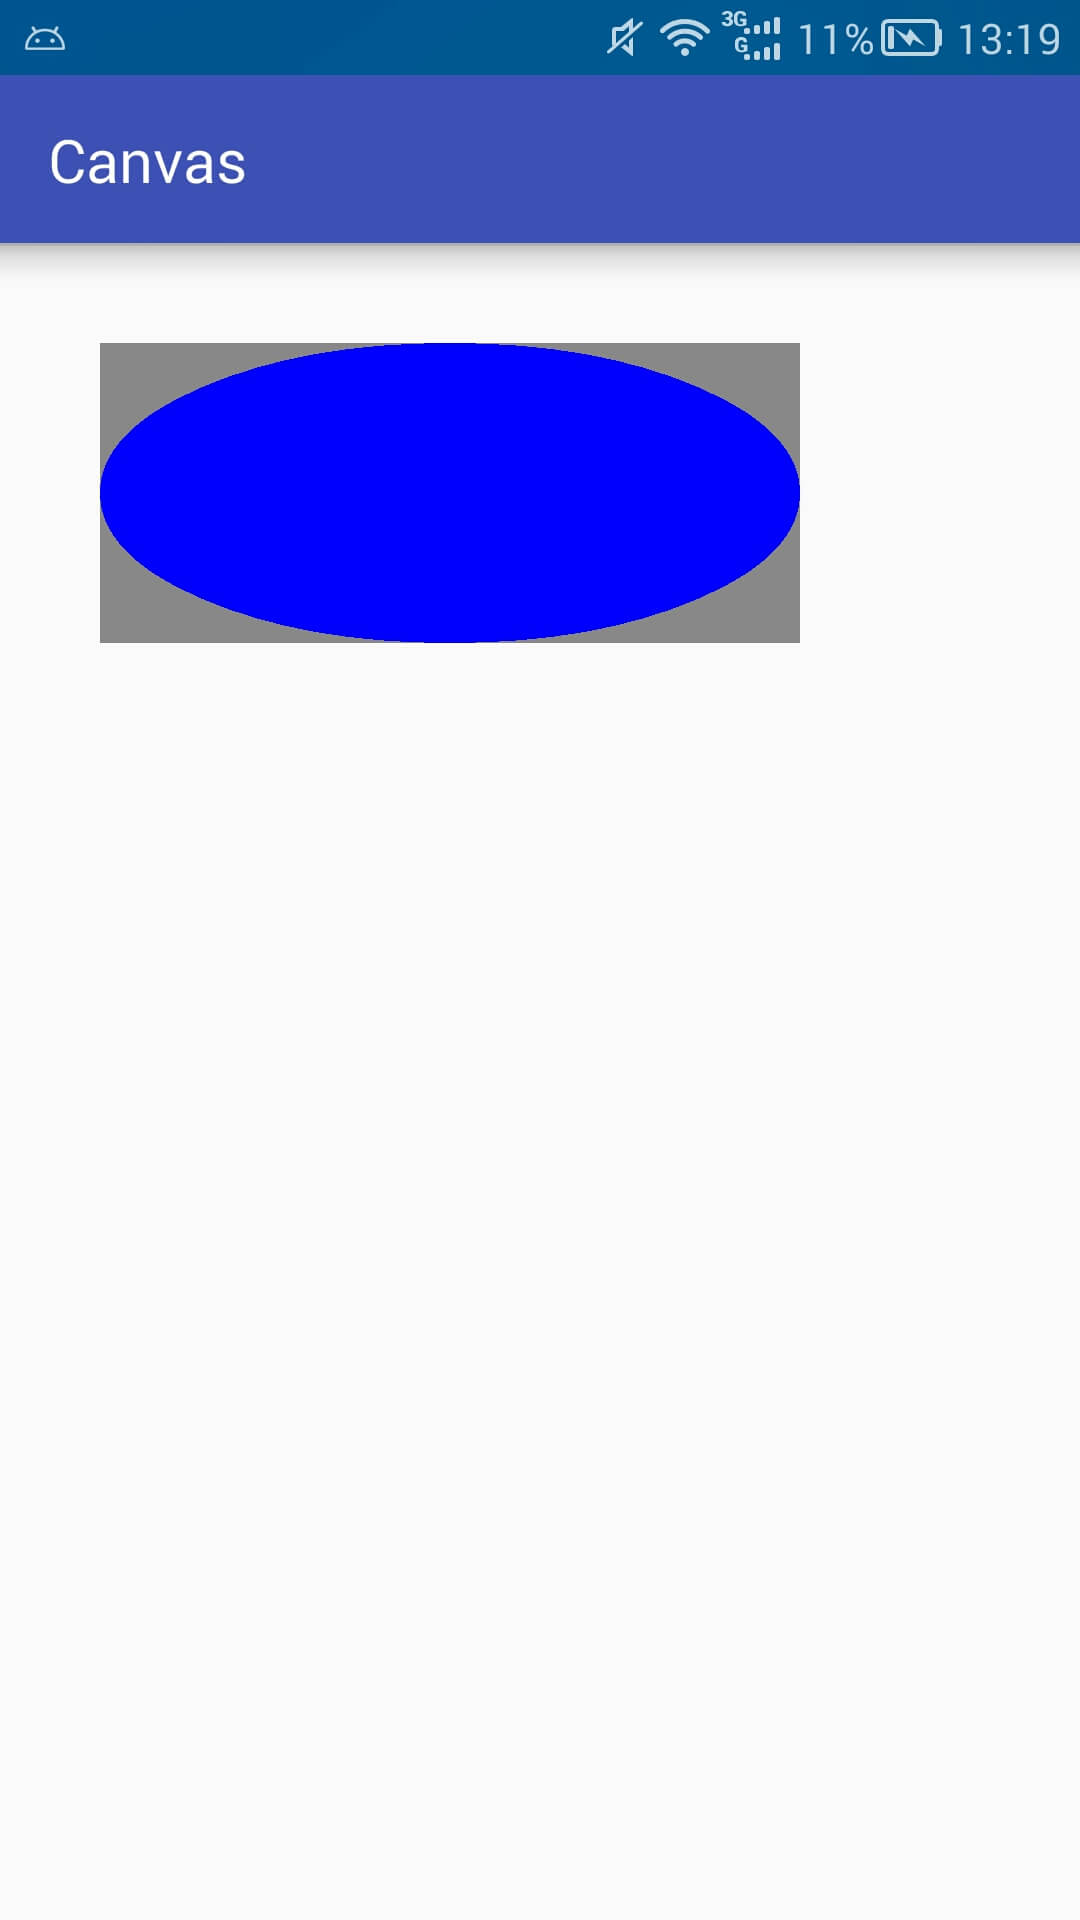
The gray part is the rectangle we selected, and the round rectangle inside becomes an ellipse. In fact, when rx is half of the width and ry is half of the height, it is just an ellipse. It can be calculated by the principle of above analysis. When rx is more than half of the width and ry is more than half of the height, it is impossible to calculate the arc. DraRoundRect is used to restrict (modify) parameters larger than this value, and all parameters larger than half are treated as half.
Draw an ellipse:
It is much simpler to draw an ellipse than to draw a rounded rectangle, because he only needs a rectangular rectangle as a parameter:
        // First kind
        RectF rectF = new RectF(100,100,800,400);
        canvas.drawOval(rectF,mPaint);

        // Second kinds
canvas.drawOval(100,100,800,400,mPaint);- 1
- 2
- 3
- 4
- 5
- 6
Similarly, the effect of the above two methods is exactly the same, but the first method is generally used. 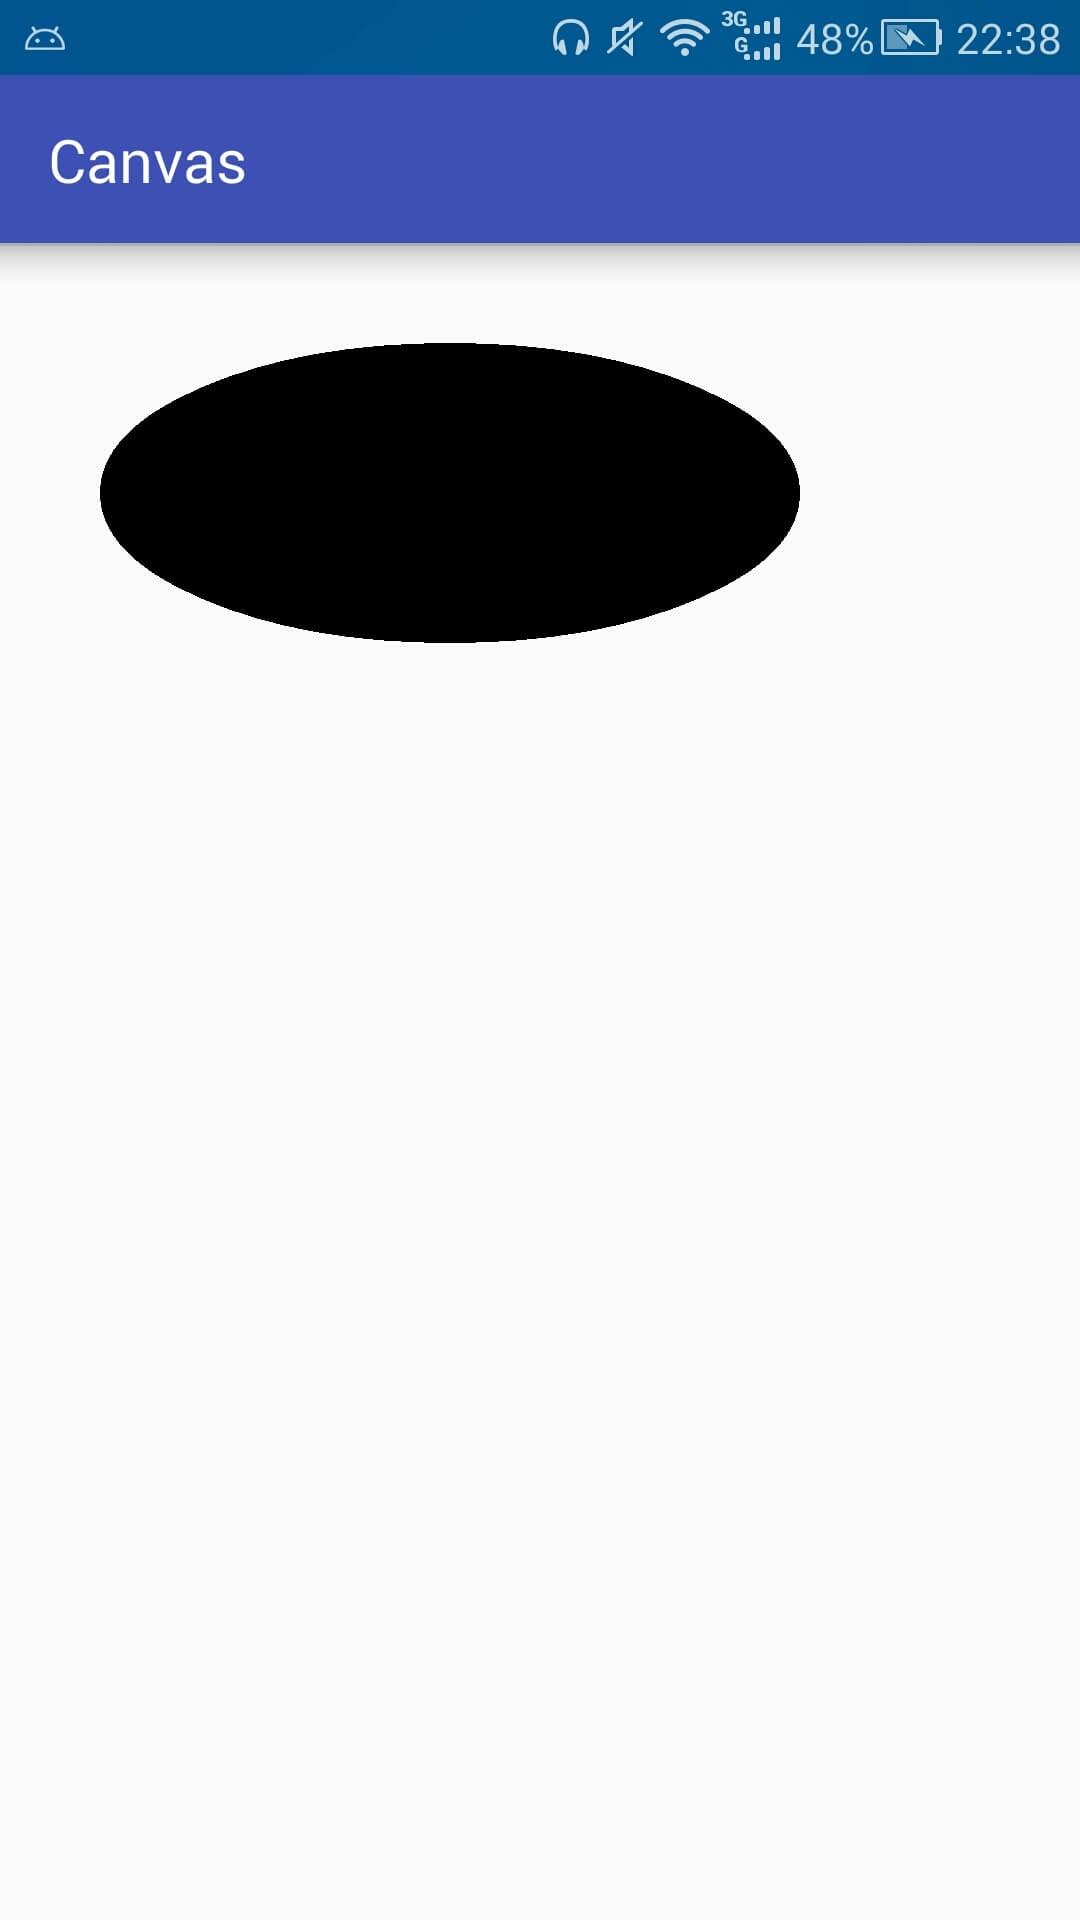
Drawing an ellipse is actually drawing an inner tangent of a rectangle. The principle is as follows, let alone say: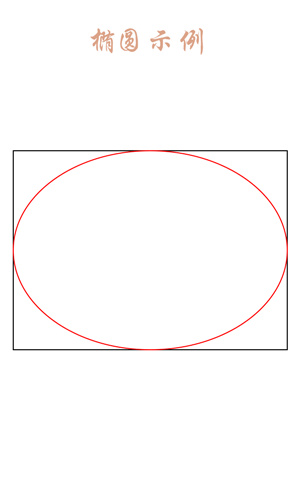
PS: If you pass in a rectangle of equal length and width (that is, a square), then the drawing is actually a circle.
Draw circles:
Drawing a circle is also relatively simple, as follows:
canvas.drawCircle(500,500,400,mPaint); // Draw a circle with a center coordinate at (500,500) and a radius of 400.
- 1
Drawing a circle has four parameters, the first two are the coordinates of the center of the circle, the third is the radius, and the last is the brush. 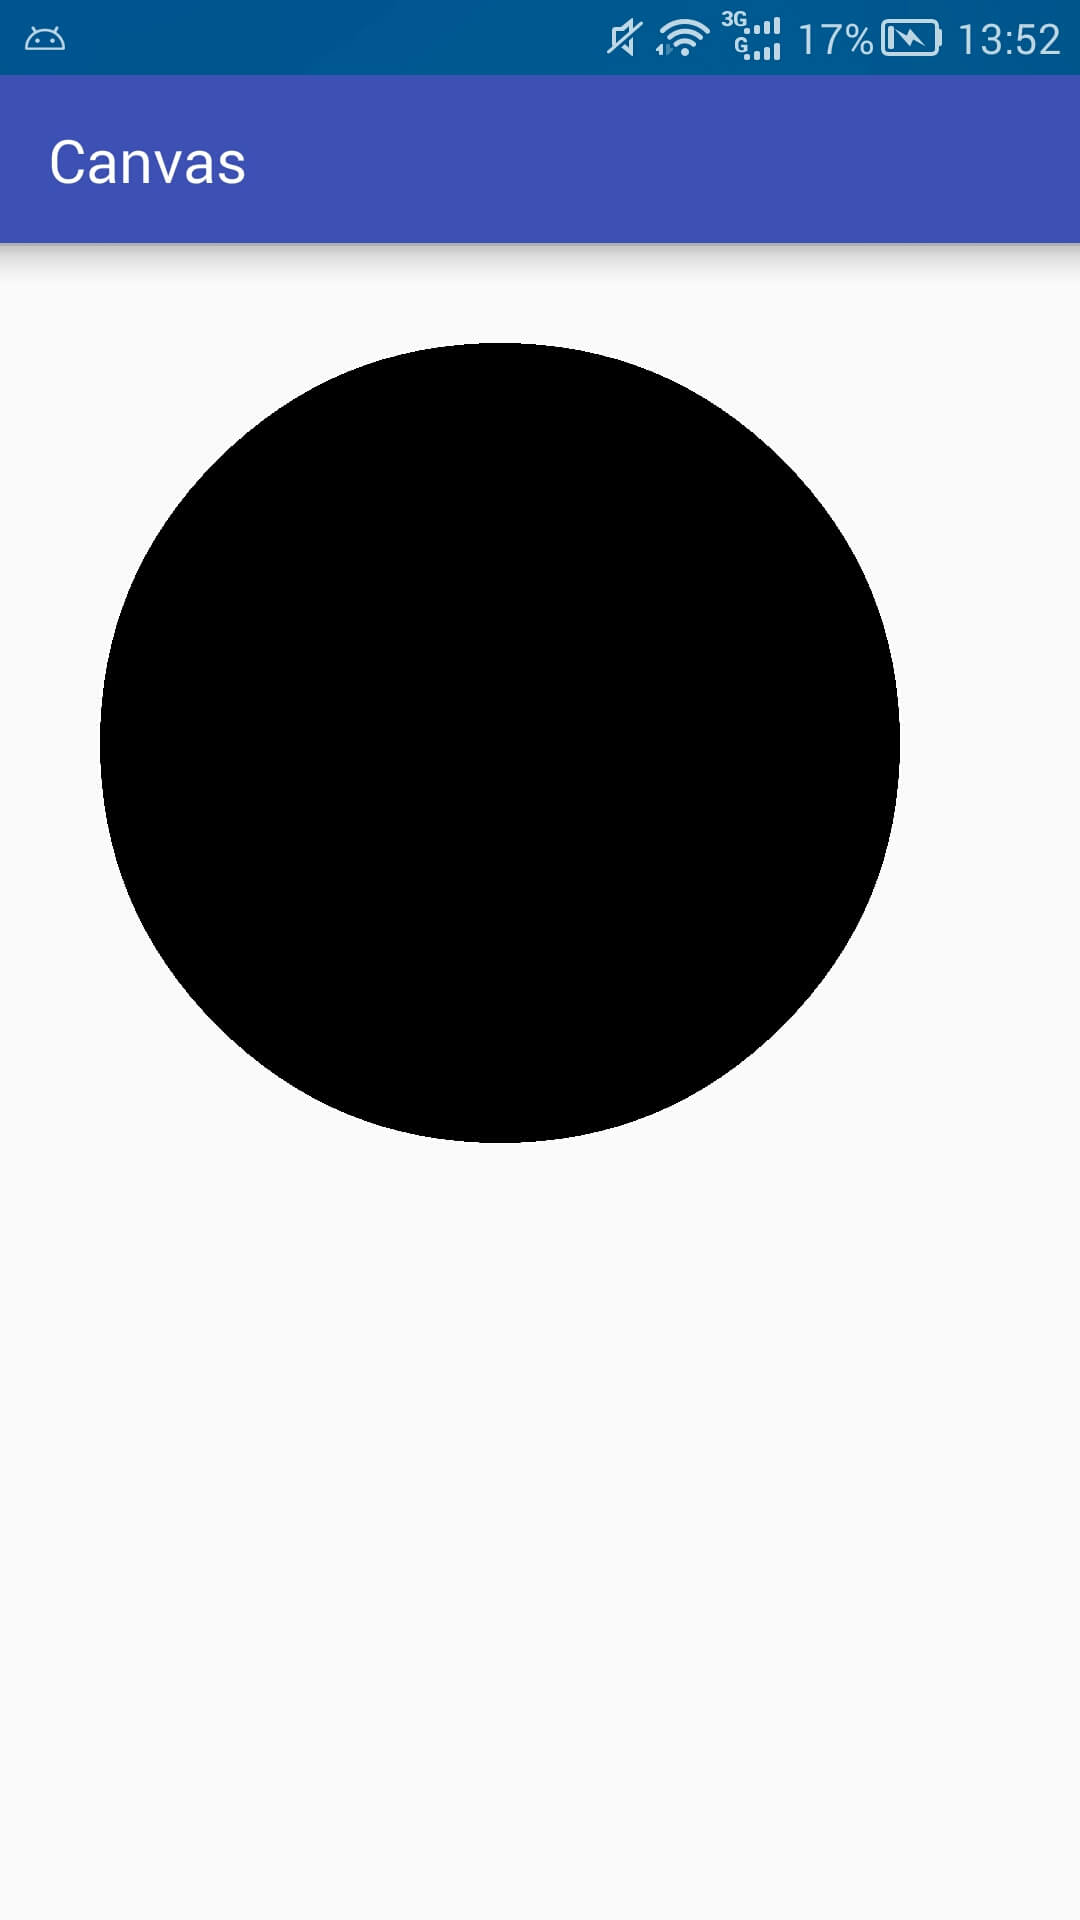
Draw an arc:
Drawing an arc is a bit magical. In order to understand this magical thing, let's first look at the parameters it needs:
// First kind
public void drawArc(@NonNull RectF oval, float startAngle, float sweepAngle, boolean useCenter, @NonNull Paint paint){}

// Second kinds
public void drawArc(float left, float top, float right, float bottom, float startAngle,
float sweepAngle, boolean useCenter, @NonNull Paint paint) {}- 1
- 2
- 3
- 4
- 5
- 6
As can be seen from the above, there are three more parameters for drawing an arc than for drawing an ellipse.
startAngle  // Starting angle
sweepAngle  // Sweep angle
useCenter   // Whether to use the center or not
- 1
- 2
- 3
- 4
Literally, we can almost guess the function of the first two parameters (start Angle, sweep Angel) is to determine the starting position and sweep angle of the angle, but what is the third parameter? Just try it out. Code it:
       RectF rectF = new RectF(100,100,800,400);
        // Draw Background Rectangle
        mPaint.setColor(Color.GRAY);
        canvas.drawRect(rectF,mPaint);

        // Arc
        mPaint.setColor(Color.BLUE);
        canvas.drawArc(rectF,0,90,false,mPaint);

        //-------------------------------------

        RectF rectF2 = new RectF(100,600,800,900);
        // Draw Background Rectangle
        mPaint.setColor(Color.GRAY);
        canvas.drawRect(rectF2,mPaint);

        // Arc
        mPaint.setColor(Color.BLUE);
canvas.drawArc(rectF2,0,90,true,mPaint);- 1
- 2
- 3
- 4
- 5
- 6
- 7
- 8
- 9
- 10
- 11
- 12
- 13
- 14
- 15
- 16
- 17
- 18
- 19
The above code actually draws an arc with a starting angle of 0 degrees and a sweep of 90 degrees. The difference between the two is whether the center point is used or not. The results are as follows: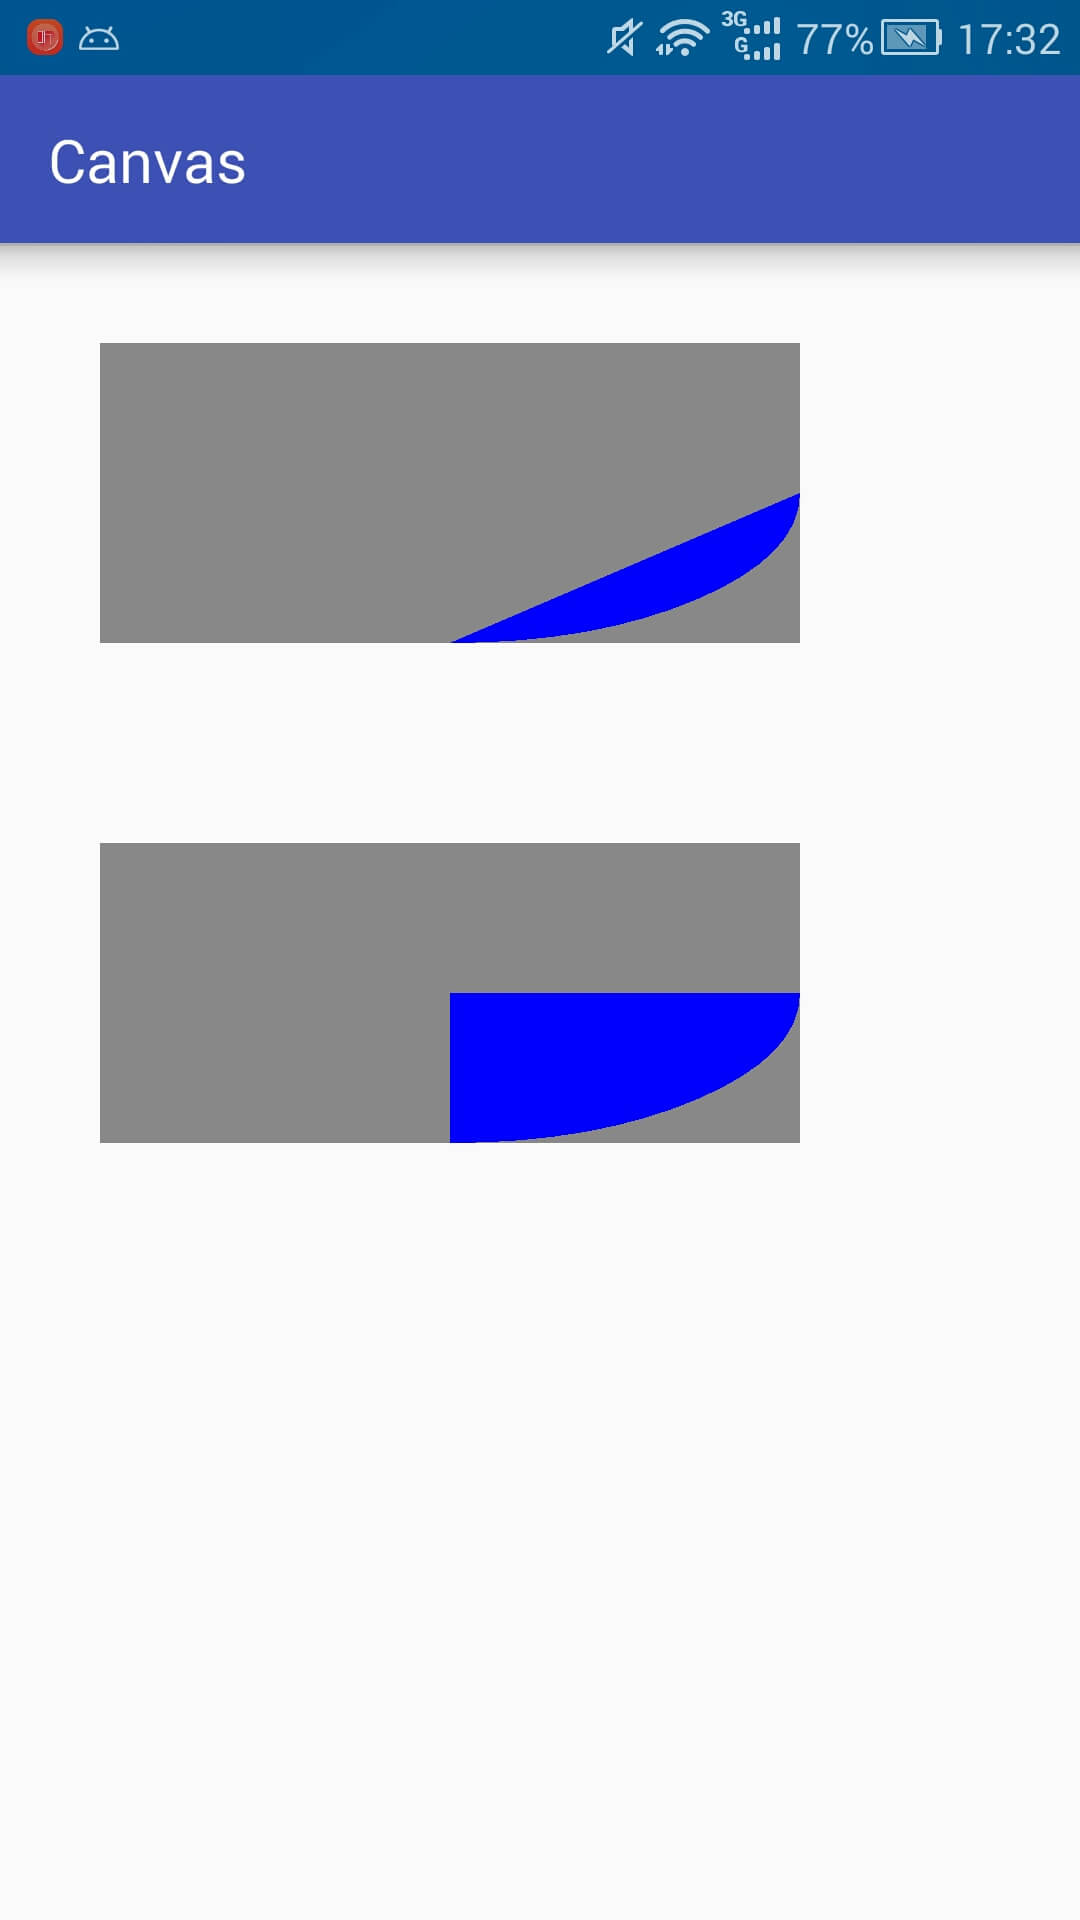
It can be found that when the central point is used, the drawing is similar to a sector, but when the central point is not used, the line between the starting point and the ending point of the arc and the figure surrounded by the arc are added. In this way, the function of the central point parameter is obvious. It is not necessary to say that you will understand it after a try. In addition, you can refer to this article about the angle: Android Custom View(2)_ Angle and Radius
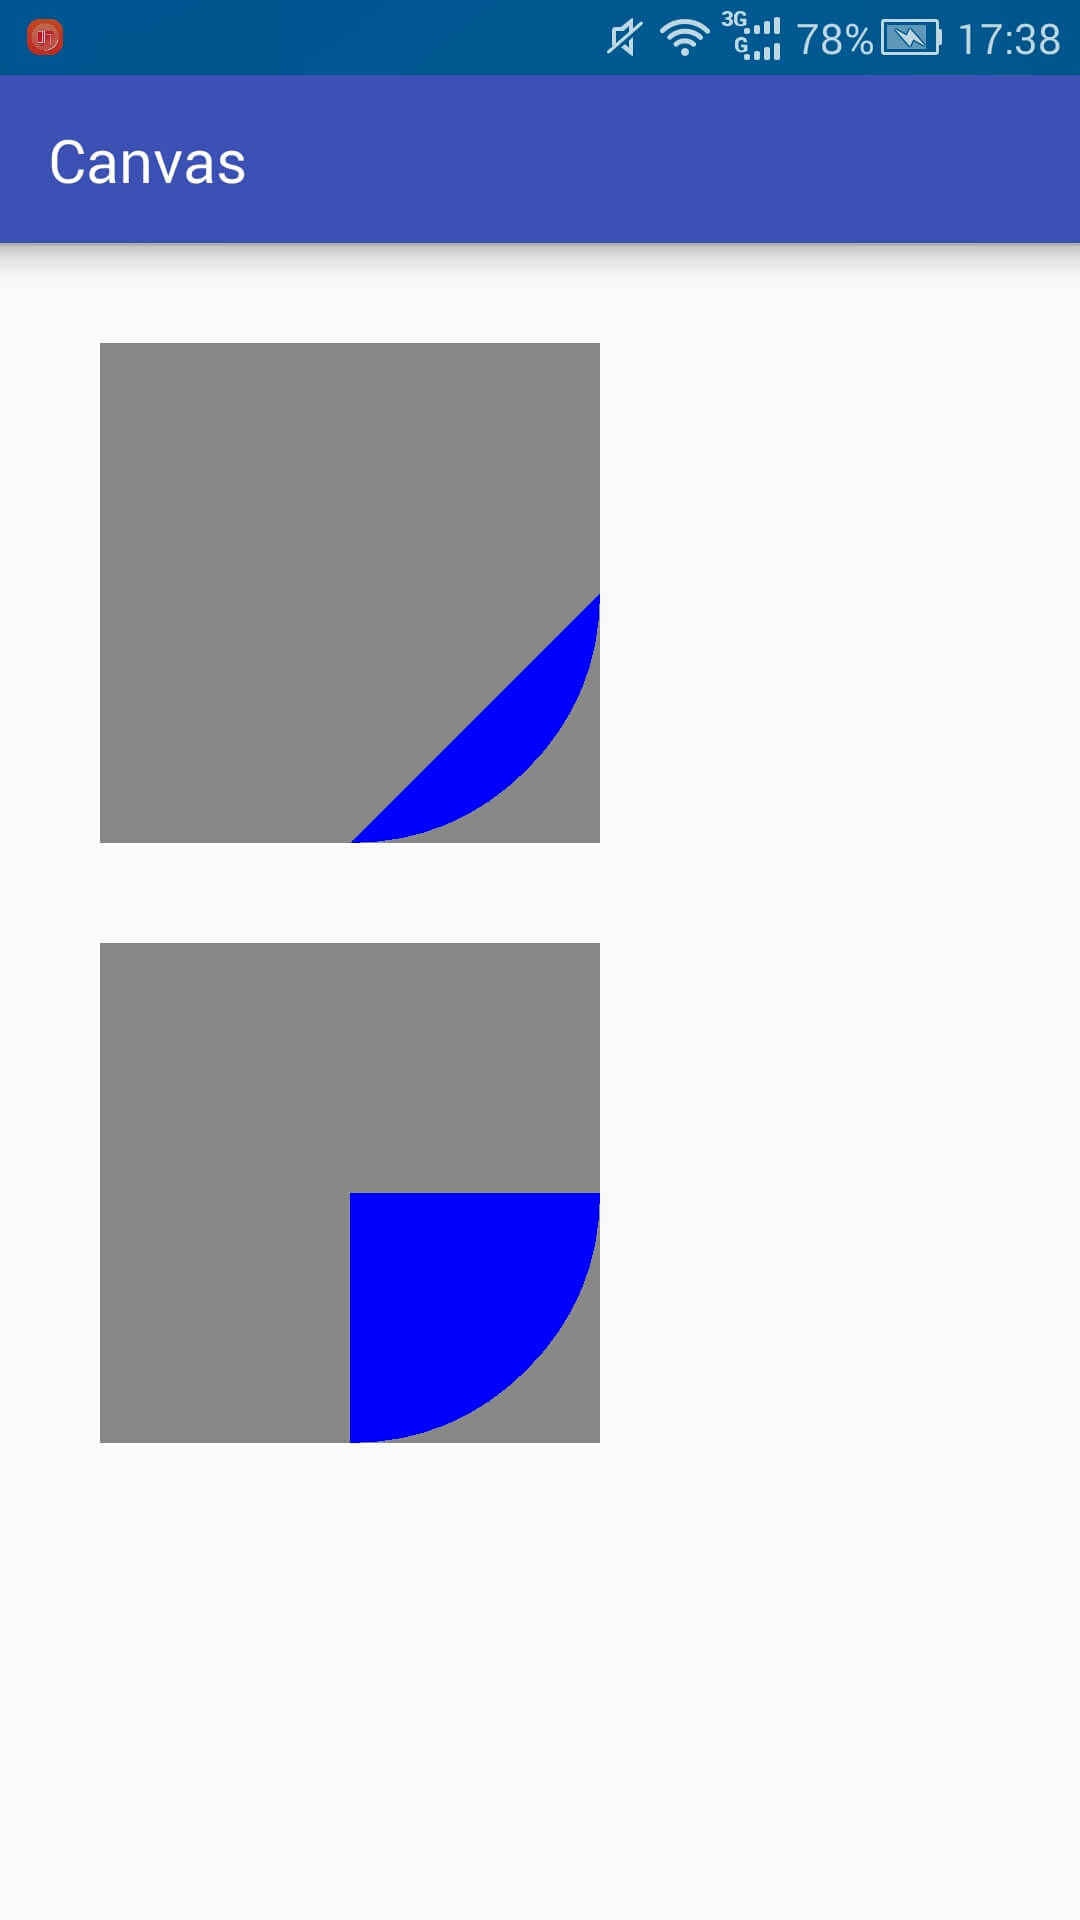
Compared with ellipses, we still use more positive circles. We use positive circles to show the effect.
        RectF rectF = new RectF(100,100,600,600);
        // Draw Background Rectangle
        mPaint.setColor(Color.GRAY);
        canvas.drawRect(rectF,mPaint);

        // Arc
        mPaint.setColor(Color.BLUE);
        canvas.drawArc(rectF,0,90,false,mPaint);

        //-------------------------------------

        RectF rectF2 = new RectF(100,700,600,1200);
        // Draw Background Rectangle
        mPaint.setColor(Color.GRAY);
        canvas.drawRect(rectF2,mPaint);

        // Arc
        mPaint.setColor(Color.BLUE);
canvas.drawArc(rectF2,0,90,true,mPaint);- 1
- 2
- 3
- 4
- 5
- 6
- 7
- 8
- 9
- 10
- 11
- 12
- 13
- 14
- 15
- 16
- 17
- 18
- 19
Brief introduction to Paint
Looking at the above so many, I believe that some people will have a question, if I want to draw a circle, as long as the edge does not have the color inside?
Simply, the basic shape of the drawing is determined by Canvas, but the color of the drawing is determined by Paint.
If you notice, at the beginning we set the brush style like this:
mPaint.setStyle(Paint.Style.FILL); //Set Brush Mode to Fill
- 1
In order to display conveniently and see the effect easily, the previous mode has always been filling mode. In fact, the brush has three modes, as follows:
STROKE                //Stroke
FILL                  //Fill
FILL_AND_STROKE       //Drawing edge and filling
- 1
- 2
- 3
In order to distinguish the three effects, we do the following experiments:
        Paint paint = new Paint();
        paint.setColor(Color.BLUE);
        paint.setStrokeWidth(40);     //In order to achieve obvious experimental results, the width of the stroke edge is specially set up to be very large.

        // Stroke
        paint.setStyle(Paint.Style.STROKE);
        canvas.drawCircle(200,200,100,paint);

        // Fill
        paint.setStyle(Paint.Style.FILL);
        canvas.drawCircle(200,500,100,paint);

        // Drawing edge and filling
        paint.setStyle(Paint.Style.FILL_AND_STROKE);
canvas.drawCircle(200, 800, 100, paint);- 1
- 2
- 3
- 4
- 5
- 6
- 7
- 8
- 9
- 10
- 11
- 12
- 13
- 14
- 15
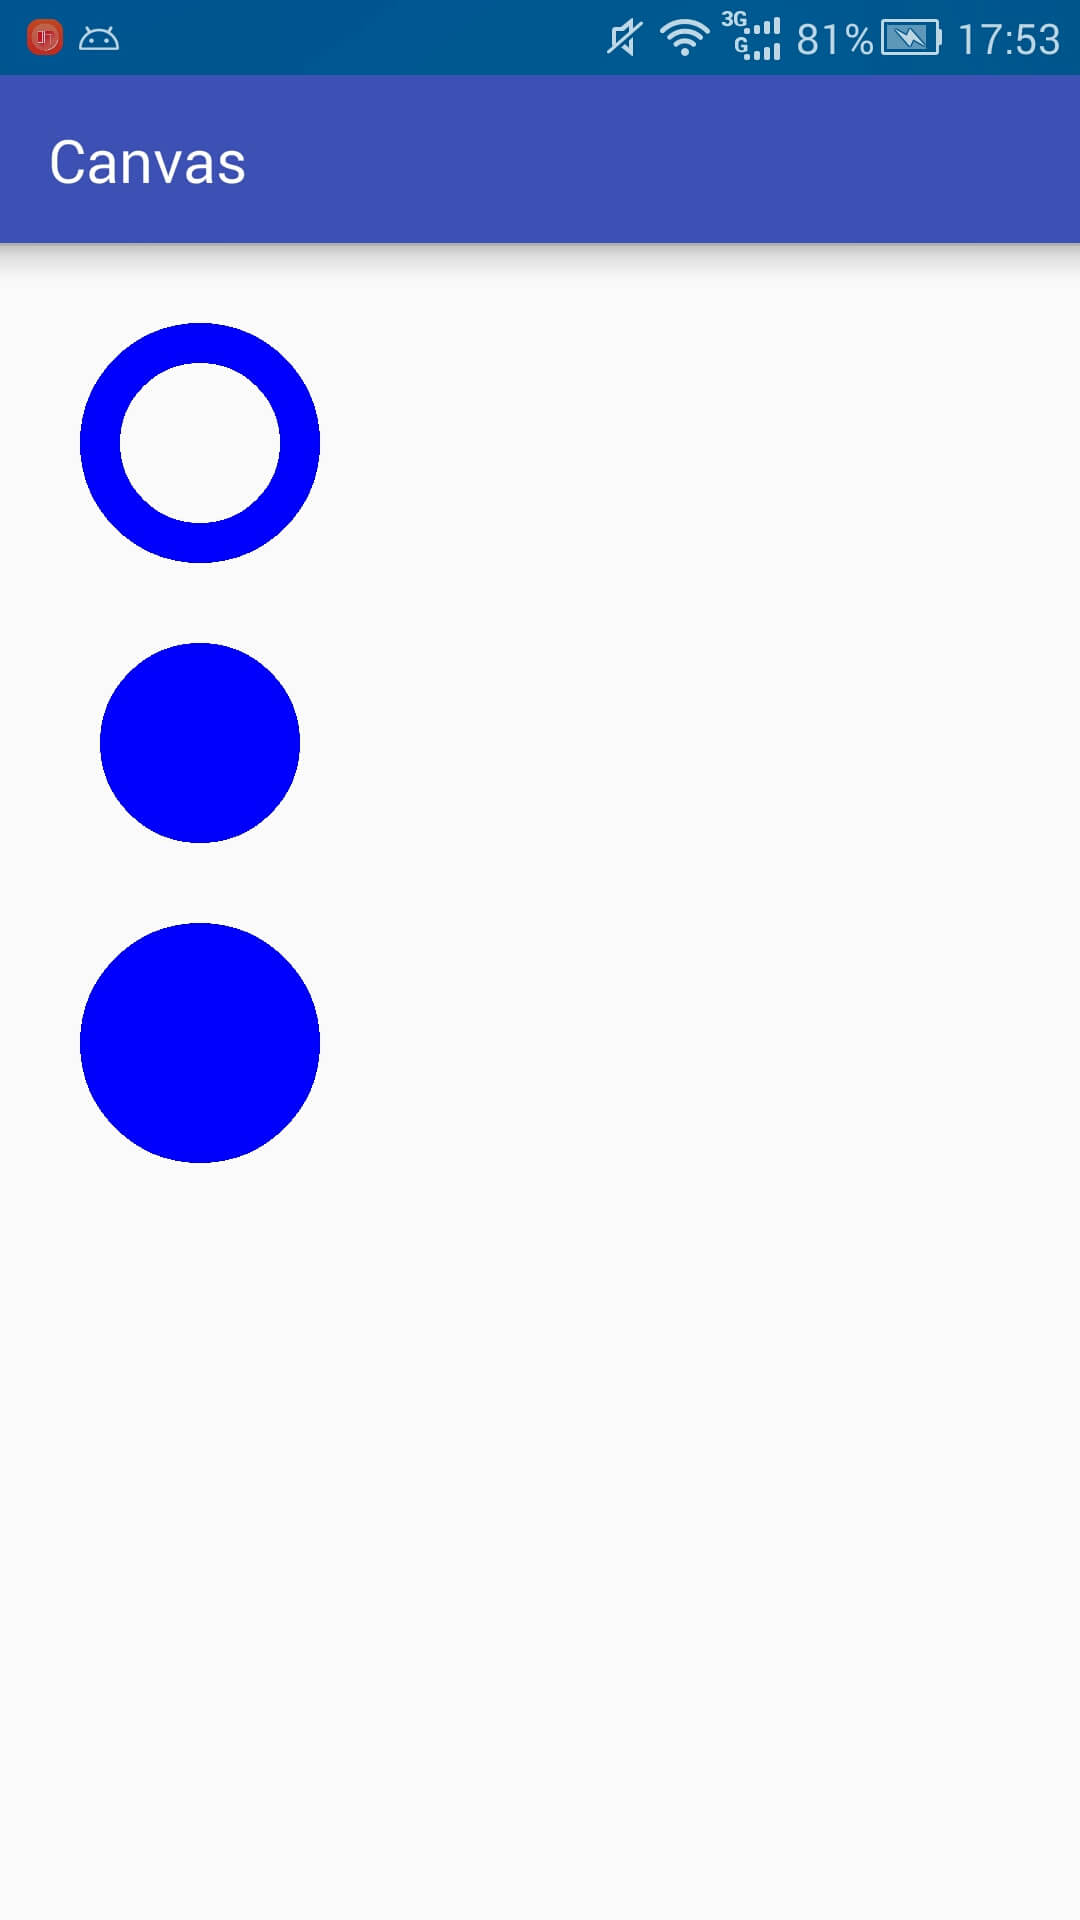
One picture is worth thousands of words. Through the above experiments, we can see the difference between the three modes more clearly. If only the edge does not need filling content, we only need to set the mode to STROKE.
In fact, there are many things about Paint. These are just the tip of the iceberg. Paint will be explained in detail in the following content.
Small example
Briefly introduce the operation of canvas:
Canvas operation details will be explained in the next article, not the focus of this article, but may be used in the following examples, so here is a brief introduction.
| Related operations | Brief introduction |
|---|---|
| save | Save the current canvas status |
| restore | Roll back to the last saved state |
| translate | Displacement relative to current position |
| rotate | rotate |
Make a pie chart
Pie charts are often used when displaying percentage data, such as: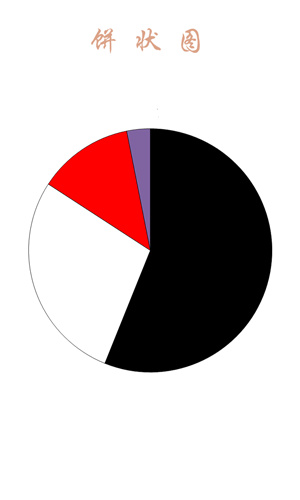
Simple analysis
In fact, according to our knowledge above, we can already make a pie chart by ourselves. But the most important thing in making things is not the result, but the idea of making things. Believe that I pasted the code, you immediately understand, very simple things. However, we still want to know about the production ideas:
First, the composition of the pie chart is analyzed. It is very obvious that the pie chart is composed of one sector after another. Each sector has different colors, corresponding to the name, data and percentage.
From the above information, it can be concluded that the basic data of pie chart should include: the angle color corresponding to the percentage of name data value.
Data that users care about: Percentage of Name Data Value
Data requiring program calculation: the angle of percentage
Among them, the item of color can be specified either by user or by program (we use program to specify here).
Encapsulated data:
public class PieData {
    // Users care about data
    private String name;        // Name
    private float value;        // numerical value
    private float percentage;   // Percentage

    // Non-users care about data
    private i`Write code slices here.`nt color = 0;      // colour
    private float angle = 0;    // angle

    public PieData(@NonNull String name, @NonNull float value) {
        this.name = name;
        this.value = value;
    }
}- 1
- 2
- 3
- 4
- 5
- 6
- 7
- 8
- 9
- 10
- 11
- 12
- 13
- 14
- 15
PS: The get set method is omitted above.
Custom View:
Following the custom View process, sort it out (determine what each step should do):
| step | Keyword | Effect |
|---|---|---|
| 1 | Constructor | Initialization (Initialization Brush Paint) |
| 2 | onMeasure | Measure the size of the View (not to be concerned for the time being) |
| 3 | onSizeChanged | Determine the View size (record the width of the current View) |
| 4 | onLayout | Determine the child View layout (no child View, no concern) |
| 5 | onDraw | Actual drawing content (pie chart) |
| 6 | Provide interface | Provide interfaces (provide interfaces for setting data) |
The code is as follows:
public class PieView extends View {
    // Color table (Note: The color defined here uses ARGB with Alpha channel)
    private int[] mColors = {0xFFCCFF00, 0xFF6495ED, 0xFFE32636, 0xFF800000, 0xFF808000, 0xFFFF8C69, 0xFF808080,
            0xFFE6B800, 0xFF7CFC00};
    // Initial drawing angle of pie chart
    private float mStartAngle = 0;
    // data
    private ArrayList<PieData> mData;
    // Width height
    private int mWidth, mHeight;
    // Paint brush
    private Paint mPaint = new Paint();

    public PieView(Context context) {
        this(context, null);
    }

    public PieView(Context context, AttributeSet attrs) {
        super(context, attrs);
        mPaint.setStyle(Paint.Style.FILL);
        mPaint.setAntiAlias(true);
    }

    @Override
    protected void onSizeChanged(int w, int h, int oldw, int oldh) {
        super.onSizeChanged(w, h, oldw, oldh);
        mWidth = w;
        mHeight = h;
    }

    @Override
    protected void onDraw(Canvas canvas) {
        super.onDraw(canvas);
        if (null == mData)
            return;
        float currentStartAngle = mStartAngle;                    // Current Starting Angle
        canvas.translate(mWidth / 2, mHeight / 2);                // Move the origin of the canvas coordinates to the central position
        float r = (float) (Math.min(mWidth, mHeight) / 2 * 0.8);  // Radius of pie chart
        RectF rect = new RectF(-r, -r, r, r);                     // Cake plotting area

        for (int i = 0; i < mData.size(); i++) {
            PieData pie = mData.get(i);
            mPaint.setColor(pie.getColor());
            canvas.drawArc(rect, currentStartAngle, pie.getAngle(), true, mPaint);
            currentStartAngle += pie.getAngle();
        }

    }

    // Set the starting angle
    public void setStartAngle(int mStartAngle) {
        this.mStartAngle = mStartAngle;
        invalidate();   // Refresh
    }

    // Setting data
    public void setData(ArrayList<PieData> mData) {
        this.mData = mData;
        initData(mData);
        invalidate();   // Refresh
    }

    // Initialization data
    private void initData(ArrayList<PieData> mData) {
        if (null == mData || mData.size() == 0)   // Direct return of data with problems
            return;

        float sumValue = 0;
        for (int i = 0; i < mData.size(); i++) {
            PieData pie = mData.get(i);

            sumValue += pie.getValue();       //Computational numerical sum

            int j = i % mColors.length;       //Set color
            pie.setColor(mColors[j]);
        }

        float sumAngle = 0;
        for (int i = 0; i < mData.size(); i++) {
            PieData pie = mData.get(i);

            float percentage = pie.getValue() / sumValue;   // Percentage
            float angle = percentage * 360;                 // Corresponding angles

            pie.setPercentage(percentage);                  // Percentage of records
            pie.setAngle(angle);                            // Recording Angle Size
            sumAngle += angle;

            Log.i("angle", "" + pie.getAngle());
        }
    }
}- 1
- 2
- 3
- 4
- 5
- 6
- 7
- 8
- 9
- 10
- 11
- 12
- 13
- 14
- 15
- 16
- 17
- 18
- 19
- 20
- 21
- 22
- 23
- 24
- 25
- 26
- 27
- 28
- 29
- 30
- 31
- 32
- 33
- 34
- 35
- 36
- 37
- 38
- 39
- 40
- 41
- 42
- 43
- 44
- 45
- 46
- 47
- 48
- 49
- 50
- 51
- 52
- 53
- 54
- 55
- 56
- 57
- 58
- 59
- 60
- 61
- 62
- 63
- 64
- 65
- 66
- 67
- 68
- 69
- 70
- 71
- 72
- 73
- 74
- 75
- 76
- 77
- 78
- 79
- 80
- 81
- 82
- 83
- 84
- 85
- 86
- 87
- 88
- 89
- 90
- 91
- 92
PS: The invalidate() function is called to redraw the data when it needs to redraw the interface.
Effect picture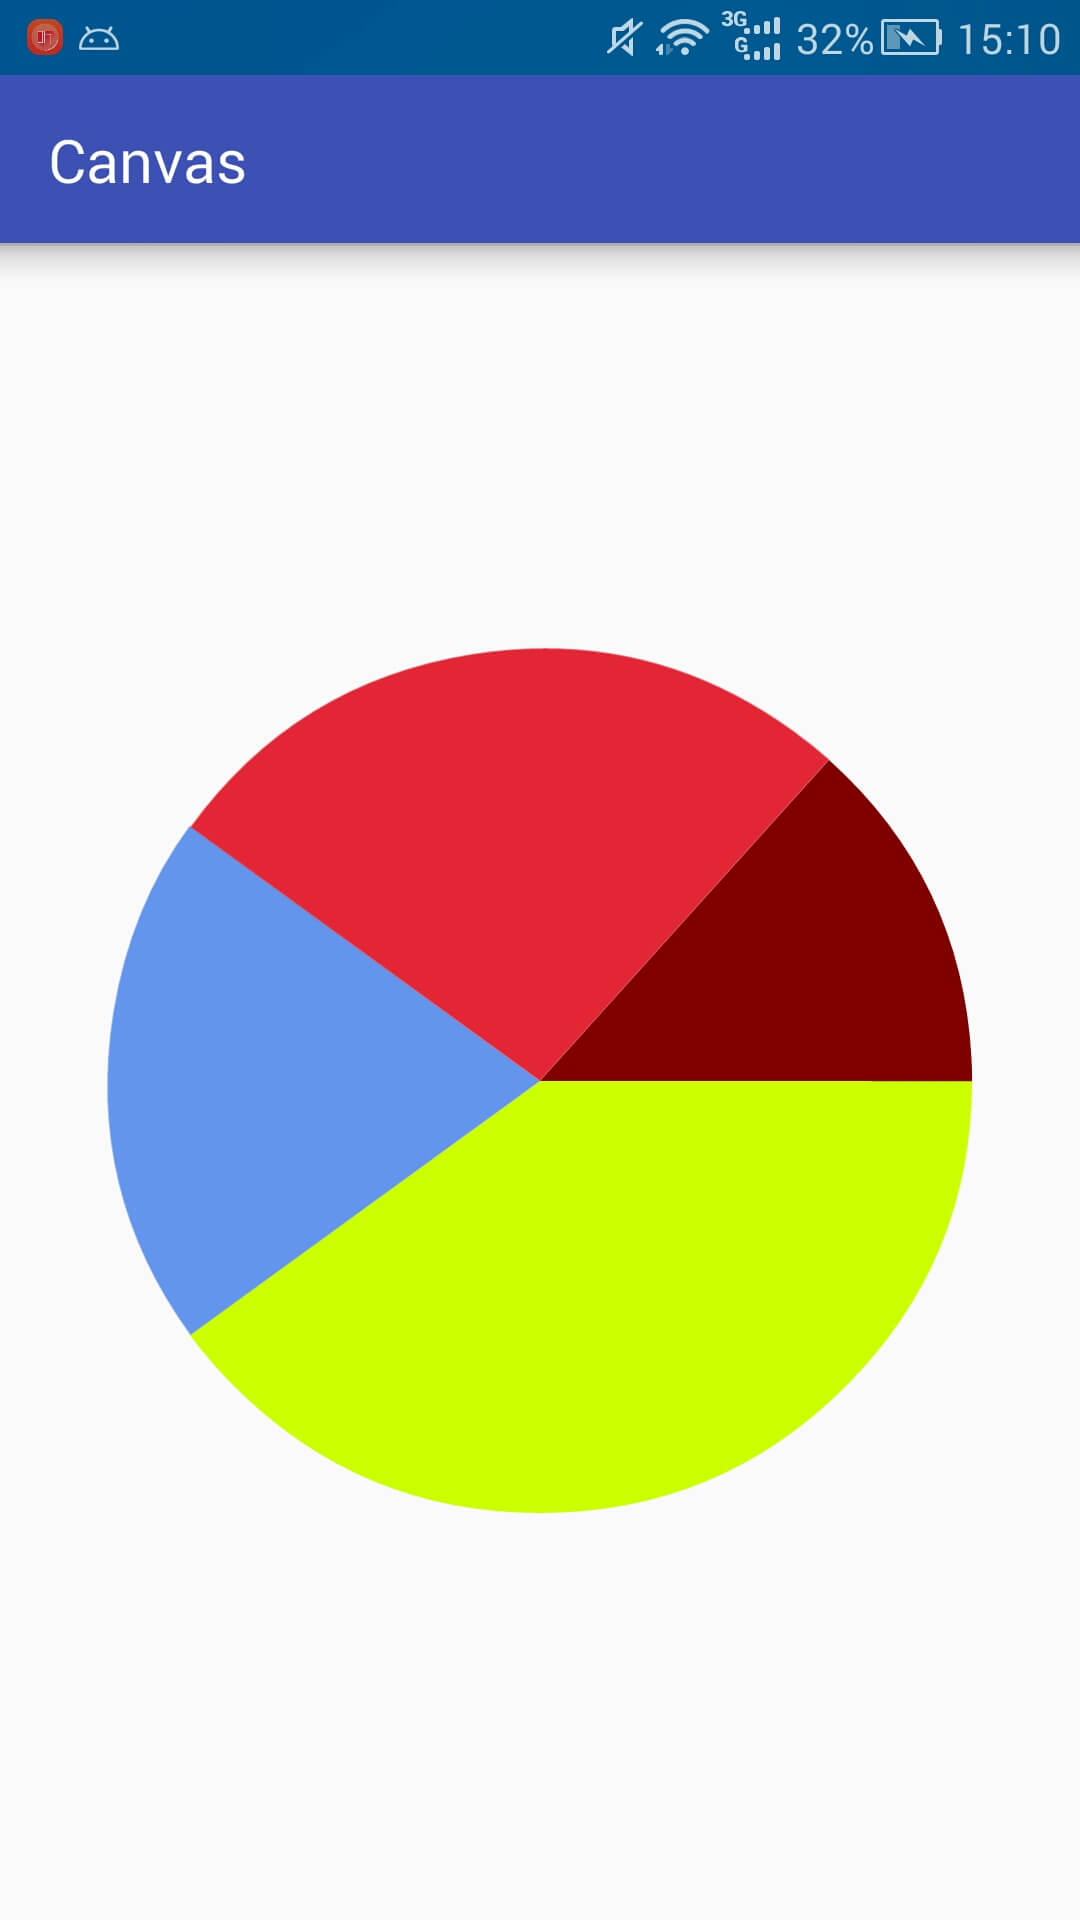
PS: This pie chart does not add data such as percentages. It is only used as an example.