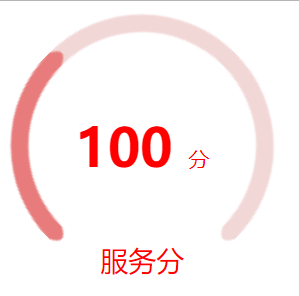
Final Effect Chart
Defining variables
Define radius, ring thickness, center position, and default fill color
let radius = 75
let thickness= 10
let innerRadius = radius - thickness
let x = 75
let y = 75
var canvas = document.getElementById('tutorial');
var ctx = canvas.getContext('2d');
ctx.fillStyle = "#f2d7d7";
2. Draw the first arc
ctx.beginPath();
ctx.arc(x, y, radius, Math.PI * 1.5, Math.PI)

Note the beginPath() method, the first step in generating a path.Essentially, a path is made up of many subpaths, all of which are in a list, and all of the subpaths (lines, arcs, and so on) form a graph.Each time this method is called, the list is emptied and reset, and then we can redraw the new graph.
That is, this method can be used to group Canvas images, draw new graphics If this method is not called, the new graphics will be connected to the previous graphics
3. Draw the first connection
ctx.quadraticCurveTo((x - innerRadius) - thickness / 2, y - thickness, x - innerRadius, y)

Outside the connection is drawn with a quadratic Bezier curve. Canvas's quadratic CurveTo (cp1x, cp1y, x, y) method accepts four parameters. The first and second parameters are the control points, and the third and fourth parameters are the end points. Official Documents
A circular arc can be drawn simply by calculating the control point and the end point
4. Draw the second arc
ctx.arc(x, y, innerRadius, Math.PI, Math.PI * 1.5, true)

Note that the last parameter after the method, set to true, represents counterclockwise drawing (default is clockwise)
5. Draw the second connection
ctx.quadraticCurveTo(y - thickness, (x - innerRadius) - thickness / 2, x, y - innerRadius - thickness)

This step is actually not much different from the third step, simply changing the position of the lower parameter
6. Filling
ctx.fill();

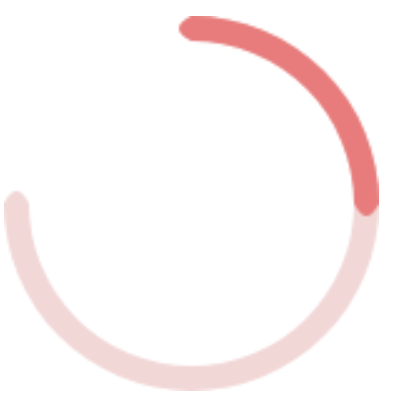
A simple unclosed ring is now complete
Draw the second progress bar ring
7. Initialization
ctx.beginPath();
ctx.fillStyle = "#e87c7c";
beginPath means to draw a new graphic. If this method is not called, the later drawing will be linked to the previous drawing
8. Draw the second progress bar ring
ctx.beginPath();
ctx.fillStyle = "#e87c7c";
ctx.arc(x, y, radius, Math.PI * 1.5, Math.PI * 2)
ctx.quadraticCurveTo((x + innerRadius) + thickness / 2, y + thickness, x + innerRadius, y)
ctx.arc(x, y, innerRadius, Math.PI * 2, Math.PI * 1.5, true)
ctx.quadraticCurveTo(y - thickness, (x - innerRadius) - thickness / 2, x, y - innerRadius - thickness)

ctx.fill();
Since it is drawn the same way as the first ring, it is no longer repeated, only the radian of the circle is the difference
9. Rotating Canvas
transform: rotate(-135deg);

Because the rotation of css is convenient and angle calculation is omitted, I use the transform ation of css to rotate.Of course Canvas also provides a way to rotate
Complete Code
<!DOCTYPE html>
<html lang="cn">

<head>
    <meta charset="UTF-8">
    <meta name="viewport" content="width=device-width, initial-scale=1.0">
    <meta http-equiv="X-UA-Compatible" content="ie=edge">
    <title>canvas</title>
    <style>
        .ring {
            width: 150px;
            height: 150px;
            display: flex;
            align-items: center;
            justify-content: center;
            flex-direction: column;
            position: relative;
        }

        #tutorial {
            transform: rotate(-135deg);
            width: 150px;
            height: 150px;
        }

        .fraction {
            position: absolute;
            font-size: 30px;
            font-weight: bold;
            color: red;
        }

        .small {
            font-size: 12px;
            font-weight: lighter;
        }

        .title {
            color: red;
            bottom: 0;
            position: absolute;
        }
    </style>
</head>

<body>
    <div class="ring">
        <canvas id="tutorial" width="150" height="150"></canvas>
        <span class="fraction">100 <span class="small">branch</span> </span>
        <span class="title">Service points</span>
    </div>

    <script>
        let radius = 75
        let thickness = 10
        let innerRadius = radius - thickness
        let x = 75
        let y = 75
        var canvas = document.getElementById('tutorial');
        var ctx = canvas.getContext('2d');
        ctx.fillStyle = "#f2d7d7";

        ctx.beginPath();
        ctx.arc(x, y, radius, Math.PI * 1.5, Math.PI)
        ctx.quadraticCurveTo((x - innerRadius) - thickness/2 , y - thickness, x - innerRadius, y)
        ctx.arc(x, y, innerRadius, Math.PI, Math.PI * 1.5, true)
        ctx.quadraticCurveTo(y - thickness, (x - innerRadius) - thickness / 2, x, y - innerRadius - thickness)
        ctx.fill();

        ctx.beginPath();
        ctx.fillStyle = "#e87c7c";
        ctx.arc(x, y, radius, Math.PI * 1.5, Math.PI * 2)
        ctx.quadraticCurveTo((x + innerRadius) + thickness / 2, y + thickness, x + innerRadius, y)
        ctx.arc(x, y, innerRadius, Math.PI * 2, Math.PI * 1.5, true)
        ctx.quadraticCurveTo(y - thickness, (x - innerRadius) - thickness / 2, x, y - innerRadius - thickness)
        ctx.fill();
    </script>
</body>

</html>