with the development of business, system splitting leads to more complex system call link. A front-end request may need to call many back-end services in the end to complete. When the whole request becomes slow or unavailable, we cannot know that the request is caused by one or some back-end services. At this time, we need to solve how to quickly read and locate the service failure point to suit the case. Thus, the birth of distributed system call tracing.
<Dapper, a Large-Scale Distributed Systems Tracing Infrastructure> , the most widely used open source implementation is Zipkin of Twitter. In order to realize platform independent and vendor independent distributed service tracking, CNCF has released the open tracking standard for distributed service tracking. In China, Alibaba's tracking "eagle eye", JD's "Hydra", popular comment's "CAT", Sina's "Watchman" and vipshop's "Microscope" are all such systems.
Spring Cloud Sleuth also provides us with a complete set of solutions. In this chapter, we will explain in detail how to use Spring Cloud Sleuth + Zipkin to increase the ability of distributed service tracing for our microservice architecture.
Spring Cloud Sleuth
Generally, a distributed service tracking system consists of three parts:
- data collection
- data storage
- Data display
According to the size of the system, the structure of each part changes. For example, for large-scale distributed systems, data storage can be divided into two parts: real-time data and full data. Real time data is used for troubleshooting and full data is used for system optimization. In addition to supporting platform independent and development language independent system data collection, data collection also includes asynchronous data collection (need to track the messages in the queue to ensure the called Consistency) and ensuring less intrusiveness; data presentation involves data mining and analysis. While each part can be complex, the fundamentals are similar.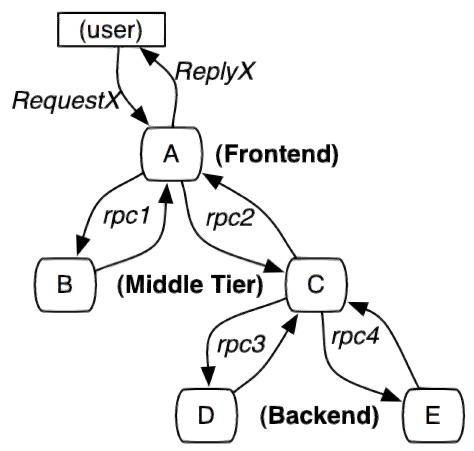
The tracking unit of service tracking is a process from the time when a customer initiates a request to the boundary of the tracked system, to the time when the tracked system returns a response to the customer, which is called a trace. Several services will be called in each trace. In order to record which services are called and the consumption time of each call, a call record, called a span, is embedded in each call to the service. In this way, several ordered spans form a trace. In the process of the system providing services to the outside world, there will be continuous requests and responses, and tracks will also be generated. If these tracks with span are recorded, a service topology of the system can be depicted. With the information of response time in span and whether the request is successful or not, you can find the abnormal service when the problem occurs; according to the historical data, you can also analyze where the performance is poor from the overall level of the system and locate the goal of performance optimization.
Spring Cloud Sleuth provides link tracking for calls between services. Through Sleuth, you can clearly understand which services a service request has gone through and how much each service processing cost. So that we can easily clarify the call relationship between the microservices. In addition, Sleuth can help us:
- Time consumption analysis: through Sleuth, you can easily understand the time consumption of each sampling request, so as to analyze which service calls are more time-consuming;
- Visualization error: for the exception that is not caught by the program, you can see it on the integrated Zipkin service interface;
- Link optimization: for services with frequent calls, some optimization measures can be implemented for these services.
Spring Cloud Sleuth can send information to Zipkin in combination with Zipkin, use Zipkin's storage to store information, and use Zipkin UI to display data.
This is the conceptual diagram of Spring Cloud Sleuth: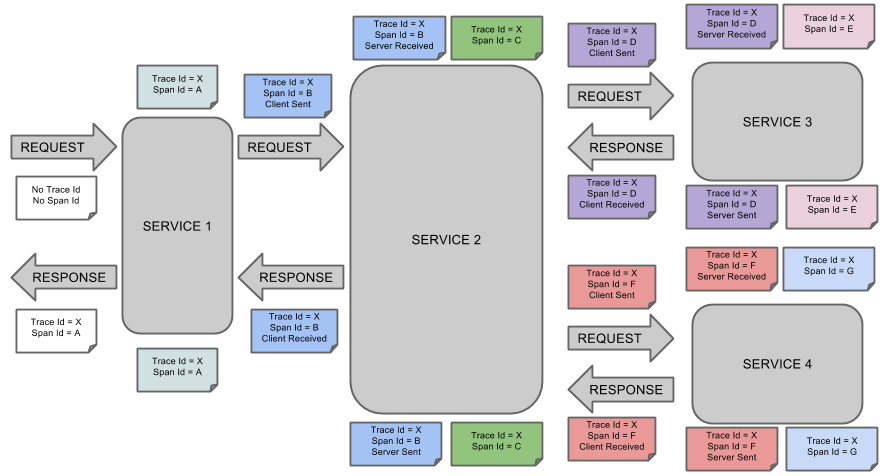
zipkin
The principle of zipkin is based on the paper of Dapper, Google's internal distributed tracking system, published in 2010( PDF address,Address of translation )According to this paper, Twitter also developed its own distributed tracking system Zipkin and opened it to the public. It is dedicated to collecting service timing data to solve the delay problem in microservice architecture, including data collection, storage, search and presentation.
we can use it to collect the tracking data of the request link on each server, and assist us to query the tracking data through the REST API interface provided by it to realize the monitoring program of the distributed system, so as to discover the problem of delay rise in the system in time and find out the source of the system performance bottleneck. In addition to the development oriented API interface, it also provides convenient UI components to help us intuitively search tracking information and analyze request link details, such as: query the processing time of each user's request in a certain period of time.
Zipkin provides pluggable data storage: in memory, MySql, Cassandra, and elastic search. In the next test, elastic search is recommended for production in order to directly store in memory.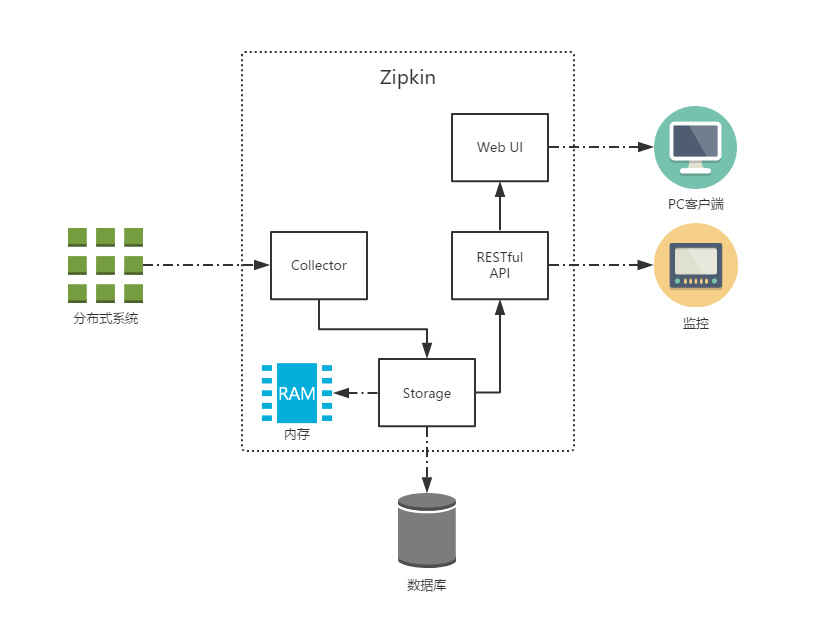
The figure above shows Zipkin's infrastructure, which consists of four core components:
- Collector: collector component, which is mainly used to process the tracking information sent from the external system, and convert the information into Span format of Zipkin internal processing to support the subsequent storage, analysis, display and other functions.
- Storage: storage component, which mainly processes the tracking information received by the collector. By default, these information will be stored in memory. We can also modify this storage policy to store the tracking information in the database by using other storage components.
- RESTful API: API component, which is mainly used to provide external access interface. For example, display tracking information to clients, or access external systems to achieve monitoring.
- Web UI: UI component, the upper application based on API component. Users can query and analyze tracking information conveniently and intuitively through UI components.
The difference between zipkin and ELK
ELK provides log management, including collection, storage, search and other functions, but it lacks real-time service link tracking. zipkin just fixed the flaw.
Quick start
Zipkin is divided into two ends, one is Zipkin server, the other is Zipkin client, which is the application of microservice.
The client will configure the URL address of the server. Once a call occurs between services, it will be monitored by Sleuth's listener configured in the microservice, and the corresponding Trace and Span information will be generated and sent to the server.
There are two main ways to send:
- HTTP message mode
- Message bus mode, such as RabbitMQ
Either way, we need:
- An Eureka service registry. Here we use the previous Eureka project as the registry.
- A Zipkin server.
- Two microservice applications, trace-a and trace-b, in which trace-a has a REST interface / trace-a, which will trigger the call to trace-b application.
Zipkin server
As for Zipkin's server, after using Spring Boot 2.x, the official does not recommend custom compilation. Instead, it directly provides compiled jar packages for us to use. For details, see upgrade to Spring Boot 2.0 NoClassDefFoundError UndertowEmbeddedServletContainerFactory · Issue #1962 · openzipkin/zipkin · GitHub
And the previous @ EnableZipkinServer has also been marked @ Deprecated
If you decide to make a custom server, you accept responsibility for troubleshooting your build or configuration problems, even if such problems are a reaction to a change made by the OpenZipkin maintainers. In other words, custom servers are possible, but not supported.
EnableZipkinServer.javagithub.com/openzipkin/zipkin/blob/master/zipkin-server/src/main/java/zipkin/server/EnableZipkinServer.java
In short: change the package without permission, and bear the consequences.
So the official one click script
curl -sSL https://zipkin.io/quickstart.sh | bash -s
java -jar zipkin.jar
If Docker is used, directly
docker run -d -p 9411:9411 openzipkin/zipkin
Visit http://IP:9411/zipkin after startup/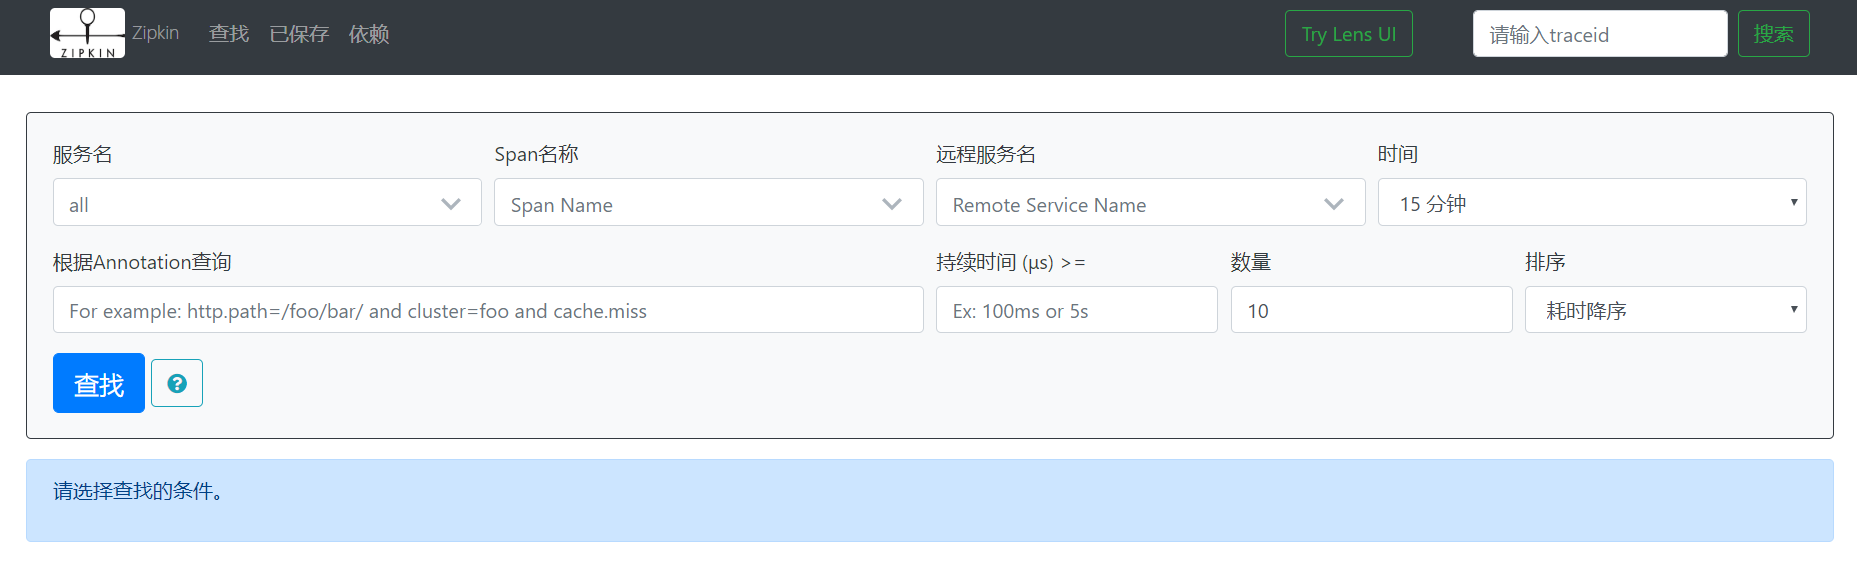
The server is set up.
Microservice application
HTTP message mode
Both services need to introduce the following dependencies
<dependency>
	<groupId>org.springframework.cloud</groupId>
	<artifactId>spring-cloud-starter-netflix-eureka-client</artifactId>
</dependency>

<!--sleuth Service trace dependency-->
<dependency>
	<groupId>org.springframework.cloud</groupId>
	<artifactId>spring-cloud-starter-sleuth</artifactId>
</dependency>

<!--zipkin rely on-->
<dependency>
	<groupId>org.springframework.cloud</groupId>
	<artifactId>spring-cloud-starter-zipkin</artifactId>
</dependency>
The two services also need to add the following configuration
eureka.client.service-url.defaultZone=http://192.168.xxx.xxx:8761/eureka/,http://192.168.xxx.xxx:8762/eureka/

# Set the sample scale to 1.0, which is all you need. The default is 0.1
spring.sleuth.sampler.probability=1.0
# Specify the address of the Zipkin server
spring.zipkin.base-url=http://106.15.120.126:9411/
Spring Cloud Sleuth has a Sampler policy, through which you can control the sampling algorithm. The samplers will not block the generation of span related IDS, but will affect the related operations of exporting and attaching event tags. The implementation of Sleuth's default sampling algorithm is reservior sampling. The specific implementation class is PercentageBasedSampler. The default sampling ratio is 0.1 (10%). However, we can use spring.sleuth.sampler.percentage to set the value between 0.0 and 1.0, and 1.0 means all collection.
Message bus mode (take rabbitmq as an example)
Compared with HTTP mode, both services increase a dependency
<!--zipkin Use rabbitmq Dependence on data collection-->
<dependency>
	<groupId>org.springframework.cloud</groupId>
	<artifactId>spring-cloud-stream-binder-rabbit</artifactId>
</dependency>
At the same time, the configuration file has also changed. The main difference is that the rabbitmq related configuration has been added and the spring. Zipkin. Base url = http://106.15.120.126:9411/ has been deleted.
eureka.client.service-url.defaultZone=http://192.168.xxx.xxx:8761/eureka/,http://192.168.xxx.xxx:8762/eureka/

# Set the sample scale to 1.0, which is all you need. The default is 0.1
spring.sleuth.sampler.probability=1.0
# Set to rabbitmq to collect information, or kafka or web
spring.zipkin.sender.type=rabbit
# Set the queue used by zipkin. The default is zipkin
spring.zipkin.rabbit.queue=zipkin

#rabbitmq configuration
spring.rabbitmq.host=106.15.120.126
spring.rabbitmq.port=5672
spring.rabbitmq.username=admin
spring.rabbitmq.password=admin
spring.rabbitmq.virtual-host=/
Changes of zipkin server startup
because Zipkin no longer recommends us to define the Server side, we can't find Zipkin Server in the latest version of Spring Cloud dependency management.
So how to get trace information from RabbitMQ directly with the official jar package?
We can use environment variables to let Zipkin read information from RabbitMQ, as follows:
RABBIT_ADDRESSES=localhost java -jar zipkin.jar
The configurable environment variables are shown in the following table:
| attribute | environment variable | describe |
|---|---|---|
| zipkin.collector.rabbitmq.concurrency | RABBIT_CONCURRENCY | Number of concurrent consumers, 1 by default |
| zipkin.collector.rabbitmq.connection-timeout | RABBIT_CONNECTION_TIMEOUT | Timeout when establishing the connection. The default is 60000 milliseconds, i.e. 1 minute |
| zipkin.collector.rabbitmq.queue | RABBIT_QUEUE | The queue from which span information is obtained. The default is zipkin |
| zipkin.collector.rabbitmq.uri | RABBIT_URI | accord with RabbitMQ URI specification For example, amqp://user:pass@host:10000/vhost |
If the URI is set, the following properties are ignored.
| attribute | environment variable | describe |
|---|---|---|
| zipkin.collector.rabbitmq.addresses | RABBIT_ADDRESSES | Comma separated list of RabbitMQ addresses, such as localhost:5672,localhost:5673 |
| zipkin.collector.rabbitmq.password | RABBIT_PASSWORD | The password used to connect to RabbitMQ, default to guest |
| zipkin.collector.rabbitmq.username | RABBIT_USER | The user name used to connect to RabbitMQ, default to guest |
| zipkin.collector.rabbitmq.virtual-host | RABBIT_VIRTUAL_HOST | RabbitMQ virtual host used, default is/ |
| zipkin.collector.rabbitmq.use-ssl | RABBIT_USE_SSL | Set to true to establish a link with RabbitMQ by SSL |
The contents of the yml configuration file of zipkin.jar can be viewed here
zipkin tracking data landing in MySQL
zipkin stores data in memory by default. If the amount of data is too large or the system runs too long, the memory will burst, so the recorded data can be stored in MySQL.
Just add the environment variables when starting the zipkin server.
| attribute | environment variable | describe |
|---|---|---|
| zipkin.collector.storage.type | STORAGE_TYPE | Data type, mem by default, i.e. stored in memory |
| zipkin.collector.storage.type.mysql.db | MYSQL_DB | Database used, zipkin by default |
| zipkin.collector.storage.type.mysql.username | MYSQL_USER | Database users |
| zipkin.collector.storage.type.mysql.password | MYSQL_PASS | Database user password |
| zipkin.collector.storage.type.mysql.host | MYSQL_HOST | Database address, default to localhost |
| zipkin.collector.storage.type.mysql.port | MYSQL_TCP_PORT | Database port, 3306 by default |
| zipkin.collector.storage.type.mysql.max-active | MYSQL_MAX_CONNECTIONS | Maximum connections, default is 10 |
| zipkin.collector.storage.type.mysql.use-ssl | MYSQL_USE_SSL | Use ssl or not, default value is false |
Official database script address , which is officially copied from GitHub.
--
-- Copyright 2015-2019 The OpenZipkin Authors
--
-- Licensed under the Apache License, Version 2.0 (the "License"); you may not use this file except
-- in compliance with the License. You may obtain a copy of the License at
--
-- http://www.apache.org/licenses/LICENSE-2.0
--
-- Unless required by applicable law or agreed to in writing, software distributed under the License
-- is distributed on an "AS IS" BASIS, WITHOUT WARRANTIES OR CONDITIONS OF ANY KIND, either express
-- or implied. See the License for the specific language governing permissions and limitations under
-- the License.
--

CREATE TABLE IF NOT EXISTS zipkin_spans (
  `trace_id_high` BIGINT NOT NULL DEFAULT 0 COMMENT 'If non zero, this means the trace uses 128 bit traceIds instead of 64 bit',
  `trace_id` BIGINT NOT NULL,
  `id` BIGINT NOT NULL,
  `name` VARCHAR(255) NOT NULL,
  `remote_service_name` VARCHAR(255),
  `parent_id` BIGINT,
  `debug` BIT(1),
  `start_ts` BIGINT COMMENT 'Span.timestamp(): epoch micros used for endTs query and to implement TTL',
  `duration` BIGINT COMMENT 'Span.duration(): micros used for minDuration and maxDuration query',
  PRIMARY KEY (`trace_id_high`, `trace_id`, `id`)
) ENGINE=InnoDB ROW_FORMAT=COMPRESSED CHARACTER SET=utf8 COLLATE utf8_general_ci;

ALTER TABLE zipkin_spans ADD INDEX(`trace_id_high`, `trace_id`) COMMENT 'for getTracesByIds';
ALTER TABLE zipkin_spans ADD INDEX(`name`) COMMENT 'for getTraces and getSpanNames';
ALTER TABLE zipkin_spans ADD INDEX(`remote_service_name`) COMMENT 'for getTraces and getRemoteServiceNames';
ALTER TABLE zipkin_spans ADD INDEX(`start_ts`) COMMENT 'for getTraces ordering and range';

CREATE TABLE IF NOT EXISTS zipkin_annotations (
  `trace_id_high` BIGINT NOT NULL DEFAULT 0 COMMENT 'If non zero, this means the trace uses 128 bit traceIds instead of 64 bit',
  `trace_id` BIGINT NOT NULL COMMENT 'coincides with zipkin_spans.trace_id',
  `span_id` BIGINT NOT NULL COMMENT 'coincides with zipkin_spans.id',
  `a_key` VARCHAR(255) NOT NULL COMMENT 'BinaryAnnotation.key or Annotation.value if type == -1',
  `a_value` BLOB COMMENT 'BinaryAnnotation.value(), which must be smaller than 64KB',
  `a_type` INT NOT NULL COMMENT 'BinaryAnnotation.type() or -1 if Annotation',
  `a_timestamp` BIGINT COMMENT 'Used to implement TTL; Annotation.timestamp or zipkin_spans.timestamp',
  `endpoint_ipv4` INT COMMENT 'Null when Binary/Annotation.endpoint is null',
  `endpoint_ipv6` BINARY(16) COMMENT 'Null when Binary/Annotation.endpoint is null, or no IPv6 address',
  `endpoint_port` SMALLINT COMMENT 'Null when Binary/Annotation.endpoint is null',
  `endpoint_service_name` VARCHAR(255) COMMENT 'Null when Binary/Annotation.endpoint is null'
) ENGINE=InnoDB ROW_FORMAT=COMPRESSED CHARACTER SET=utf8 COLLATE utf8_general_ci;

ALTER TABLE zipkin_annotations ADD UNIQUE KEY(`trace_id_high`, `trace_id`, `span_id`, `a_key`, `a_timestamp`) COMMENT 'Ignore insert on duplicate';
ALTER TABLE zipkin_annotations ADD INDEX(`trace_id_high`, `trace_id`, `span_id`) COMMENT 'for joining with zipkin_spans';
ALTER TABLE zipkin_annotations ADD INDEX(`trace_id_high`, `trace_id`) COMMENT 'for getTraces/ByIds';
ALTER TABLE zipkin_annotations ADD INDEX(`endpoint_service_name`) COMMENT 'for getTraces and getServiceNames';
ALTER TABLE zipkin_annotations ADD INDEX(`a_type`) COMMENT 'for getTraces and autocomplete values';
ALTER TABLE zipkin_annotations ADD INDEX(`a_key`) COMMENT 'for getTraces and autocomplete values';
ALTER TABLE zipkin_annotations ADD INDEX(`trace_id`, `span_id`, `a_key`) COMMENT 'for dependencies job';

CREATE TABLE IF NOT EXISTS zipkin_dependencies (
  `day` DATE NOT NULL,
  `parent` VARCHAR(255) NOT NULL,
  `child` VARCHAR(255) NOT NULL,
  `call_count` BIGINT,
  `error_count` BIGINT,
  PRIMARY KEY (`day`, `parent`, `child`)
) ENGINE=InnoDB ROW_FORMAT=COMPRESSED CHARACTER SET=utf8 COLLATE utf8_general_ci;
Verification
Visit http://192.168.xxx.xxx:9411/zipkin/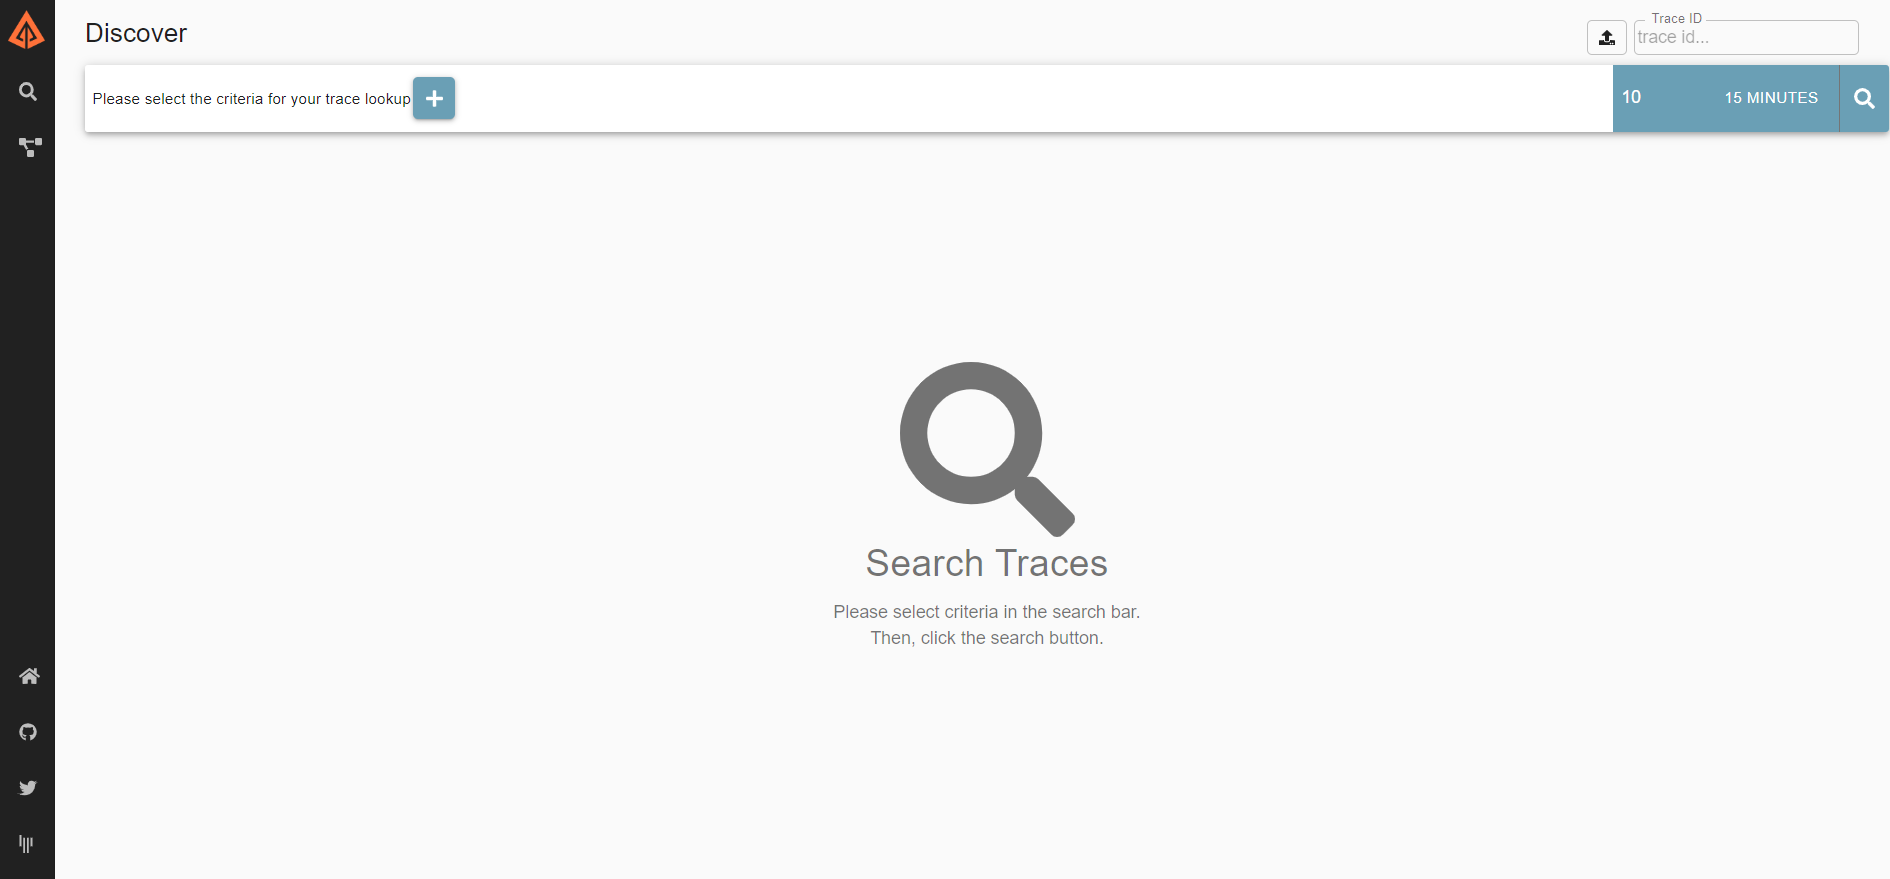
If rabbitmq is adopted, you can see the queue named zipkin by visiting the web page of rabbitmq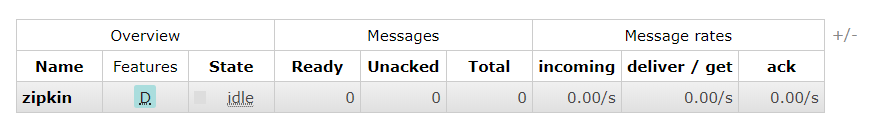
Reference: https://windmt.com/2018/04/24/spring-cloud-12-sleuth-zipkin/

