Measure what
When planning measurement collection, the problem inevitably arises, that is, defining which measurements to observe. To answer this question, we should turn to current best practices and methods. In the following topics, we will outline some of the most influential and interesting methods that can reduce noise and improve visibility in terms of performance and general reliability.
1.Google proposes to monitor the following four indicators:
    Delay: the time required for a service request
    Traffic: number of requests being issued
    Error: rate of request failures
    Saturation: unprocessed workload, usually in a queue.
2.brendan The method focuses more on machines, which declare for each resource( CPU,Disk, network interface, etc.), the following indicators should be monitored:
	Utilization: measured as a percentage of busy resources
	Saturation: workload that resources cannot handle, usually queued
	Errors: number of errors that occurred
3.Tom.Wilkie's red method
RED The approach focuses more on the service level approach than the underlying system itself. Obviously, this strategy is useful for monitoring services and predicting the customer experience. If the error rate of the service increases, it is reasonable to assume that these errors will directly or indirectly affect the customer experience. These are the metrics to note:
	Rate: converted to requests per second
	Error: number of failed requests per second
	Persistence: the time taken for these requests
prometheus local storage
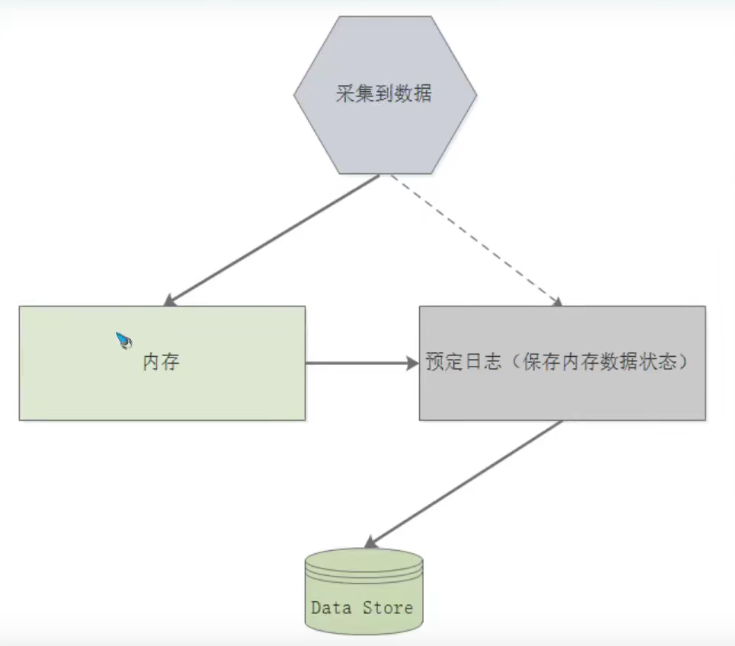
On local storage prometheus Standard method of storing data. At a very high level, Prometheus The storage design of is a combination of index implementation, which uses all currently stored tags and their worthy publishing list, as well as its own time series data format.
1.Data flow: Prometheus The way to store the collected data locally can be seen as a three part process. The following topics describe the stages that data goes through before it is successfully persisted.
1)The latest batch of data is stored in memory for up to two hours. This includes one or more data blocks collected during a two-hour time window. This method greatly reduces the number of disks IO Twice the; The latest data is stored in memory, and the query speed is amazing; Data blocks are created in memory to avoid continuous disk write operations.
2)Pre write log:
In memory, the data is not persistent. If the process terminates abnormally, the block is written to disk. These blocks are immutable, and even if the data can be deleted, they are not atomic. contrary, tombstone Files are created with data information that is no longer needed.
2.layout
 As we can see in the following example, Prometheus The storage mode of data in is organized into a series of directories (blocks), which contain data blocks levelDB An index is metadata. With human readable information about blocks json Files, and data that is no longer needed tombstone. Each block represents a database.
At the top level, you can also see that the data is not refreshed to the WAL of your own data block:
...
|---01CZMVW4CB6DCKK8Q33XY%ESQH
|	|--- chunks
|	|  |__000001
|	|---index
|	|---meta.json
|	|---tmbstones
|---01CZNGF9GG10R2P56R9G39NTSJE
|	|---chunks
|	|  |__000001
|	|---index
|	|---meta.json
|	|___tombstones
.....................
.....................
prometheus data model
prometheus stores data in a bit time series, including key value pairs called tags, timestamps, and last values. The following topics extend these components and provide the basics of each component.
1. Representation
Prometheus' time series is as follows:
<metric_name>[{<label_1="value_1">,<label_N="value_N">}] <datapoint<numerical_value>
The following cases:
api_http_requests_total{method="POST",handler="messages"}
As you can see, it is represented as a measure name, optionally followed by one or more sets of label names / values in curly braces, followed by the value of the measure. In addition, the sample also has a time stamp with millisecond accuracy.
2.Metric names
Although this is an implementation detail, the metric name is just the value of a special tag called "name". Therefore, if you have an internal measurement called "beverages_total", it is expressed as "_name=beverages_total". Remember that the tags surrounded by "" are Prometheus, and any tags prefixed with "_" are only available at some stages of the measurement collection cycle.
The combination of label (key / value) and measure name defines the identification of time series.
Each metric name in Prometheus must conform to the following regular expression:
"[a-zA-Z_:][a-zA-Z0-9_:]*"
Only upper and lower case letters of English letters (a-z), underscores (), colons (:) and Arabic numerals (0-9) are allowed, except the first character of the number.
3.Metric Labels
Tags, or key / value pairs associated with a measure, add dimensions to the measure. Prometheus was so good at slicing and cutting an important part of the sequence of events. Although the tag value can be a complete UTF-8, the tag name must match the regular expression to be considered valid; [for example, "- za-z0-9#] *".Their main difference in metric names is that label names do not allow colons( 😃.
4.Samples
Samples are collected data points that represent the values of time series data. The components required to define an instance are a float64 value and a timestamp accurate to milliseconds. It should be remembered that samples collected out of order will be discarded by Prometheus. The same situation also occurs on samples with the same unit of measurement and different sample values.
Indicator type
1.counter: Count, which only increases but not decreases. It is suitable for counting the number and bytes of network card receiving and contracting, as well as the normal operation time of the system, etc. unless restarted, it will increase all the time.
2.Gauge:A measurement is a measure that takes a snapshot of a given measurement at the time of collection and can increase or decrease (such as humidity, disk space, and memory usage)
3.Histogram:In most cases, people tend to use the average value of some quantitative indicators, such as CPU The average utilization rate and the average response time of the page. The problem in this way is obvious to the system API Take the average response time of calls as an example: if most API Requests are maintained at 100 ms The response time of individual requests needs 5 s,Then it will lead to some web When the response time of a page falls to the median, this phenomenon is called the long tail problem.

    Histogram Often used for observation, a Histogram Include the following:
    (1)Buckets:A bucket is an observation counter. It should have a maximum boundary and a minimum boundary. Its format is<basename>_bucket{le="<bound_value>"}
    (2)Sum of observations, this is the sum of all observations. The format for it is<basename>_sum
    (3)Statistics of observation results, which is the sum of this observation. Its format is<basename>_count
    A Prometheus HTTP The request duration is in seconds, divided into buckets, which is displayed in the Grafana Heat map to better illustrate the concept of bucket:

4.Summaries:And Histogram Similar types are used to represent data sampling results over a period of time (usually request duration or response size, etc.), but it directly stores quantiles (calculated by the client and then displayed), rather than calculated by intervals.
Summary of indicators
Generally speaking, a single indicator is of little value to us. We often need to combine and visualize multiple indicators, which requires some mathematical transformation. For example, we may apply statistical functions to indicators or only standard groups. Some common functions may be applied, including:
Count: calculate the number of observation points in a specific time interval.
Summation: the cumulative sum of all observed values in a specific time interval.
Average: provides the average of all values in a specific time interval.
Middle number: the midpoint of the set of values, exactly 50%The value of is in front of it, and the other 50%Is behind it.
Percentile: measure the value of the observation point as a specific percentage of the total.
Standard deviation: displays the standard deviation between the index distribution and the average value, which can measure the difference degree of the data set. A standard deviation of 0 means that the data are equal to the average value, and a higher standard deviation means that the data is widely distributed.
Rate of change: displays the degree of change between data in the time series.
Index aggregation
In addition to the above metrics summary, you may often want to see an aggregated view of metrics from multiple sources, such as disk space usage of all application servers. The most typical style of indicator aggregation is to display multiple indicators on a graph, which helps you identify the development trend of the environment. For example, an intermittent fault in the load balancer may cause multiple servers to fail web Traffic drops, which are usually easier to find than by looking at each individual indicator.
prometheus installation and deployment
1.Prometheus binary installation
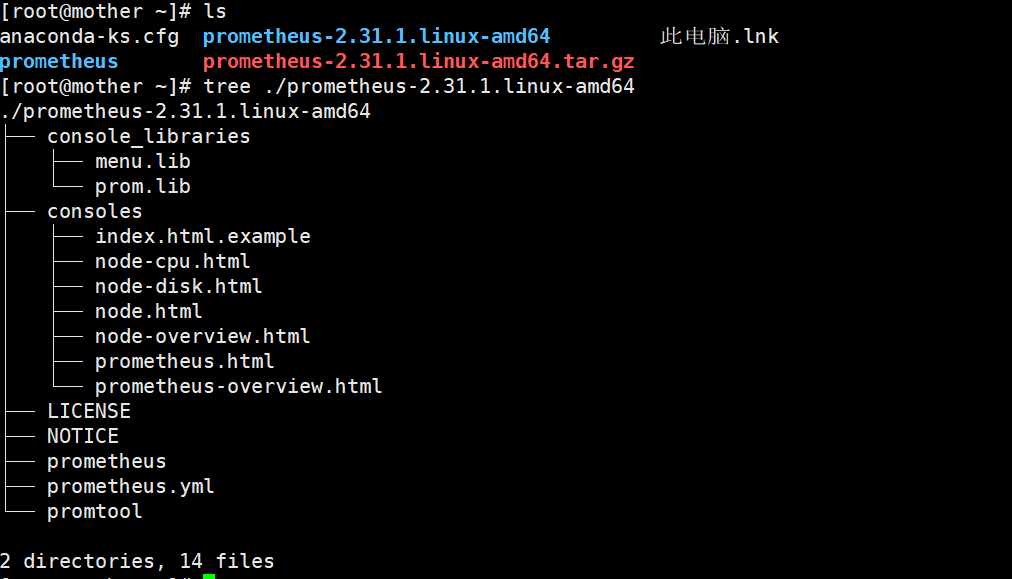
Go to Tsinghua source to download the binary package. This experiment uses prometheus-2.31.1.linux-amd64.tar.gz
Organization of Prometheus binary package files:
1.Preliminary preparation
1)Of each host DNS Correct parsing and time synchronization.
2)Clone project

2.install prometheus
1)Create a new system user
useradd --system prometheus
2)decompression tar Package and put each file in the correct directory
tar xvf prometheus-2.31.1.linux-amd64.tar.gz
mkdir -pv /usr/share/prometheus/consoles
install -m 0644 -D -t /usr/share/prometheus/consoles prometheus-2.31.1.linux-amd64/consoles/*
mkdir -p /usr/share/prometheus/consoles_libraries
install -m 0644 -D -t /usr/share/prometheus/consoles_libraries prometheus-2.31.1.linux-amd64/console_libraries/*
install -m 0755 prometheus-2.31.1.linux-amd64/promtool /usr/bin/
install -m 0755 prometheus-2.31.1.linux-amd64/prometheus /usr/bin/
install -d -o prometheus -g prometheus /var/lib/prometheus

vim prometheus.yml
global:
  scrape_interval:   15s
  evaluation_interval: 15s

alerting:
  alertmanagers:
  - static_configs:
    - targets:
      - alertmanager:9093

rule_files:
  - "first_rules.yml"


scrape_configs:

  - job_name: 'prometheus'

    static_configs:
    - targets:
      - 'prometheus:9090'

  - job_name: 'node'
    static_configs:
    - targets:
      - 'prometheus:9100'
      - 'grafana:9100'
      - 'alertmanager:9100'

  - job_name: 'grafana'
    static_configs:
    - targets:
      - 'grafana:3000'

  - job_name: 'alertmanager'
    static_configs:
    - targets:
      - 'alertmanager:9093'

vim prometheus.service
# vim:ser ft=systemd

[Unit]
Description=The Prometheus monitoring system and time series database.
Documentation=https://prometheus.io
After=network.target

[Service]
User=prometheus
LimitNOFILE=8192
ExecStart=/usr/bin/prometheus \
	--config.file=/etc/prometheus/prometheus.yml \
	--storage.tsdb.path=/var/lib/prometheus/data \
	--web.console.templates=/usr/share/prometheus/consoles \
	--web.console.libraries=/usr/share/prometheus/console_libraries
ExecReload=/bin/kill -HUP $MAINPID
Restart=on-failure

[Install]
WantedBy=multi-user.target

vim first_rules.yml
groups:
- name: example.rules
  rules:
  - alert: ExampleAlert
    expr: vector(42)
    labels:
      severity: "critical"
    annotations:
      description: Example alert is firing.
      link: http://example.com

install -m 0644 -D prometheus.yml /etc/prometheus/prometheus.yml
install -m 0644 -D first_rules.yml /etc/prometheus/first_rules.yml
install -m 0644 -D prometheus.service /etc/systemd/system/

systemctl daemon-reload
systemctl start prometheus  # Or use the profileus command: profileus -- config. File = / etc / profileus. YML
systemctl status prometheus
systemctl enable prometheus
ss -lnt  # prometheus listens on port 9090
2. Installation of Prometheus container
1.docker Recommended installation method
prometheus Mirrored storage Docker Hub
	If knowledge simply runs: docker run -p 9090:9090 prom/prometheus Then just use a simple configuration file and export it to port 9090 to run.
    prometheus Mirroring uses a volume to store the actual measurements. For production environments, it is strongly recommended to use data volume based containers.

2.There are two ways to use your own configuration:
2.1 Volume binding mount
(1)Mount when using volume startup (I use this method)
	docekr run -p 9090:9090 -v ~/prometheus/prometheus.yml:/etc/prometheus/prometheus.yml prom/prometheus

(2)Configure or use other volumes for
	docker run -p 9090:9090 -v /path/to/config:/etc/prometheus prom/prometheus

2.2 Custom image
 In order to manage the files on the host and bind and mount it, you can embed the configuration into the image. This approach works well if the configuration itself is static and the same in all environments.
(1)establish Dockerfile The contents of the document are as follows:
FROM:prom/prometheus
    ADD prometheus.yml /etc/prometheus
(2)Execute build
	docker build -t my-prometheus .
    docker run -p 9090:9090 my-prometheus
Manage containers through docker compose
1. Install docker compose
Go directly to the Alibaba mirror station to download the docker Toolkit (docker toolbox:docker machine/docker compose/Docker Client/Docker Kitematic)
VirtualBox) binary package, including docker compose, address: https://developer.aliyun.com/mirror/docker-toolbox?spm=a2c6h.13651102.0.0.25e31b11yICXdm
# Installation method:
1.This package is binary and not compressed. Download corresponding version directly docker-compose Just binary.
2.Execute the following command:
    mv docker-compose-Linux-x86_64 /usr/local/docker-compose # rename
    ln -s /usr/local/docker-compose /usr/bin/docker-compose
    chmod a+x /usr/local/docker-compose
    chmod a+x /usr/bin/docker-compose
3. docker-compose -v # Check docker compose version
2. Prepare docker-compose.yml
version: '3'

networks:
 monitor:
  driver: bridge

services:
 prometheus:
   image: prom/prometheus
   container_name: prometheus
   hostname: prometheus
   restart: always
   volumes:
     - ./prometheus.yml:/etc/prometheus/prometheus.yml
     - ./rules:/etc/prometheus/rules
     - /prometheus-data:/promtheus # In the bind volume mode, mount the database files in the prometheus container to the host machine. Otherwise, the default mounting path can be viewed through docker inspect prometheus, / var / lib / docker / volumes //_ data/
   ports:
     - "9090:9090"
   networks:
     - monitor


docker-compose up -d # Start the docker-compose.yml file to define all docker containers
docker-compose down # Stop all containers
docker-compose start service # Start a container if it has already been created
docker-compose restart service # restart
docker-compose kill service #Kill a container

docker-compose -h # View the options for using the docker compose command
prometheus configuration
1. Configure prometheus to monitor itself
prometheus collects the data of monitored targets by collecting HTTP breakpoint data on these targets. Because prometheus will expose his data in the same way, it can also collect and monitor his health.
# Configure the prometheus.yml file
global:
  scrape_interval:  15s
  external_labels:
    monitor: 'codelab-monitor'

# A scrape configuration containing exactly one endpoint to scrape:
# Here it's Prometheus itself.
scrape_configs:
  # The job name is added as a label `job=<job_name>` to any timeseries scraped from this config.
  - job_name: 'prometheus'

  # Override the global default and scrape targets from this job every 5 seconds.
    scrape_interval: 5s
    static_configs:
    - targets: ['localhost:9090']
prometheus configuration command details
There are two main ways to configure prometheus:
1. Directly run in the form of command line plus options and parameters;
2. Put the options and parameters into a configuration file to run;
Prometheus can reload the configuration at run time. If the new configuration is not a valid configuration, the changes are not applied. The configuration reload is triggered by sending a SIGHUP to the Prometheus process or an HTTP POST request to the / - / reload endpoint. This will also reload. This will also reload any configured rule files.
1.Prometheus startup configuration
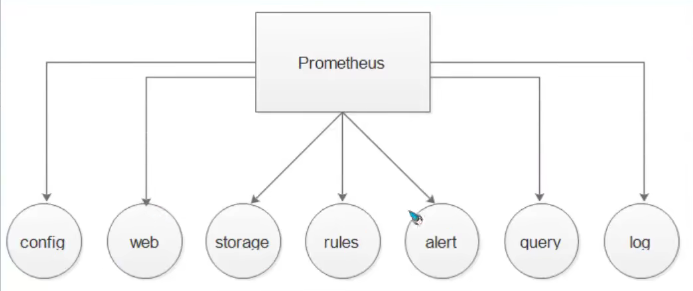
1.1 config
 Usually first through --config.file The option is to set the Prometheus configuration file path. default Prometheus The startup command looks in the current directory Prometheus.yml File.
1.2 storage
--storage.tsdb.path Specifies the path to the data store. The default is stored in the current directory/data catalogue
1.3 web
--web.external-url Option assignment Prometheus Server URL Address.
--web.enable-admin-api If the option is enabled, you can HTTP The endpoint performs some advanced administrative operations. For example, create data snapshots and delete time series data.
1.4 query
 How to tune the internal working mode of the query engine. Some are easy to understand, such as how long a given query can run before it is terminated(--query.tumeout),Or how many concurrent queries can be made(--query.max-concurrency)
2.prometheus profile overview
We can split the configuration file into the following parts:
global
scrape_configs
alerting
rule_files
remote_read
remote_write
3. Global configuration case
Global configuration specifies parameters that are valid in all other configuration contexts. They can also be used as defaults for other configuration parts.
global:
  scrape_interval: 1m # The interval value of the capture measurement time, usually between 10 seconds and 1 minute
  scrape_timeout: 10s #Set the wait time to take measurements
  evaluation_interval: 1m
  external_labels: # Label data
    dc: dc1
    prom: prom1

# ==================================================================================
1.scrape_interval: <duration> | default =1m:The interval value of the capture measurement. The default value is 1 minute
2.[scrape_timeout: <duration> | default = 10s ]:Sets the timeout for fetching metrics.
3.[ evaluation_interval: <duration> | default = 1m]:Evaluate warning intervals, often with scrape_interval same.
4.external_labels:
	[ <labelname>: <labelname> ... ] :When tied to an external system (remote storage, AlertManager)Tags added to time series data or warnings when communicating.
5. [ query_log_file:<strins>]:PromQL Query record
4. Configuration case of scene
This configuration mainly specifies the goal of collecting metrics, that is, which services to collect values.
The configuration case is as follows:
# The job name assigned to scraped metrics by default.
job_name: <job_name>

# How frequently to scrape targets from this job.
[ scrape_interval: <duration> | default = <global_config.scrape_interval> ]

# Per-scrape timeout when scraping this job.
[ scrape_time: <duration> | default = <global_config.scrape_timeout> ]

# The HTTP resource path on whuch to fetch metrics from targets.
[ metrics_path: <path> | default = /metrics ]

# Configures the protocol scheme used for requests.
[ scheme: <scheme> | default = http ]

# Optional HTTP URL parameters.
params:
  [ <string>: [<string>,...] ]

# Sets the 'Authorization' header on every scrape request with the configured username and password. password and password_file are mutually exclusive.
basic_auth:
  [ username: <string> ]
  [ password: <secret> ]
  [password_file: <string>]
5. Classification of labels
Labels can be basically divided into topology labels and mode labels:
1. Topology label: cut service components through physical or logical composition, such as the name of the Job, the data center, etc.
2. The pattern tag is url, error code or user.
6. Relebel of Prometheus_ Understanding of configs
Re tagging is a powerful tool that can be rewritten dynamically before the target tag set is captured. Multiple re marking steps can be configured every scratch configuration. They are applied to each target's label set in the order they appear in the configuration file.
Initially, in addition to the tags configured for every target, the job tag of the target is set to each scraped configured job_name value. For example__ address__ Label is set to the address of the target. After re labeling, if it is not set, this instance will be set__ address__ Value of. And__ scheme__ And__ metrics_path__ Set scheme and metrics as targets respectively, and__ param is set to the value of the first parameter passed to the URL.
With__ The beginning label will be removed from the label set after the target is relabeled.
If the retag step only needs to temporarily store label values, use__ tmp's label prefix, which guarantees Prometheus that he will never use it.
# The source labels select values from existing labels. Their content is concatenated using the configured separator and matched against the configured regular expression for the replace,keep,and drop action.
[ source_labels: '[' <labelname> [,...] ']' ]

# Sepatator placed between concatenated source label values.
[ separator: <string> | default = ; ]

# Label to which the resulting value is written in a replace action. It is mandatory for replace actions. Regex capture groups are available.
[ target_label: <labelname> ]

# Regualr expression against which the extrected value is matched.
[ regex: <regex> | default = (.*) ]

# Modulus to take of the hash of the source label values.
[ modulus: ,uint64> ]

# Replacement value againt which a regex replace is performed if the regular expression matches. Regex capture groups are available.
[ replacement: <string> | default = $1 ]

# Action to perform based on regex matching.
[ action: <relabel_action> | default = replace ]
Actions such as replace, keep,drop,labelmap,labledrop and labelkeep are required.
<relable_ Action > determines the action to be relabeled.
replace: match regex with source_labels. If they match, set target_label is replacement. If the regular expressions do not match, no action will be performed.
keep: source for regular expression mismatch_ The target of labels is discarded.
drop: source for regular expression matching_ The target of labels is discarded.
Label drop: match regex to all labels. Any matching labels are removed from the label set.
Label keep: match regex with all tag names. Any mismatched labels are removed from the label set.
If no action is defined, the default is replace.
We have two stages to relabel. The first stage is to re label the target from service discovery, which is very useful for applying the information in the metadata tag from service discovery to the tag on the indicator. The second stage is after fetching the index but before the storage system. In this way, you can determine which indicators need to be saved, which indicators need to be discarded, and the style of these indicators.
Use relabel before grabbing_ Configs, use metrics after crawling_ relabel_configs.
Use case
1. Discard unnecessary measures
2. Discard unwanted time series (measures with specific variables)
3. Discard measures that are sensitive or do not want to contain certain labels.
4. Modify the final label format
When implementing these scenarios, Prometheus will apply some logic to the data before it is stored by the community and permanently.
1. Discard unnecessary metrics
- job_name: cadvisor
  ...
  metric_relabel_configs:
  - source_labels: [__name__]
    regex: '(container_tasks_state|container_memory_failure_total)'
    action: drop
He will make it with the name container_tasks_state and container_ memory_ failure_ The metric of total is completely deleted and will not be stored in the database__ name__ Reserved for metric name.
2. Discard unnecessary time series
- job_name: cadvisor
  ...
  metric_relabel_configs:
  - source_labels: [id]
    regex: '/system.slice/var-lib-docker-containers.*-shm.mount'
    action: drop
  - source_labels: [container_label_JenkinsId]
    regex: '.+'
    action: drop
Discard all tag pairs containing id = '/ system. Slice / var lib Docker containers. * - SHM. Mount' or tag containers_ label_ Jenkinsid's time series. If it belongs to a single measure, this is not necessary. It will apply to all metrics with predefined tag sets. This may help to avoid unnecessary garbage pollution to the index data. For container_ label_ Jenkins ID, which is especially useful when you let Jenkins run slave servers in the Docker container and don't want them to disturb the underlying host container indicators (such as Jenkins server container itself, system container, etc.).
3. Discard the measurement of some sensitive or unwanted tags
- job_name: cadvisor
  ...
  metric_relabel_configs:
  - regex: 'container_label_com_amazonaws_ecs_task_arn'
    action: labeldrop
The code side will delete the name container_label_com_amazonaws_ecs_task_arn label. This is useful when Prometheus does not want to record sensitive data for security reasons. In my example, I'd rather not store AWS resource identifiers because I don't even need them. Note that when deleting a tag, you need to ensure that the final indicator after the tag is deleted is still uniquely marked and will not lead to repeated time series with different values.
4. Modify the final label format
- job_name: cadvisor
  ...
  metric_relabel_configs:
  - source_labels: [image]
    regex: '.*/(.*)'
    replacement: '$1'
    target_label: id
  - source_labels: [service]
    regex: 'ecs-.*:ecs-([a-z]+-*[a-z]*).*:[0-9]+'
    replacement: '$1'
    target_label: service
There are two rules to execute. The first one takes the measure containing the image tag name and matches. / (.), and puts it at the end of the new tag id. For example:
container_memery_rss{image="quiq/logspout:20170306"} will become a container_memery_rss{id="logspout:20170306"}.
The second rule resolves the container name. By default, ECS agent creates the container name on the AWS ECS instance, extracts its RECOGNIZABLE service name, and puts it into the service tag. In this way, you can operate with a human readable container service name.