Articles Catalogue
Debugging c++ with vs code
Debugging simple projects on linux systems
If we only write a small number of cpp files without third-party packages, we can compile them directly using g++.
The following is the method of the official website.
Prerequisite, install plug-in c/c++.

1. Setting the compiler path
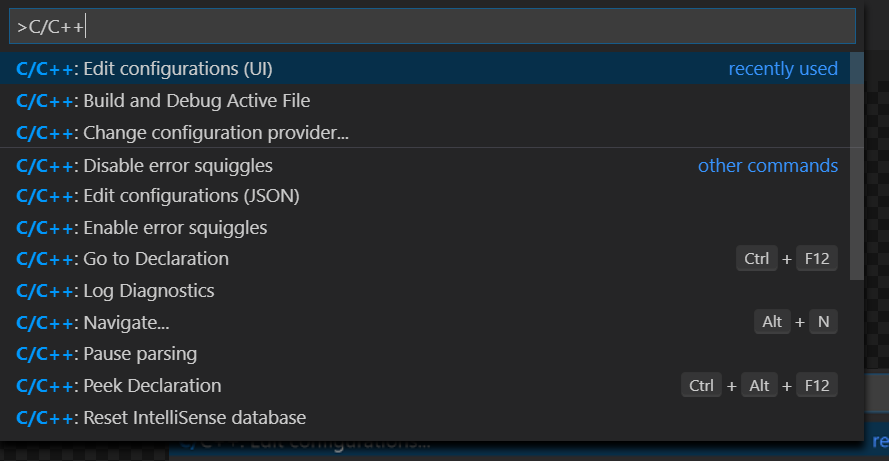
Press ctrl+shift+p to open the command panel.
As shown in the figure above, select c/c++:edit configurations(UI)
Set up
- Compiler path /usr/bin/g++
- IntelliSense mode gcc-x64


Automatically generate. vscode c_cpp_properties. JSON file after setting up
The document reads as follows
{
    "configurations": [
        {
            "name": "Linux",
            "includePath": [
                "${workspaceFolder}/**"
            ],
            "defines": [],
            "compilerPath": "/usr/bin/g++",
            "cStandard": "c11",
            "cppStandard": "c++17",
            "intelliSenseMode": "gcc-x64"
        }
    ],
    "version": 4
}
In vscode, you can display the annotations by placing the mouse on the name
2. Create a build task
Press ctrl+shift+p to open the command panel. Enter Tasks: Configure Default Build Task.
Select Use Template to Create task.json File > Select others
The task.json file generated automatically is as follows:
{
	// See https://go.microsoft.com/fwlink/?LinkId=733558
	// for the documentation about the tasks.json format
	"version": "2.0.0",
	"tasks": [
		{
			"label": "echo",
			"type": "shell",
			"command": "echo Hello"
		}
	]
}
Amend it to read:
{
     "version": "2.0.0",
     "tasks": [
         {
             "label": "helloworld",
             "type": "shell",
             "command": "g++",
             "args": [
                 "-g",
                 "-std=c++11",
                 "-o",
                 "./helloworld.out",
                 "helloworld.cpp"
             ],
             "group": {
                 "kind": "build",
                 "isDefault": true
             }
         }
     ]
 }
The - g in the parameter indicates that debug mode compilation is enabled, otherwise debugging cannot be done.
3. Configure debugging options
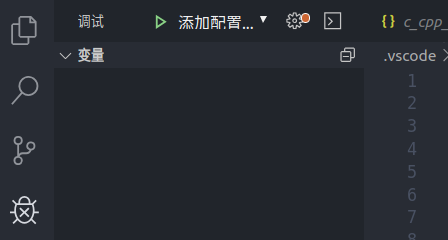
Select Add Configuration in the Debugging Panel, and then select c/c++(GDB/LLDB)

Finally, the launch.json file is generated, which reads as follows:
{
	// Use IntelliSense to understand the relevant properties.
	// Hover to see the description of existing properties.
	// For more information, visit https://go.microsoft.com/fwlink/?linkid=830387.
	"version": "0.2.0",
	"configurations": [
		{
			"name": "(gdb) Launch",
			"type": "cppdbg",
			"request": "launch",
			"program": "enter program name, for example ${workspaceFolder}/a.out",
			"args": [],
			"stopAtEntry": false,
			"cwd": "${workspaceFolder}",
			"environment": [],
			"externalConsole": false,
			"MIMode": "gdb",
			"setupCommands": [
				{
					"description": "Enable pretty-printing for gdb",
					"text": "-enable-pretty-printing",
					"ignoreFailures": true
				}
			]
		}
	]
}
Some modifications are needed:
{
	// Use IntelliSense to understand the relevant properties.
	// Hover to see the description of existing properties.
	// For more information, visit https://go.microsoft.com/fwlink/?linkid=830387.
	"version": "0.2.0",
	"configurations": [
		{
			"name": "(gdb) Launch",
			"type": "cppdbg",
			"request": "launch",
			"program": "${workspaceFolder}/helloworld.out",
			"args": [],
			"stopAtEntry": false,
			"cwd": "${workspaceFolder}",
			"environment": [],
			"externalConsole": false,
			"MIMode": "gdb",
			"setupCommands": [
				{
					"description": "Enable pretty-printing for gdb",
					"text": "-enable-pretty-printing",
					"ignoreFailures": true
				}
			]
		}
	]
}
4. Add source code
Create a new helloworld.cpp file in the project directory and write it as follows:
 #include <iostream>
 #include <vector>
 #include <string>

 using namespace std;

 int main()
 {

     vector<string> msg {"Hello", "C++", "World", "from", "VS Code!", "and the C++ extension!"};

     for (const string& word : msg)
     {
         cout << word << " ";
     }
     cout << endl;
 }
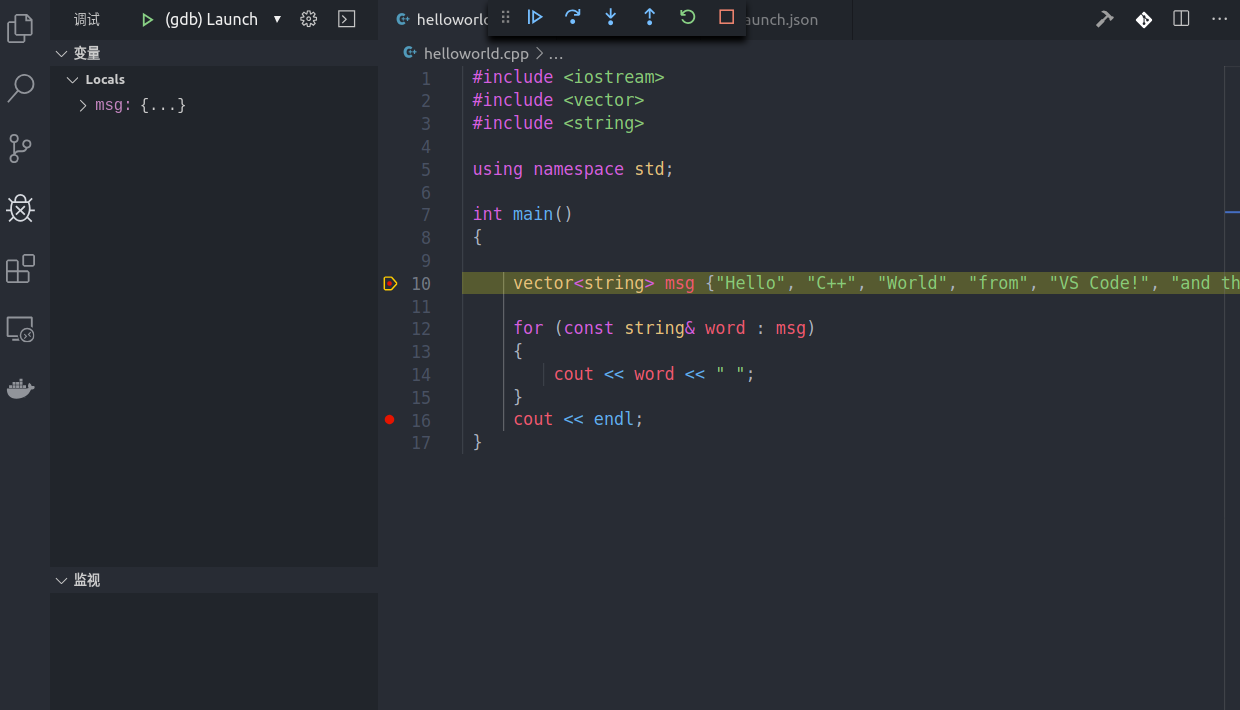
Set the break and click debug:

Always click on the single step to skip the execution and a prompt pops up that "libc-start.c" cannot be opened: the file cannot be read (Error: cannot find the file (/build/glibc-LK5gWL/glibc-2.23/csu/libc-start.c)). I don't know why this problem is. It may be a bug.
Summary
In order to debug, we need to create three files under. vscode:
- c_cpp_properties.json: This file is a c/c++ plug-in for code hints and error correction settings, independent of compilation.
- tasks.json: This file is to set the compiled configuration file, command parameters, compiler, args parameters, compiler parameters. Press Ctrl + Shift + B to compile.
- launch.json: Debugger configuration file, program settings to debug the program, MIMode settings debugger.
Debugging complex projects on linux systems
If the project to be debugged is complex, compiling with g++ will be laborious, so cmake can be used for project construction.
1. Installing plug-ins
- Cmake plug-in: You can write cmakellists, code prompts and error correction.
- CMake Tools Plug-in: Provide some cmake shortcuts
After the plug-in is installed, open the command panel, enter: Cmake: quick start, enter the project name, and you can create a new CMakeLists.txt file. The contents are as follows:
cmake_minimum_required(VERSION 3.0.0)
project(helloword VERSION 0.1.0)

# Manually added, otherwise c++11 will not be used in Ubuntu 16.04
add_definitions(-std=c++11)

include(CTest)
enable_testing()

add_executable(helloword main.cpp)

set(CPACK_PROJECT_NAME ${PROJECT_NAME})
set(CPACK_PROJECT_VERSION ${PROJECT_VERSION})
include(CPack)
Change add_executable(helloword main.cpp) to add_executable(helloword helloworld.cpp)
Manually add a command to make the compiler use the c++11 standard
add_definitions(-std=c++11)
2. Modify launch.json file
Here, the tasks.json file is scrapped because we are not compiling using the tasks.json configuration file.
Modify the launch.json file to modify the executable file path specified by the program parameter
{
	// Use IntelliSense to understand the relevant properties.
	// Hover to see the description of existing properties.
	// For more information, visit https://go.microsoft.com/fwlink/?linkid=830387.
	"version": "0.2.0",
	"configurations": [
		{
			"name": "(gdb) Launch",
			"type": "cppdbg",
			"request": "launch",
			"program": "${workspaceFolder}/build/helloworld",
			"args": [],
			"stopAtEntry": false,
			"cwd": "${workspaceFolder}",
			"environment": [],
			"externalConsole": false,
			"MIMode": "gdb",
			"setupCommands": [
				{
					"description": "Enable pretty-printing for gdb",
					"text": "-enable-pretty-printing",
					"ignoreFailures": true
				}
			]
		}
	]
}
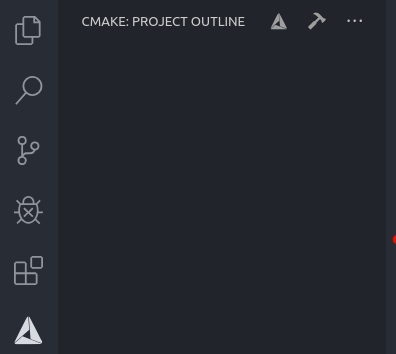
3. On the cmake control panel, click configure and build in turn.

4. Debugging
Now you can debug on the debug panel.
Summary
- Install plug-ins cmake and cmake tools
- Discard tasks.json file and modify launch.json file
- Using cmake to build projects
- debugging