BACKGROUND: Recently, in the development of projects, the adjustment of basic indicators is involved. Relevant composite indicators and downstream dependent indicator codes all need to be replayed.
unpivot row and column transitions
Case: Now there is a fruit table, which records the sales volume of four quarters. Now it is necessary to display the sales situation of each fruit in multiple rows of data.
Create tables and data
create table Fruit(id int,name varchar(20), Q1 int, Q2 int, Q3 int, Q4 int);
insert into Fruit values(1,'Apple',1000,2000,3300,5000);
insert into Fruit values(2,'Orange',3000,3000,3200,1500);
insert into Fruit values(3,'Banana',2500,3500,2200,2500);
insert into Fruit values(4,'Grape',1500,2500,1200,3500);
select * from Fruit

Row-to-column processing
select id, name ,'Q1' season, (select q1 from etl.fruit where id=t1.id) sales from etl.Fruit t1
union all
select id, name ,'Q2' season, (select q2 from etl.fruit where id=t1.id) sales from etl.Fruit t1
union all
select id, name ,'Q3' season, (select q3 from etl.fruit where id=t1.id) sales from etl.Fruit t1
union all
select id, name ,'Q4' season, (select q4 from etl.fruit where id=t1.id) sales from etl.Fruit t1
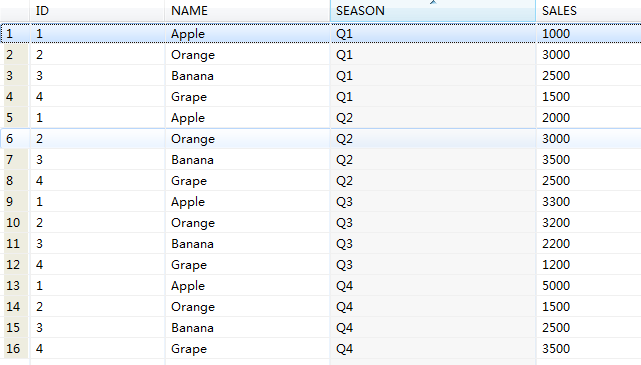
Because the grammar is not concise enough, Baidu uses the povit/unpovit function in oracle 11g and verifies it in db2. However, this function is not supported in DB2
select id,name,season,sales from etl.unpivot (sales for season in (q1, q2, q3, q4) );

So we can only deal with it in another way: referring to the following figure, note that values(1,2,3),(4,5,6) are row values, and the value character types in the corresponding columns of each row must be the same, otherwise errors will be reported.
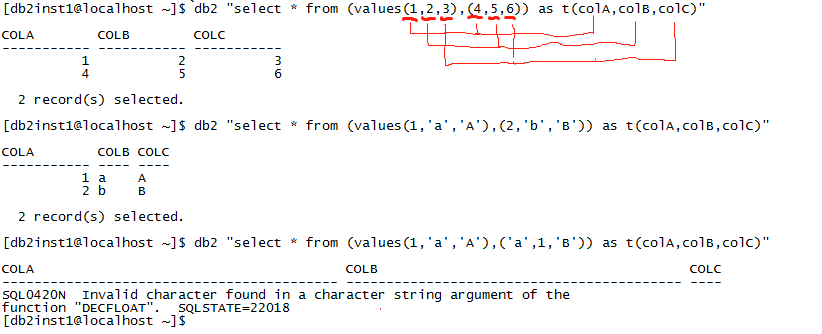
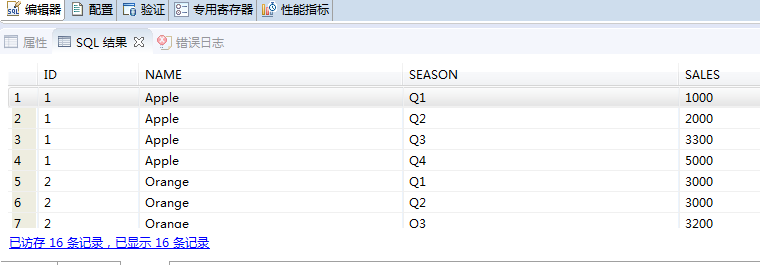
After understanding the method in the figure above, let's go back and convert the fruit sales table from rows to columns.
select t1.id,t1.name,t2.season,t2.sales
from etl.fruit t1,
table(values('Q1',t1.q1),('Q2',t1.q2),('Q3',t1.q3),('Q4',t1.q4)) as t2(season,sales);
Let's go back to the question raised in the background. ETL.JOB_SEQ is the dependency configuration table, JOB_NM is the task name, PRE_JOB is the pre-task name. There are hundreds of tasks in the actual development. If one of the task scripts is adjusted, the scripts that depend on this task need to be run again. So now we need to find all the scripts that depend on this task and display them in a column, insert the experimental data of the following cases.
CREATE TABLE ETL.JOB_SEQ(JOB_NM VARCHAR(50),PRE_JOB VARCHAR(50));
INSERT INTO ETL.JOB_SEQ VALUES('A1','A0');
INSERT INTO ETL.JOB_SEQ VALUES('A2','A1');
INSERT INTO ETL.JOB_SEQ VALUES('A3','A2');
INSERT INTO ETL.JOB_SEQ VALUES('A3','A0');
INSERT INTO ETL.JOB_SEQ VALUES('A4','A3');
INSERT INTO ETL.JOB_SEQ VALUES('A4','A0');
INSERT INTO ETL.JOB_SEQ VALUES('B0','A0');
INSERT INTO ETL.JOB_SEQ VALUES('B3','A3');

SELECT * FROM ETL.JOB_SEQ ;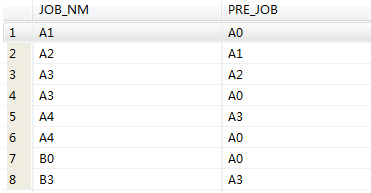
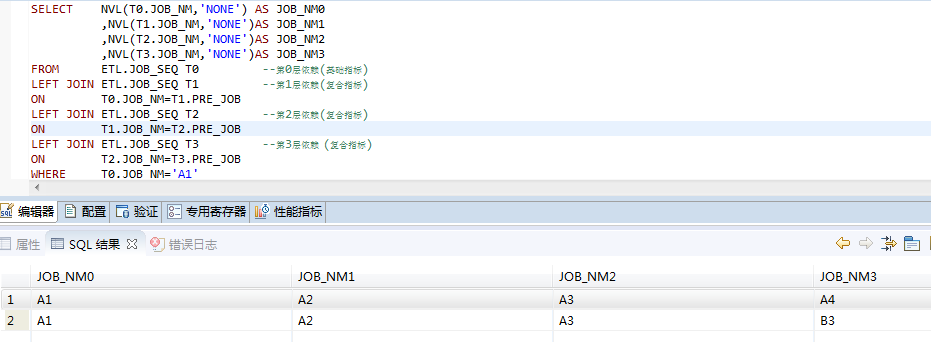
From this we can see that the downstream dependencies of A1 are A2, A2 is A3, A3 is A4 and B3. We will show all the hierarchical dependencies queried to the following column.
SELECT   DISTINCT T.JOB_NM
FROM
(
SELECT    NVL(T0.JOB_NM,'NONE') AS JOB_NM0
          ,NVL(T1.JOB_NM,'NONE')AS JOB_NM1
          ,NVL(T2.JOB_NM,'NONE')AS JOB_NM2
          ,NVL(T3.JOB_NM,'NONE')AS JOB_NM3
FROM      ETL.JOB_SEQ T0         --Layer 0 Dependence(Basic index)
LEFT JOIN ETL.JOB_SEQ T1         --Layer 1 Dependency(Composite index)
ON        T0.JOB_NM=T1.PRE_JOB
LEFT JOIN ETL.JOB_SEQ T2         --Layer 2 Dependency(Composite index)
ON        T1.JOB_NM=T2.PRE_JOB
LEFT JOIN ETL.JOB_SEQ T3         --Layer 3 Dependency  (Composite index)
ON        T2.JOB_NM=T3.PRE_JOB
WHERE     T0.JOB_NM='A1'
),
TABLE(VALUES(JOB_NM0),(JOB_NM1),(JOB_NM2),(JOB_NM3)) AS T(JOB_NM)
WHERE T.JOB_NM<>'NONE';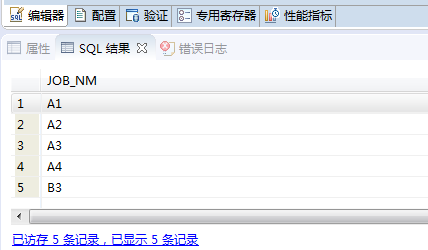
This is what we need to achieve. When we pass in the adjusted index code, we can find all the downstream index codes and run them back in batches.
UPDATE ETL.JOB_SEQ SET JOB_STS='WAITING' WHERE JOB_NM IN (exec_sql);
pivot column transitions
This is a common usage, decode function can be used to deal with, here do not do a specific description.
Reference Documents: 1. http://www.360doc.com/content/11/0315/10/16915_101249598.shtml