catalogue
Series Slicing and indexing of pandas
Reading external data from pandas
Common statistical methods of pandas
Import
Why learn pandas
numpy has been able to help us process data and solve our data analysis problems in combination with matplotlib. What is the purpose of pandas learning?
numpy can help us deal with numerical data, but that's not enough
Many times, in addition to numerical values, our data also includes strings and time series
For example, we get the data stored in the database through the crawler
For example, in the previous youtube example, in addition to values, there are also country information, video tag information, title information, etc
Therefore, numpy can help us deal with numerical values, but pandas can help us deal with other types of data in addition to dealing with numerical values (based on numpy)
What is pandas
pandas is an open source, BSD-licensed library providing high-performance, easy-to-use data structures and data analysis tools for the Python programming language.
Basic operation of pandas
Common data types of pandas
1.Series one-dimensional, tagged array
2.DataFrame, 2D, Series container
Creation of pandas Series
In [2]: import string

In [3]: import numpy as np

In [4]: import pandas as pd

In [5]: t=pd.Series(np.arange(10),index=list(string.ascii_uppercase[:10]))

In [6]: t
Out[6]:
A    0
B    1
C    2
D    3
E    4
F    5
G    6
H    7
I    8
J    9
dtype: int32

In [7]: type(t)
Out[7]: pandas.core.series.Series
Pay attention to the following questions:
What can PD. Series do and what types of data can be passed in to make it a series structure
What is index and where is it? What is index for our common database data or ndarray
How to assign an index to a set of data
In [9]: #Dictionary derivation creates a dictionary and a series through the dictionary. Note that the index is the key of the dictionary

In [10]: a={string.ascii_uppercase[i]:i for i in range(10)}

In [11]: a
Out[11]:
{'A': 0,
 'B': 1,
 'C': 2,
 'D': 3,
 'E': 4,
 'F': 5,
 'G': 6,
 'H': 7,
 'I': 8,
 'J': 9}
After making other indexes for them again, if they can correspond to each other, their values will be taken. If not, Nan will be returned
Why is the type float? pandas will automatically change the dtype type of series according to the data type
In [14]: pd.Series(a,index=list(string.ascii_uppercase[5:15]))
Out[14]:
F    5.0
G    6.0
H    7.0
I    8.0
J    9.0
K    NaN
L    NaN
M    NaN
N    NaN
O    NaN
dtype: float64

#After making other indexes for them again, if they can correspond to each other, their values will be taken. If not, Nan will be returned
#Why is the type float? pandas will automatically change the dtype type of series according to the data type
Series Slicing and indexing of pandas
In [15]: t
Out[15]:
A    0
B    1
C    2
D    3
E    4
F    5
G    6
H    7
I    8
J    9
dtype: int32

In [16]: t[2:10:2]
Out[16]:
C    2
E    4
G    6
I    8
dtype: int32

In [17]: t[2:10:2]  #  Index 2-10 in steps of 2
Out[17]:
C    2
E    4
G    6
I    8
dtype: int32

In [18]: t[1] #Value with index subscript 1
Out[18]: 1

In [20]: t[[2,3,6]] #Value with index subscript 2 3 6
Out[20]:
C    2
D    3
G    6
dtype: int32

In [21]: t[t>4]
Out[21]:
F    5
G    6
H    7
I    8
J    9
dtype: int32

In [22]: t["F"]  #Specifies that the index value is the value corresponding to F
Out[22]: 5

In [23]: t[["A","F","g"]]   #The specified index value is AFg. There are no corresponding values, so nan is returned
E:\ProgramData\Anaconda3\lib\site-packages\pandas\core\series.py:851: FutureWarning:
Passing list-likes to .loc or [] with any missing label will raise
KeyError in the future, you can use .reindex() as an alternative.

See the documentation here:
https://pandas.pydata.org/pandas-docs/stable/indexing.html#deprecate-loc-reindex-listlike
  return self.loc[key]
Out[23]:
A    0.0
F    5.0
g    NaN
dtype: float64
Slice: pass in start directly end or step length
Index: the serial number or index is directly passed in when a When there are multiple, the serial number or index list is passed in
For an unfamiliar series type, how do we know its index and specific value?
In [24]: t.index
Out[24]: Index(['A', 'B', 'C', 'D', 'E', 'F', 'G', 'H', 'I', 'J'], dtype='object')

In [25]: t.values
Out[25]: array([0, 1, 2, 3, 4, 5, 6, 7, 8, 9])

In [26]: type(t.index)
Out[26]: pandas.core.indexes.base.Index

In [27]: type(t.values)
Out[27]: numpy.ndarray
A Series object consists essentially of two numbers
An array constitutes the key (index, index) of the object, and an array constitutes the values of the object Key - > value
Many methods of ndarrary can be applied to series types, such as argmax and clip
series has a where method, but the result is different from ndarray
Reading external data from pandas
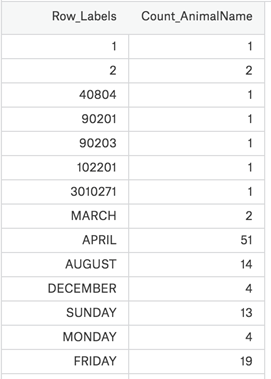
Now suppose we have a group of statistics about dog names, so what should we do to observe this group of data?
Data source: https://www.kaggle.com/new-york-city/nyc-dog-names/data
Our set of data is stored in csv, and we use PD. Read directly_ csv
import pandas as pd

#pandas reads files in csv
df = pd.read_csv("./dogNames2.csv")

print(df[(800<df["Count_AnimalName"])|(df["Count_AnimalName"]<1000)])
Output results
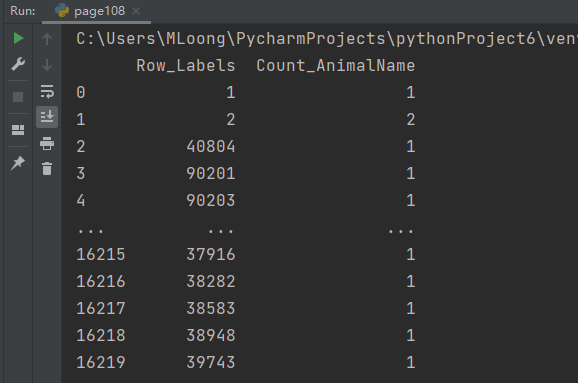
It is somewhat different from what we thought. We thought it would be a Series type, but it is a DataFrame. Next, let's understand this data type
However, there is another problem:
How do we use data in databases such as mysql or mongodb?
pd.read_sql(sql_sentence,connection)
So, what about mongodb?
DataFrame of pandas
DataFrame objects have both row and column indexes
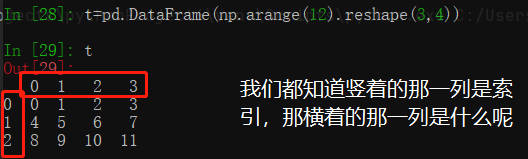
Row index indicates different rows. The horizontal index is called index, 0 axis, axis=0
Column index, columns with different table names, vertical index, called columns, 1 axis, axis=1
So here comes the question...:
1. What is the relationship between dataframe and Series?
2. If series can import a dictionary, can DataFrame import a dictionary as data? So can mongodb data be passed in like this?
3. What can we do for a dataframe type with both row index and column index
Underlying properties of DataFrame
df.shape # rows and columns df.dtype # column data type
df.ndim # data dimension df.index # row index
Df.colonies # column index df.values # object value, 2D array of ndarray
In [32]: t
Out[32]:
   W  X   Y   Z
A  0  1   2   3
B  4  5   6   7
C  8  9  10  11

In [33]: t.shape
Out[33]: (3, 4)

In [34]: t.dtypes #Column data type
Out[34]:
W    int32
X    int32
Y    int32
Z    int32
dtype: object

In [35]: t.ndim #Data dimension
Out[35]: 2

In [36]: t.index #Row index
Out[36]: Index(['A', 'B', 'C'], dtype='object')

In [37]: t.index #Column index
Out[37]: Index(['A', 'B', 'C'], dtype='object')

In [38]: t.values #Object value, 2D array of ndarray
Out[38]:
array([[ 0,  1,  2,  3],
       [ 4,  5,  6,  7],
       [ 8,  9, 10, 11]])
Query the overall situation of DataFrame
t.head(2) # displays the header lines, with 5 lines by default
t.tail(2) ## Display the last few lines, 5 lines by default
t.info() # Overview of related information: number of rows, number of columns, column index, number of non null values of columns, column type, memory occupation
t.describe() # fast comprehensive statistical results: count, mean, standard deviation, maximum value, quarter number and minimum value
In [39]: t.head(2) #Display the first few lines, 5 lines by default
Out[39]:
   W  X  Y  Z
A  0  1  2  3
B  4  5  6  7

In [40]: t.tail(2)  ##Display the last few lines, 5 lines by default
Out[40]:
   W  X   Y   Z
B  4  5   6   7
C  8  9  10  11

In [41]: t.info()   #Overview of related information: number of rows, number of columns, column index, number of non null values of columns, column type, memory occupation
<class 'pandas.core.frame.DataFrame'>
Index: 3 entries, A to C
Data columns (total 4 columns):
W    3 non-null int32
X    3 non-null int32
Y    3 non-null int32
Z    3 non-null int32
dtypes: int32(4)
memory usage: 72.0+ bytes

In [42]: t.describe() #Fast comprehensive statistical results: count, mean, standard deviation, maximum value, quarter number and minimum value
Out[42]:
         W    X     Y     Z
count  3.0  3.0   3.0   3.0
mean   4.0  5.0   6.0   7.0
std    4.0  4.0   4.0   4.0
min    0.0  1.0   2.0   3.0
25%    2.0  3.0   4.0   5.0
50%    4.0  5.0   6.0   7.0
75%    6.0  7.0   8.0   9.0
max    8.0  9.0  10.0  11.0
Many students must want to know what are the top names used most frequently?
df.sort_values(by="Count_AnimalName",ascending=False)
In [43]: t
Out[43]:
   W  X   Y   Z
A  0  1   2   3
B  4  5   6   7
C  8  9  10  11

#Sort by "Y" in descending order
In [44]: t = t.sort_values(by="Y",ascending=False)

In [45]: t
Out[45]:
   W  X   Y   Z
C  8  9  10  11
B  4  5   6   7
A  0  1   2   3

In [46]: t[:2]
Out[46]:
   W  X   Y   Z
C  8  9  10  11
B  4  5   6   7

In [47]: t["Y"]
Out[47]:
C    10
B     6
A     2
Name: Y, dtype: int32
Row or column of pandas
Just now we know how to sort the data according to a certain row or column. Now we want to study the data with the top 100 usage times separately. What should we do?
df_sorted = df.sort_values(by="Count_AnimalName")
df_sorted[:100]
In [48]: t_sorted = t.sort_values(by="Y")

In [50]: t_sorted
Out[50]:
   W  X   Y   Z
A  0  1   2   3
B  4  5   6   7
C  8  9  10  11

In [49]: t_sorted[:2]
Out[49]:
   W  X  Y  Z
A  0  1  2  3
B  4  5  6  7
How do we choose a column? df[" Count_AnimalName "]
What if we choose row and column at the same time? df[:100][" Count_AnimalName "]
In [52]: t[:2]["Y"]  #Intersection of the first 2 rows and the "Y" column
Out[52]:
C    10
B     6
Name: Y, dtype: int32
loc of pandas
There are more selection methods optimized by pandas:
1.df.loc index row data by tag
2.df.iloc get row data by location
In [59]: t
Out[59]:
   W  X   Y   Z
A  0  1   2   3
B  4  5   6   7
C  8  9  10  11

In [60]:  t.loc["A","Y"]
Out[60]: 2

In [61]:  t.loc["A",["W","Z"]]
Out[61]:
W    0
Z    3
Name: A, dtype: int32

In [62]: type(t.loc["A",["W","Z"]])
Out[62]: pandas.core.series.Series
Select multiple rows and columns for the interval
In [64]: t.loc[["A","C"],["W","Z"]]
Out[64]:
   W   Z
A  0   3
C  8  11

In [65]: t.loc["A":,["W","Z"]]
Out[65]:
   W   Z
A  0   3
B  4   7
C  8  11
The colon is closed in loc, that is, the data behind the colon will be selected
In [67]: t.loc["A":"C",["W","Z"]]
Out[67]:
   W   Z
A  0   3
B  4   7
C  8  11
iloc of pandas
In [68]: t.iloc[1:3,[0,3]]  #
Out[68]:
   W   Z
B  4   7
C  8  11

In [69]: t.iloc[1:3,0:3]
Out[69]:
   W  X   Y
B  4  5   6
C  8  9  10
The process of assigning and changing data:
In [70]: t
Out[70]:
   W  X   Y   Z
A  0  1   2   3
B  4  5   6   7
C  8  9  10  11

In [71]:  t.loc["A","Y"]=100

In [72]: t
Out[72]:
   W  X    Y   Z
A  0  1  100   3
B  4  5    6   7
C  8  9   10  11

In [73]: t.iloc[1:3,0:3] =200

In [74]: t
Out[74]:
     W    X    Y   Z
A    0    1  100   3
B  200  200  200   7
C  200  200  200  11
Boolean index of pandas
Back to the question of dog names before, if we want to find the names of all dogs that have been used more than 800 times, what should we choose
import pandas as pd

#pandas reads files in csv
df = pd.read_csv("./dogNames2.csv")

#print(df[(800<df["Count_AnimalName"])|(df["Count_AnimalName"]<1000)])
print(df[df["Count_AnimalName"]>800])
Output results
C:\Users\MLoong\PycharmProjects\pythonProject6\venv\Scripts\python.exe E:/Data analyst learning/21-Data analysis data-new/Data analysis data/day04/code/page108.py
      Row_Labels  Count_AnimalName
1156       BELLA              1195
2660     CHARLIE               856
3251        COCO               852
9140         MAX              1153
12368      ROCKY               823
Back to the question of dog names before, if we want to find all dog names that have been used more than 700 times and the length of the name string is greater than 4, how should we choose?
import pandas as pd

#pandas reads files in csv
df = pd.read_csv("./dogNames2.csv")

print(df[(df["Count_AnimalName"]>700)&(df["Row_Labels"].str.len()>4)])
Join query symbol
- & And
- | or
Note: different conditions need to be enclosed in parentheses
String method of pandas
1,cat() Splice string
In [76]: pd.Series(['a','b','c']).str.cat((['A','B','C']),sep=',')
Out[76]:
0    a,A
1    b,B
2    c,C
dtype: object
2,split() Split string
In [79]: s = pd.Series(['a_b_c','c_d_e',np.nan,'f_g_h'])

In [80]: s.str.split('_')
Out[80]:
0    [a, b, c]
1    [c, d, e]
2          NaN
3    [f, g, h]
dtype: object
3. get() gets the string at the specified location
In [83]: s.str.get(2)
Out[83]:
0      b
1      d
2    NaN
3      g
dtype: object
4,join() Each character is spliced with a string of points, which is not commonly used
5. Does contains() contain an expression
6. replace() replace
7. repeat() repeat
8. Pad (left and right)
9,center() Intermediate supplement
10,ljust() Right complement
11,rjust() Left complement
12. zfill() fill 0 on the left
13. wrap() adds a carriage return symbol at the specified position
14,slice() Cut the string at the start and end of a given point
15,slice_replace() Replaces the character at the specified position with the given string
16. count() counts the number of occurrences of a given word
In [84]: s.str.count("a")
Out[84]:
0    1.0
1    0.0
2    NaN
3    0.0
dtype: float64
17. Startswitch() determines whether to start with the given string
18,endswith() Determines whether to end with the given string
19,findall() Find all characters that match the regular expression and return them as an array
20. match() detects whether all strings or expressions match the points
28,lower() All lowercase
29,upper() All caps
30,find() Starting from the left, find the location of a given string
data processing
Processing of missing data
Look at the following set of data
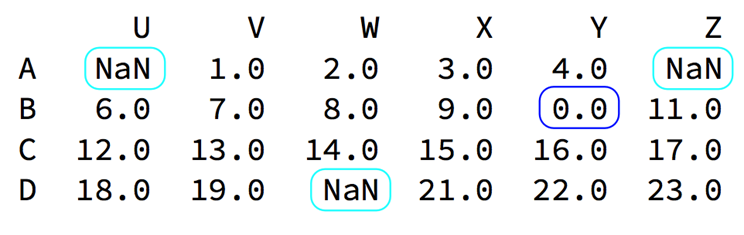
There are usually two cases of missing data:
One is empty, None, etc. in pandas, it is Nan (the same as np.nan)
The other is that we set it to 0 in the blue box
How do we handle NaN data in numpy?
It's very easy for us to handle in pandas
Judge whether the data is NaN: pd.isnull(df),pd.notnull(df)
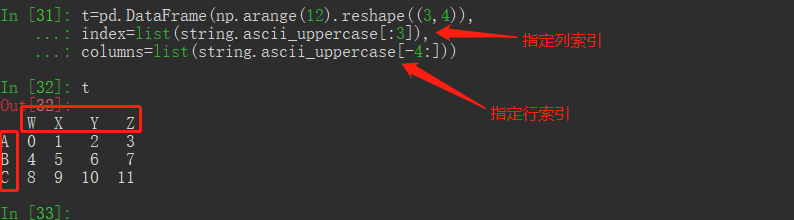
In [106]: t=pd.DataFrame(np.arange(12).reshape((3,4)),
     ...: index=list(string.ascii_uppercase[:3]),
     ...: columns=list(string.ascii_uppercase[-4:]))

In [107]: t
Out[107]:
   W  X   Y   Z
A  0  1   2   3
B  4  5   6   7
C  8  9  10  11

In [108]: t1=t

In [109]: t.iloc[:2,[2,3]]=np.nan

In [110]: t
Out[110]:
   W  X     Y     Z
A  0  1   NaN   NaN
B  4  5   NaN   NaN
C  8  9  10.0  11.0

In [111]: pd.isnull(t)   #Judged as nan
Out[111]:
       W      X      Y      Z
A  False  False   True   True
B  False  False   True   True
C  False  False  False  False


In [113]: pd.notnull(t)  #Judged not to be nan
Out[113]:
      W     X      Y      Z
A  True  True  False  False
B  True  True  False  False
C  True  True   True   True

In [115]: t[pd.notnull(t["Y"])]
Out[115]:
   W  X     Y     Z
C  8  9  10.0  11.0
Processing method 1: delete the row and column dropna of NaN (axis = 0, how ='Any ', inplace = false)
Processing method 2: fill data, t.fillna (t.mean()), t.fillna (t.median()), t.fillna (0)
In [116]: t.dropna(axis=0)
Out[116]:
   W  X     Y     Z
C  8  9  10.0  11.0

In [117]: t.dropna(axis=0,how="all")  # Deletion of nan in any row
Out[117]:
   W  X     Y     Z
A  0  1   NaN   NaN
B  4  5   NaN   NaN
C  8  9  10.0  11.0

In [118]: t.dropna(axis=0,how="any")  #Delete as long as there is nan
Out[118]:
   W  X     Y     Z
C  8  9  10.0  11.0

In [120]: t1.dropna(axis=0,how="any",inplace=True)  #inplaced is modified immediately

In [121]: t1
Out[121]:
   W  X     Y     Z
C  8  9  10.0  11.0
In [131]: t
Out[131]:
   W  X     Y     Z
A  0  1   NaN   NaN
B  4  5   NaN   NaN
C  8  9  10.0  11.0

In [132]: t.fillna(t.mean())  #Mean filling
Out[132]:
   W  X     Y     Z
A  0  1  10.0  11.0
B  4  5  10.0  11.0
C  8  9  10.0  11.0

In [133]: t
Out[133]:
   W  X     Y     Z
A  0  1   NaN   NaN
B  4  5   NaN   NaN
C  8  9  10.0  11.0

In [134]: t.fillna(t.median())  #Median fill
Out[134]:
   W  X     Y     Z
A  0  1  10.0  11.0
B  4  5  10.0  11.0
C  8  9  10.0  11.0

In [135]: t.fillna(0)   #0 fill
Out[135]:
   W  X     Y     Z
A  0  1   0.0   0.0
B  4  5   0.0   0.0
C  8  9  10.0  11.0
Data processed as 0: t[t==0]=np.nan
In [136]: t4=t.fillna(0)

In [137]: t4
Out[137]:
   W  X     Y     Z
A  0  1   0.0   0.0
B  4  5   0.0   0.0
C  8  9  10.0  11.0

In [138]: t4[t4==0]=np.nan  #Change the value of 0 to nan

In [139]: t4
Out[139]:
     W  X     Y     Z
A  NaN  1   NaN   NaN
B  4.0  5   NaN   NaN
C  8.0  9  10.0  11.0
Of course, not every time the data is 0, it needs to be processed
When calculating the average value, nan does not participate in the calculation, but 0 will
Common statistical methods of pandas
Suppose we have a set of data of 1000 most popular films from 2006 to 2016. We want to know the average score of these film data, the number of directors and other information. How should we obtain it?
Data source: https://www.kaggle.com/damianpanek/sunday-eda/data
import pandas as pd
import numpy as np

file_path = "IMDB-Movie-Data.csv"
df = pd.read_csv(file_path)

# print(df.info())
print("-------Print head 1 line of data------")
print(df.head(1))

print("-------Get average score------")
print(df["Rating"].mean())


# print(len(set(df["Director"].tolist())))
print("-------Number of directors required------")
print(len(df["Director"].unique()))

print("-------Get the number of actors------")
temp_actors_list = df["Actors"].str.split(", ").tolist()
actors_list = [i for j in temp_actors_list for i in j]
actors_num = len(set(actors_list))
print(actors_num)
Output results
   Rank                    Title  ... Revenue (Millions) Metascore  #
0     1  Guardians of the Galaxy  ...             333.13      76.0

[1 rows x 12 columns]
-------Get average score------
6.723199999999999
-------Number of directors required------
644
-------Get the number of actors------
2015
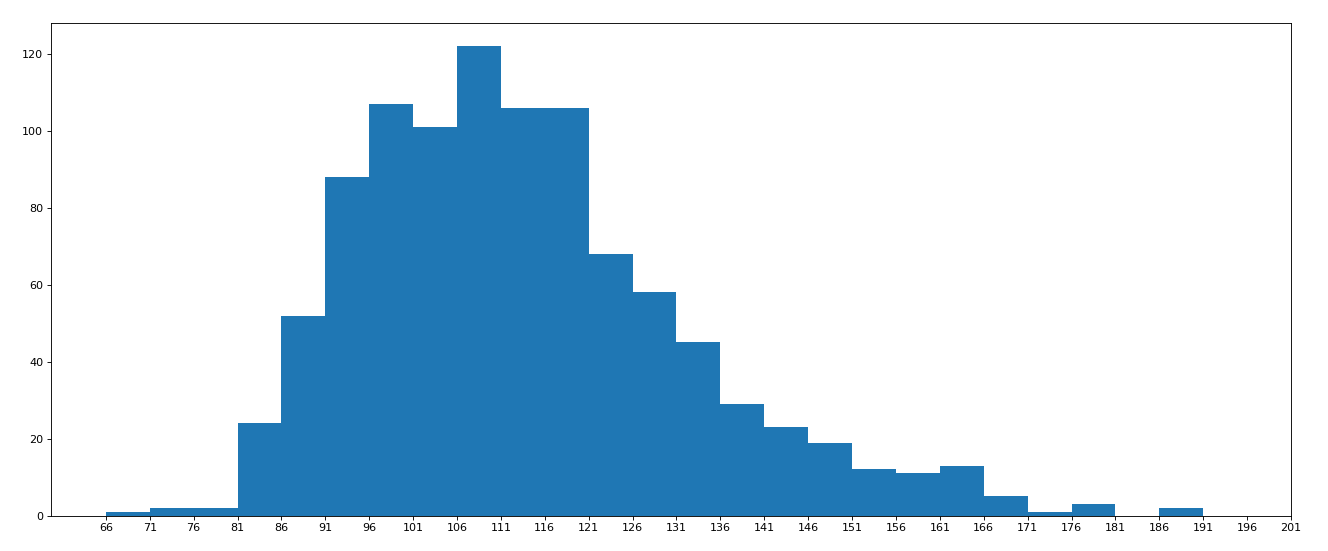
For this group of movie data, if we want to rate the distribution of runtime, how should we present the data?
# coding=utf-8
import pandas as pd
from matplotlib import pyplot as plt
file_path = "./IMDB-Movie-Data.csv"

df = pd.read_csv(file_path)
# print(df.head(1))
# print(df.info())

#rating,runtime distribution
#Select graph, histogram
#Prepare data
runtime_data = df["Runtime (Minutes)"].values

max_runtime = runtime_data.max()
min_runtime = runtime_data.min()

#Number of calculation groups
print(max_runtime-min_runtime)
num_bin = (max_runtime-min_runtime)//5
print(num_bin)


#Sets the size of the drawing
plt.figure(figsize=(20,8),dpi=80)
plt.hist(runtime_data,num_bin)

_x = [min_runtime]
i = min_runtime
while i<=max_runtime+5:
    i = i+5
    _x.append(i)

plt.xticks(_x)

plt.show()
Operation results