Data analysis case sharing, for learning and use, data volume is relatively small, data source for the hook, July 8th, area, data analysis post, is so little, yes.
demand
The crawled data were cleaned and further analyzed by python.
tool
python3,pycharm
Data cleaning
First analyze the target file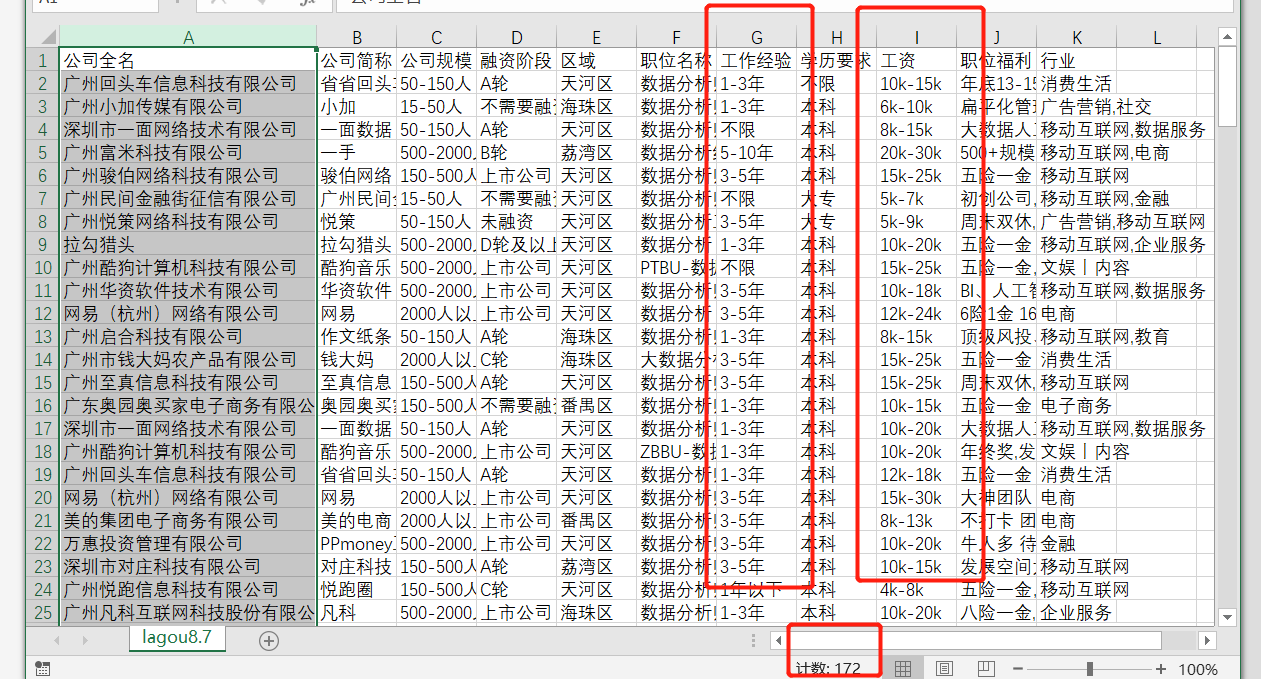
There are 172 pieces of data.
Need to deal with
Work experience: unlimited set to 0, example: 1-3 years to take (1+3)/2 that is 1.5 years
Wage: According to the actual situation, the first 25% of the interval is more reasonable, for example: 10K-15K, take 11.25K.
Job content includes interns'data, which is of less reference value and should be removed.
import pandas as pd
df = pd.read_csv('lagou8.4jobs.csv',encoding='utf-8-sig')
#print(df.describe())
#common175Items containing internship information need to be cleaned out
df.drop(df[df['Job title'].str.contains('Internship')].index,inplace=True)
#print(df.describe())
#67strip
pattern = '\d+'         #Regular expressions get all numbers
df['Hands-on background'] = df['Hands-on background'].str.findall(pattern)
#print(df['Hands-on background'])
avg_work_year = []
for i in df['Hands-on background']:
    if len(i) == 0:
        avg_work_year.append(0)
    else:
        num = [int(j) for j in i]
        avg = sum(num)/2
        avg_work_year.append(avg)
#print(avg_work_year)
df['Hands-on background'] = avg_work_year

df['wages'] = df['wages'].str.findall(pattern)
#print(df['wages'])
avg_salary = []
for i in df['wages']:
    num = [int(j) for j in i]
    #print(num)
    avg = num[0]+(num[1]-num[0])/4
    #print(avg)
    avg_salary.append(avg)
df['wages'] = avg_salary

df.to_csv('clear_data.csv', index = False,encoding='utf-8-sig')
End of cleaning
Data analysis
1. Basic Data Information
print(df.describe())
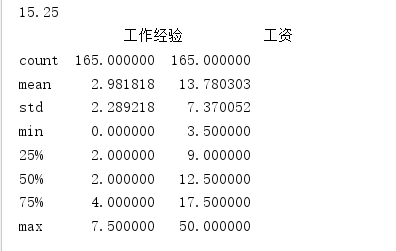
Total 165 data
The average requirement for work experience is three years.
Average salary level up to 13K
Standard deviation: 2.28
2. Number of company Recruitment Information
Here's a simple application of pandas, which is a bit long to understand the code.
import pandas as pd
df = pd.read_csv(r'D:\python\xiangmu\lagou\lagou8.7.csv',encoding='utf-8-sig')
compant_data = df.groupby('Full name of company',as_index=False)			#Grouping
compant_data =compant_data.count()[['Full name of company','Job title']]	#Extraction number
compant_data =compant_data.sort_values('Job title', ascending=False)	#sort
print(compant_data.head(10))		#Top Ten Companies
Output result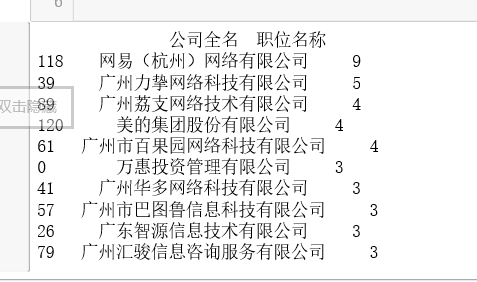
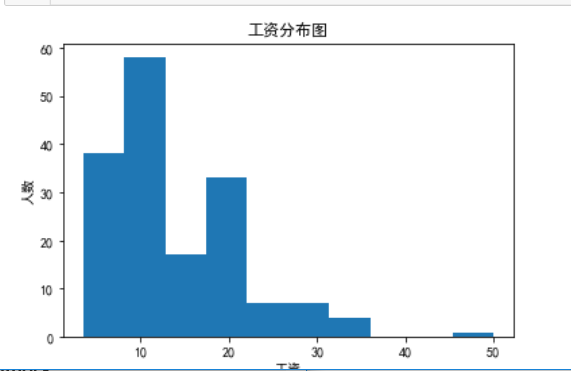
3. Histogram
Histogram of Wage Distribution
import matplotlib.pyplot as plt
plt.rcParams['font.sans-serif'] = ['SimHei']
plt.hist(df['wages'])
plt.title('Wage Distribution Map')
plt.xlabel('wages')
plt.ylabel('Number')
plt.show()