This example completes simple mathematical statistics work by simulating some random numbers as an experience of later data analysis
Random walk: randomly generate 1 or - 1 random number to imitate a person's advance or retreat
In this environment, some statistical work is carried out
Random walk
- Do some preparations for the homepage
import numpy as np                  # Import random number library

# Frequency of stroll
num = 1000
- Generate some random numbers needed
# n walks are generated, and the data is 0 or 1
draws = np.random.randint(0, 2, size=num)
# Replace the part with data 0 with - 1
steps = np.where(draws>0, 1, -1)
# Track by accumulation
walk = steps.cumsum()
# Output footstep record
print('Footprints:{}'.format(walk))
'''
[-1  0  1  0  1  2  1  0 -1  0 -1  0 -1  0 -1 -2 -1 -2 -1  0  1  2  3  2
  1  0  1  2  1  0 ... 67 68 67 68 67 68]
 '''
- Count the longest distance forward and backward
# Count the maximum distance of forward and backward in the process of walking
max_y = walk.max()
max_x = walk.argmax()
print('stay{}In the walk, the{}The furthest distance to step forward:{}'.format(num,max_x,max_y))
'''Step 909 of the 1000 walks: 72'''
min_y = walk.min()
min_x = walk.argmin()
print('stay{}In the walk, the{}Step back the farthest distance:{}'.format(num,min_x,min_y))
'''Step 15 of the 1000 walks back the farthest distance:-2'''
- Statistics of data meeting certain conditions
# Index with a distance of 30 from the origin during the statistical walk
greater_or_equal_30 = np.abs(walk)>=30
print('stay{}The total number of walks over 30 is:{}'.format(num,greater_or_equal_30.sum()))
'''The total number of walks over 30 in 1000 is: 413'''
# Index first reached 30
first_30 = greater_or_equal_30.argmax()
print('stay{}Index with the first distance more than 30 in the walk:{}'.format(num,first_30))
'''Index of first distance over 30 in 1000 walks: 551'''
value = np.where(greater_or_equal_30==True)
print('Index over 30 in 1000 walks:{}'.format(value))
'''
//Index over 30 in 1000 walks: (array ([551, 552, 553, 563, 564, 565, 567, 568, 569, 575, 576, 577, 578,... 970, 971, 972, 973, 974, 975, 976, 977, 978, 979, 981, 982, 983, 984, 985, 986, 987, 988, 989990, 991, 992, 993, 994, 996, 997, 998, 999])
'''
If the above data is too ugly, we can use matplotlib to draw the graph to make the data more intuitive
- Import the library first. Please install it if there is no library
python2:
pip install matplotlib
python3:
pip3 install matplotlib
Drawing graphics
# Import
import matplotlib.pyplot as plt     # Drawing library
# Drawing related figures
x = np.linspace(0, 1000, num=1000)
y1 = walk
plt.figure()
plt.title('random walk')
# Draw the footprints of walking
plt.plot(x, y1, color='yellow', linewidth=1, label='walk step')
y2 = np.ones(1000)*30
y3 = -y2
# Draw + - 30 lines
plt.plot(x, y2, color='r', linewidth=1, linestyle='--', label='+30')
plt.plot(x, y3, color='g', linewidth=1, linestyle='--', label='-30')
# Draw keys
plt.scatter([max_x,min_x,first_30], [max_y,min_y,walk[first_30]], s=30, color=['r','g','b'])
# Add annotation
# Maximum distance coordinate
plt.annotate(
    'max:({},{})'.format(max_x,max_y),
    xy = (max_x,max_y),
    xycoords = 'data',
    xytext = (-20, +20),
    textcoords='offset points',
    fontsize = 8,
    arrowprops=dict(arrowstyle='->', connectionstyle="arc3,rad=.2")
)
# Minimum distance coordinate
plt.annotate(
    'min:({},{})'.format(min_x,min_y),
    xy = (min_x,min_y),
    xycoords = 'data',
    xytext = (-20, +20),
    textcoords='offset points',
    fontsize = 8,
    arrowprops=dict(arrowstyle='->', connectionstyle="arc3,rad=.2")
)
# Coordinates of the first 30 distance
if walk[first_30]==30:
    plt.annotate(
        'first arrive to 30:({},{})'.format(first_30, walk[first_30]),
        xy=(first_30, walk[first_30]),
        xycoords='data',
        xytext=(-20, +20),
        textcoords='offset points',
        fontsize=8,
        arrowprops=dict(arrowstyle='->', connectionstyle="arc3,rad=.2")
    )

# Legend
plt.legend(loc='best')
# Display image
plt.show()

random walk
Multiple random walks
# To simulate multiple random walks, 15 sets of random numbers are generated here
nwalks = 15
nsteps = 1000
# Only slightly modify the parameter size
draws = np.random.randint(0, 2, size=(nwalks, nsteps))
steps = np.where(draws>0, 1, -1)
walks = steps.cumsum(axis=1)    # Lateral accumulation
- Statistics related data
# The longest distance
max_distance = walks.max(axis=1)
print('{}In the group of random walking, the farthest distance was:{}'.format(nwalks,max_distance))

'''15 In the group of random walking, the farthest distance was:[26 32 24 44 36 65 40 33 46 74 31 25 28 43 48]'''

# More than 30 from the origin
values = np.abs(walks) >= 30
# Whether there is a distance of more than 30 in each group's random walk
hits30 = np.any(values, axis=1)  # Horizontal search
print('{}Group random walk, total{}Group with a distance of more than 30, specifically:{}'.format(nwalks,hits30.sum(),hits30))

'''15 In group A, there were 11 groups with a distance of more than 30[False  True False  True  True  True  True  True  True  True  True False
 False  True  True]'''

# In these arrays with a distance of more than 30, the index moved to 30 for the first time
value = (np.abs(walks[hits30]) >= 30).argmax(axis=1)
value_mean = np.mean(value)
print('{}In the group random walk, the index moved to 30 for the first time is:{},Average demand{}Secondary mobility'.format(nwalks,value,np.int(value_mean)))

'''15 In the group random walk, the index moved to 30 for the first time is:[813 321 143 269 385 577 771 251 843 911 743],547 moves on average'''
- Draw a graph and count the longest distance
# mean value
distance_mean = max_distance.mean()
# Greater than mean
greater_mean = np.where(max_distance>distance_mean, max_distance, 0)
# Less than mean
smaller_mean = np.where(max_distance<=distance_mean, max_distance, 0)

plt.figure(num=2)
plt.title('random walk')
x = np.arange(nwalks)
# Draw histogram
l1 = plt.bar(x, greater_mean, color='r')
l2 = plt.bar(x, smaller_mean, color='g')
# Drawing data
for x0, y0 in zip(x,max_distance):
    plt.text(x0, y0, '{}'.format(y0), ha='center', va='bottom', fontdict={'size': 8})
# Draw moving average
plt.plot(x, np.ones(nwalks)*distance_mean, color='b', linestyle='--')
# Draw 30 lines
plt.plot(x, np.ones(nwalks)*30, color='y', linestyle='--')
# Add notes
plt.text(-0.5, distance_mean, 'mean:{:.2f}'.format(distance_mean), ha='right', fontdict={'size': 8})

# Set legend
plt.legend(handles=[l1, l2], labels=['greater mean','smaller mean'], loc='best')
# Set axis scale format
plt.xticks(x)
plt.show()
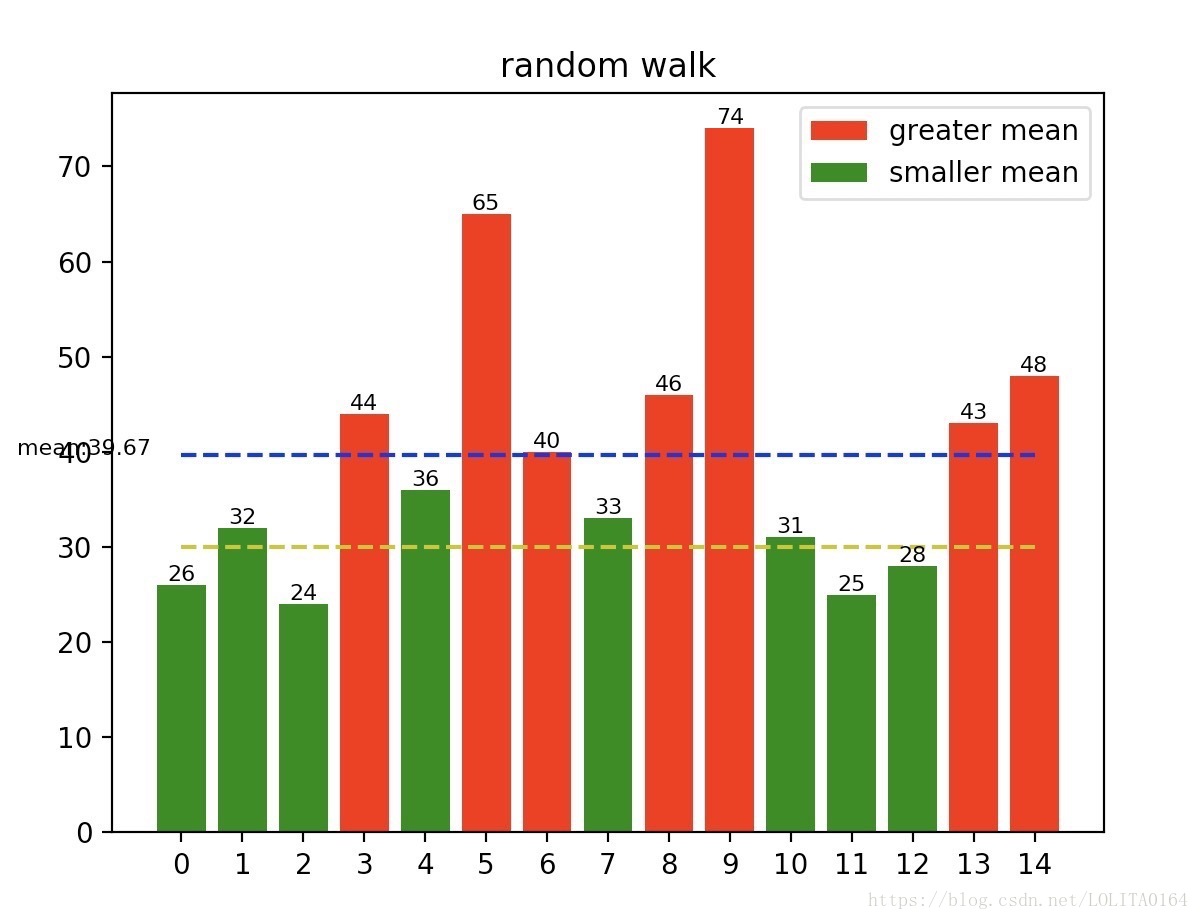
Longest distance statistics
The above is a simple application of random walk. For more data analysis, readers can freely play;
If you want to learn more about the use of matplotlib library, please follow the update later.