Through this project, learners have the opportunity to experience the whole process of data analysis, from data collection to data cleaning and analysis, and finally to visualize the analysis.
The data comes from Twitter account'We Rate Dogs'which ratings people's pet dogs in a humorous way. These scores are usually denominated by 10. But the molecule is generally greater than 10:11/10, 12/10, 13/10, so it can make most dogs score higher than 10.
1. Gathering Data
We have three data set files
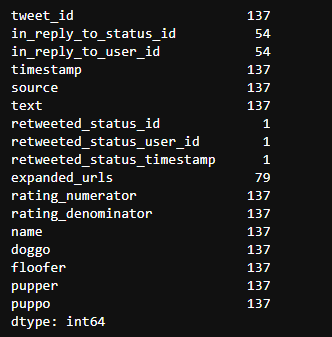
- The main data of twitter_archive_enhanced WeRateDogs twitter, from 2015 to 2017
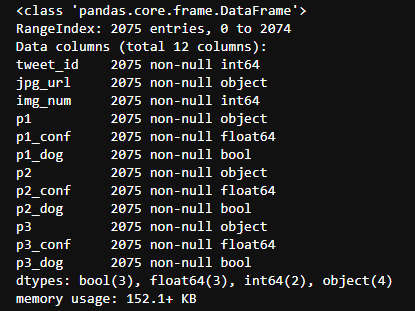
- RESULTS OF IMAGE MACHINE LEARNING ALGORITHM FOR image_archive_master WeRateDogs twitter
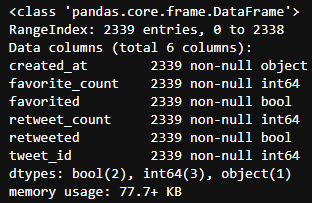
- Additional twitter data sets for tweet_data, including the number of forwards per tweet, the number of collections, etc.
# Import related Toolkits
import numpy as np
import pandas as pd
import requests
import json
import matplotlib.pyplot as plt
import seaborn as sns
plt.style.use('ggplot')
%matplotlib inline

plt.rcParams['font.sans-serif']=['SimHei']
plt.rcParams['axes.unicode_minus']=False # Display negative number
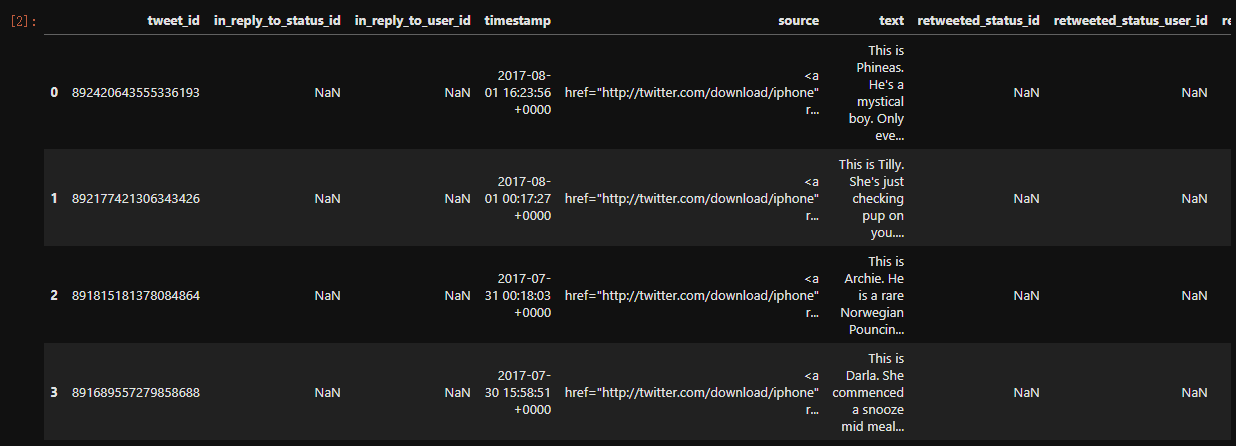
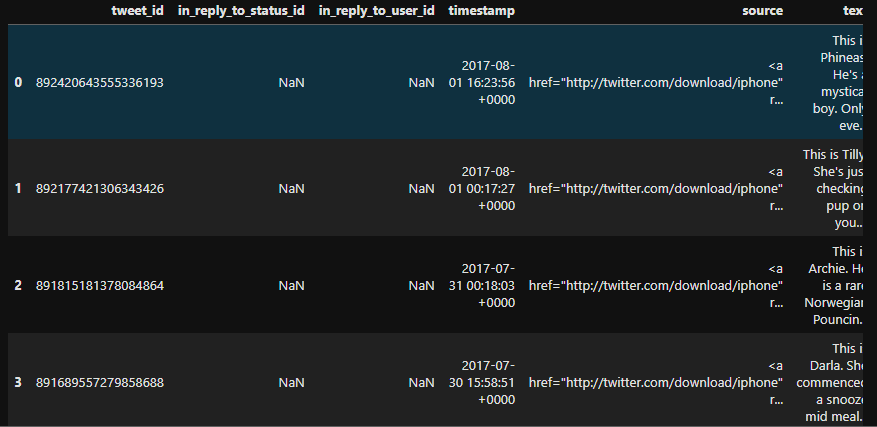
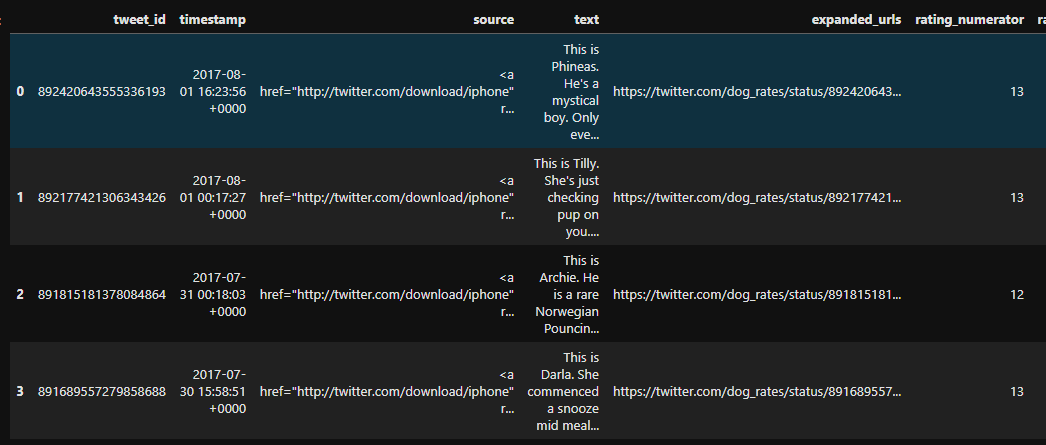
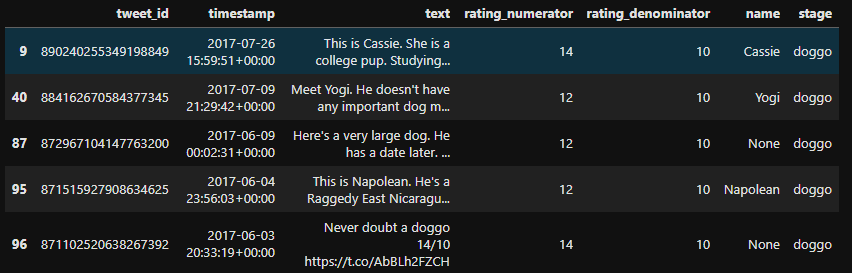
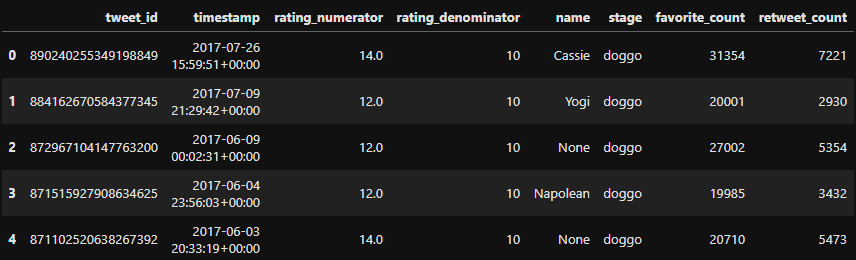
twitter_df = pd.read_csv('../data/twitter-archive-enhanced.csv')
twitter_df.head()
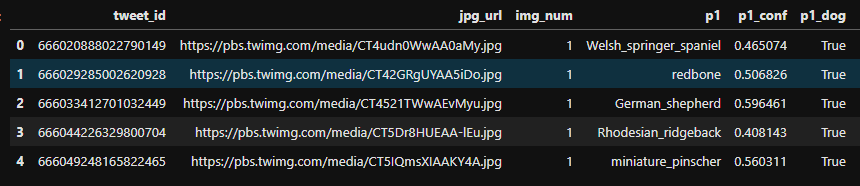
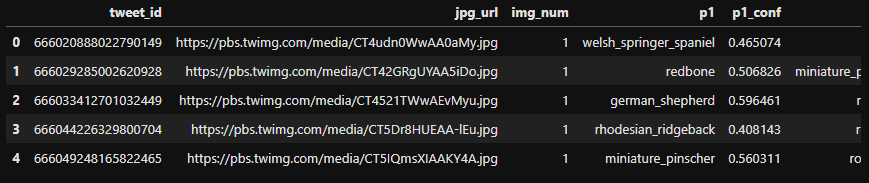
twi_pred_df = pd.read_csv('.../data/tweet-predictions.tsv',sep='\t')
twi_pred_df.head()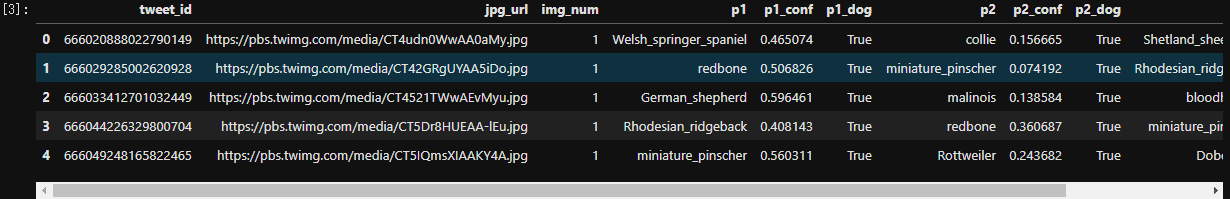
with open('../data/tweet_data.txt','r') as f:
data = json.load(f)
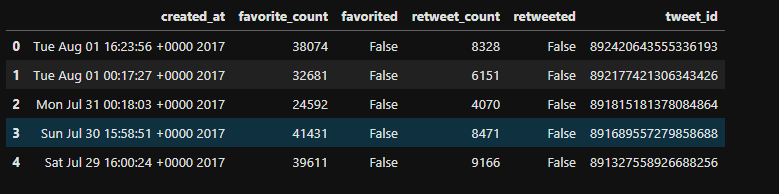
scrapped_df = pd.DataFrame(data)
scrapped_df.head()
2. Assessing The Data
Our three data frames are twitter_df, twi_pred_df, scrapped_df
1.
twitter_df['in_reply_to_status_id'].count()
# Output 78
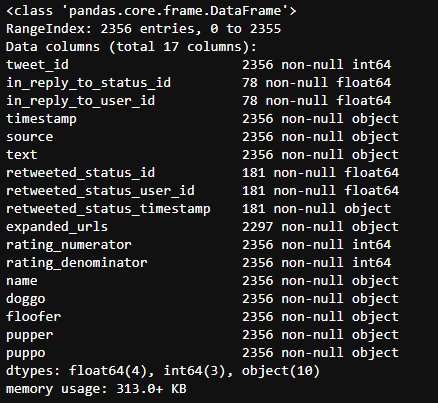
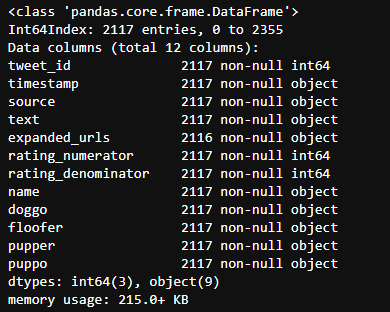
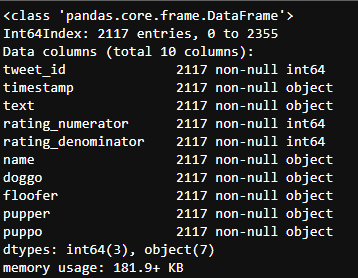
twitter_df.info()
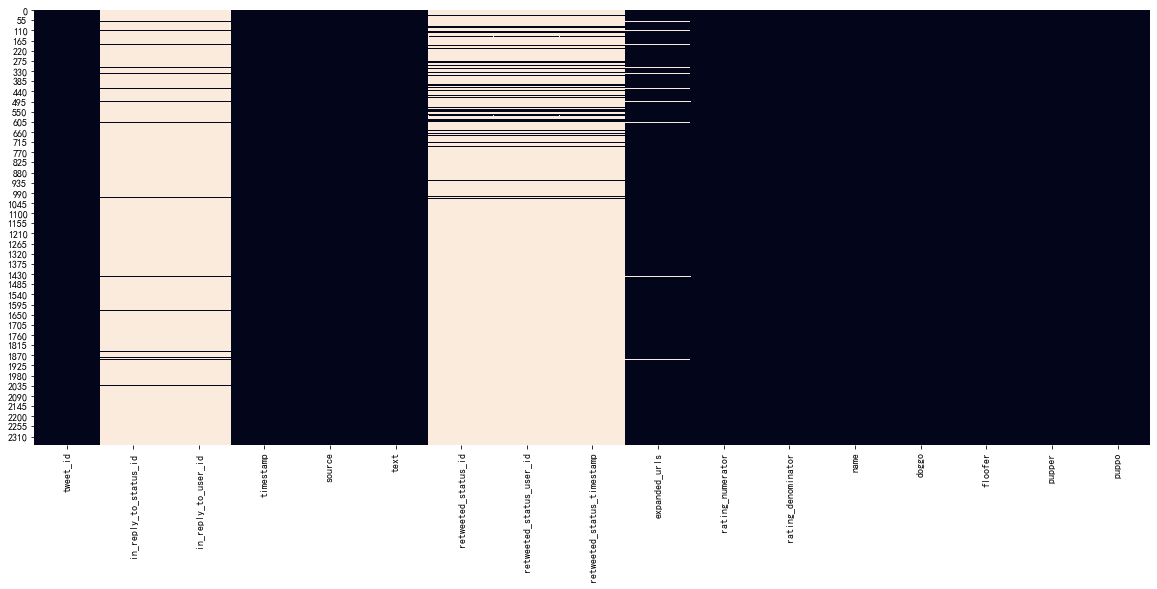
plt.figure(figsize=(20,8))
sns.heatmap(twitter_df.isnull(), cbar=False)
plt.show()
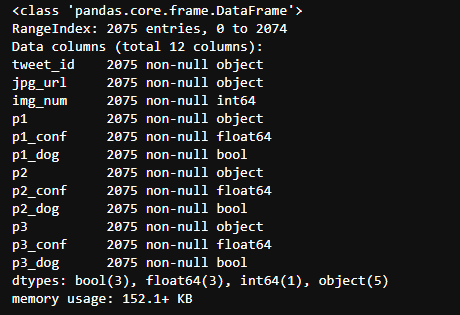
twi_pred_df.info()
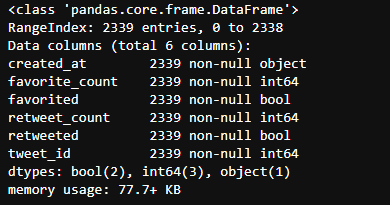
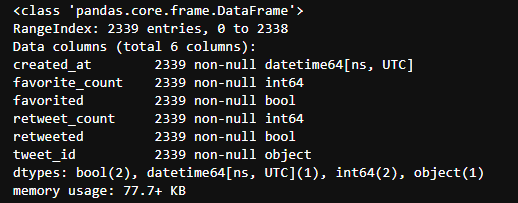
scrapped_df.info()
- These are large data sets, so we can clearly see some problems that retweeted in twitter_df needs to be deleted.
- Two columns in twitter_df are less than 100 rows, and there are too many missing values that need to be deleted.
- The number of rows in the three data boxes is different, 2342 in scrapped_df, 2075 in twi_pred_df and 2356 in twitter_df, so internal connections are needed.
Through visual analysis of missing values thermograms, we can see that source and expanded_urls should be deleted, because they contain data that we do not need, and all URLs are unique. doggo, floofer, pupper, puppo represent the four phases of a dog, which can be combined into one column.
2.
twitter_df[twitter_df['expanded_urls'].duplicated()].count()
twitter_df['expanded_urls'].value_counts()
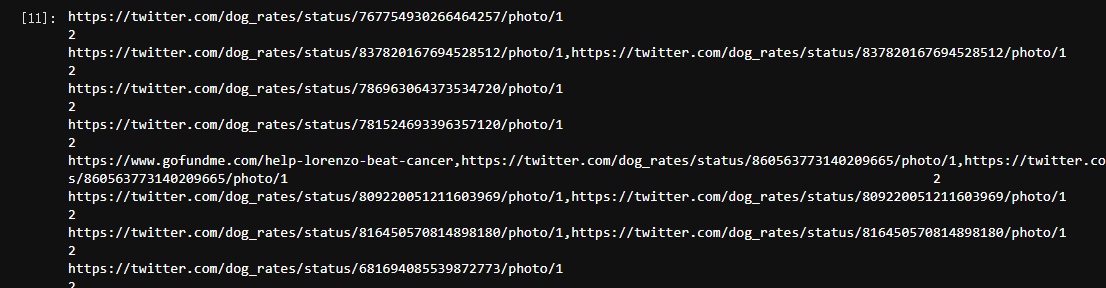
expanded url lets me know that tweets are repetitive. So 137 tweets are repetitive. To prove this, I opened the dataset and found that some expanded URLs had two.
twi_pred_df[twi_pred_df['jpg_url'].duplicated()].count()
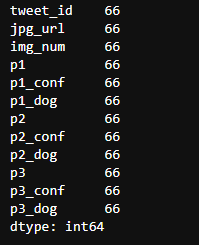
The same is true for predictions, where there are 66 duplicate lines and scrapped_df is not checked because it will merge with twitter_df, so duplicate values are not considered.
3.
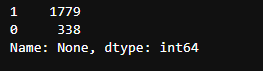
len(twi_pred_df) - len(twi_pred_df[(twi_pred_df['p1_dog']== True) & (twi_pred_df['p2_dog'] == True) & (twi_pred_df['p3_dog'] == True)])
# Output 832
len(twi_pred_df) - len(twi_pred_df[(twi_pred_df['p1_dog']== True) | (twi_pred_df['p2_dog'] == True) | (twi_pred_df['p3_dog'] == True)])
# Output 324
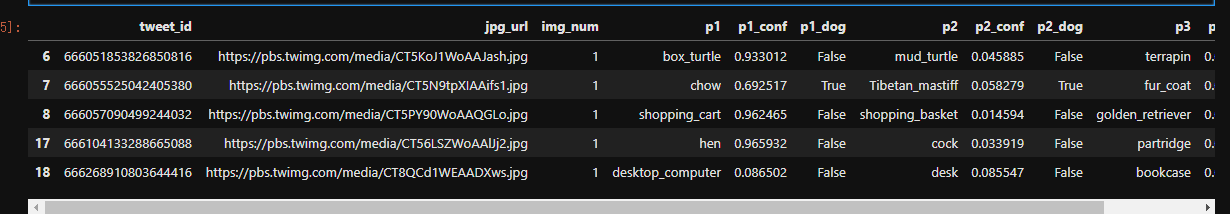
Of the 2075 records, 832 may be images of dogs. There are 324 items. None of the three predicted images are dogs. You can observe 324 lines, but you can be sure that 342 pictures are definitely not dogs.
temp_df = twi_pred_df[(twi_pred_df['p1_dog']== False) | (twi_pred_df['p2_dog'] == False) | (twi_pred_df['p3_dog'] == False)]
temp_df.head()
Open the first web site to view
from IPython.display import IFrame
IFrame('https://pbs.twimg.com/media/CT5KoJ1WoAAJash.jpg',width='100%', height=500)
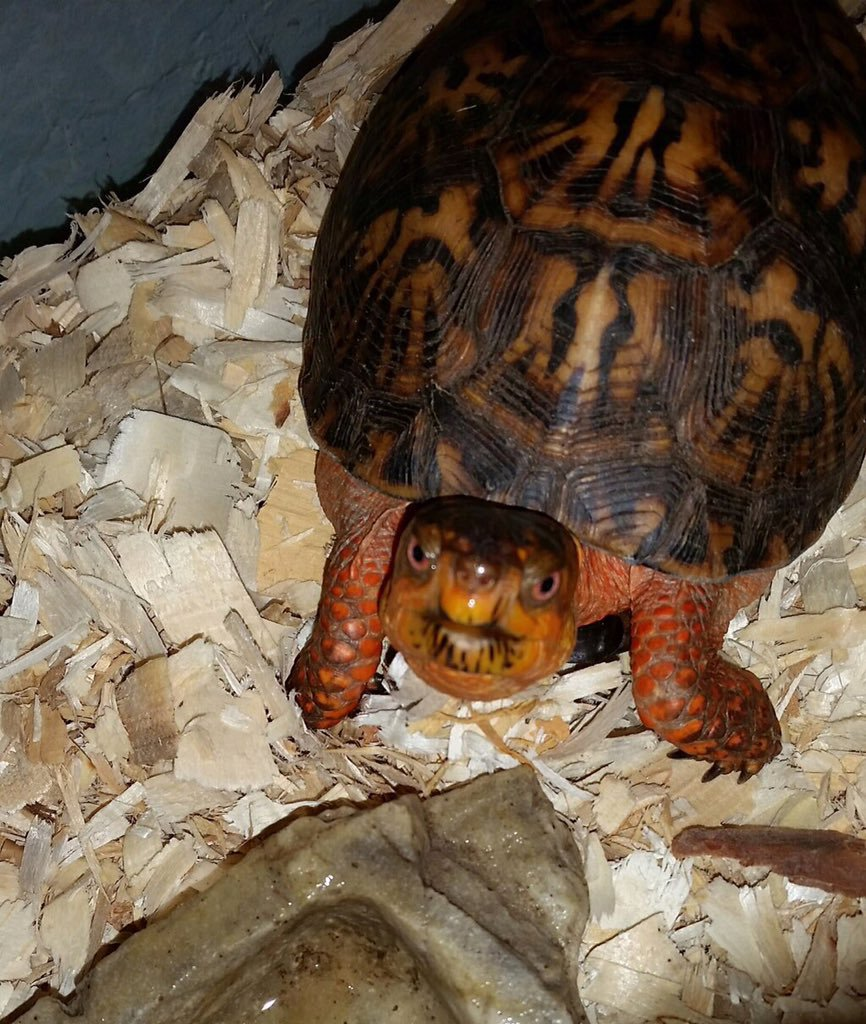
It's obviously a tortoise.
scrapped_df.info()
4.
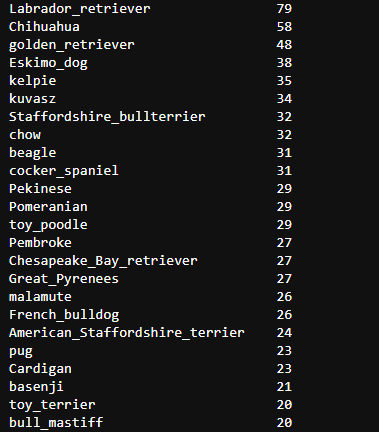
twi_pred_df['p1'].value_counts()
5.
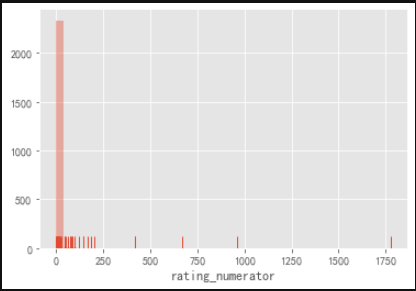
sns.distplot(twitter_df['rating_numerator'], kde=False, rug=True) # Scoring Molecule
plt.show()
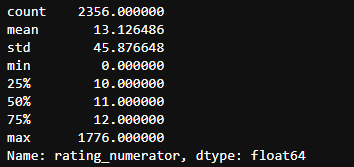
twitter_df['rating_numerator'].describe()
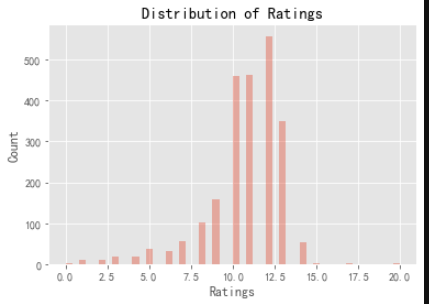
x = twitter_df[twitter_df['rating_numerator']<= 20.0].rating_numerator
sns.distplot(x, kde=False)
plt.xlabel('Ratings')
plt.ylabel('Count')
plt.title('Distribution of Ratings')
plt.show()
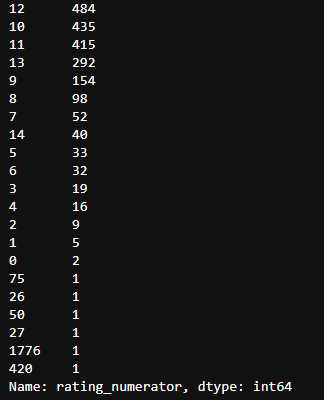
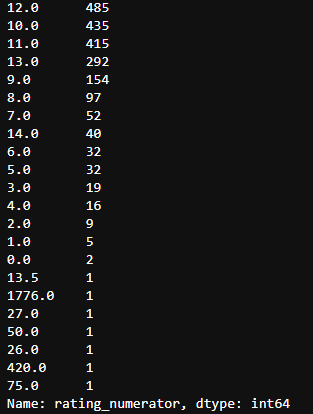
twitter_df['rating_numerator'].value_counts()
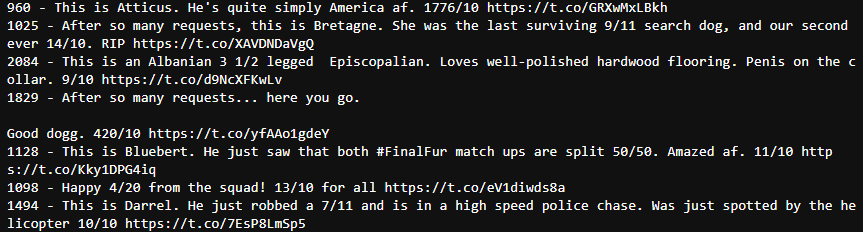
Scoring molecular data showed that there were some obvious outliers in the data. To check this, I used the describe function. Obviously, I saw that the average value was 13 and the maximum value was 1776. To get a more complete counter, I made a value count. I found that many values were abnormal, but there were also values below 10, which was not quite like his unique scoring system.
6.
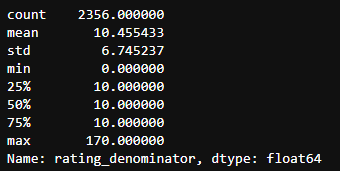
twitter_df['rating_denominator'].describe() # Scoring denominator
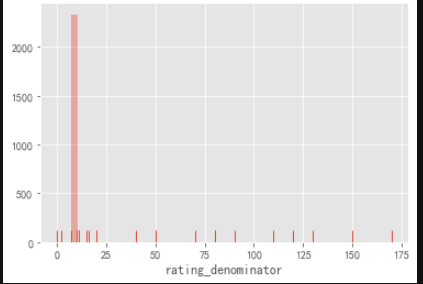
sns.distplot(twitter_df['rating_denominator'], kde=False, rug=True)
plt.show()
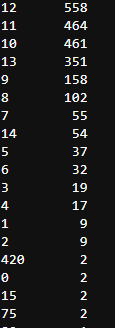
twitter_df['rating_denominator'].value_counts()
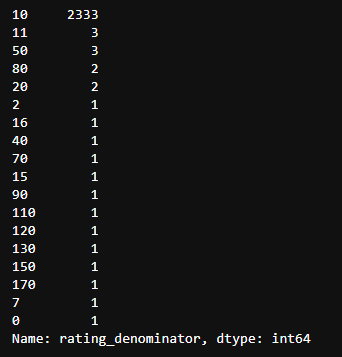
The same question applies to the denominator, which should be equal to 10, but we can also find other values.
This is the problem found by the above analysis:
quality problem
- There are five missing values in twitter_df
- Most dogs do not distinguish between doggo, floofer, pupper, puppo
- The dog's name was mislabeled, mislabeled and lost.
- For better analysis
- All three data boxes have duplicate values
- Rating problem: Some denominators are not 10, while some molecules are less than 10. Some tweets are not rated.
- All tweet_id s should be strings
- Data type inconsistency
Cleanness
- dog stage contains four different columns
- For ease of analysis, dates and times can be divided into date and time columns.
3. Data Cleaning
# Backup raw data
c_twitter_df = twitter_df.copy()
c_twitter_df.head()
c_pred = twi_pred_df.copy()
c_pred.head()
c_scrapped = scrapped_df.copy()
c_scrapped.head()
- Delete rows with empty retweet_status
c_twitter_df = c_twitter_df[c_twitter_df['retweeted_status_id'].notnull() == False]
- Delete duplicate values of expanded_urls
# keep='first'retains the first occurrence
c_twitter_df = c_twitter_df.drop_duplicates(subset = 'expanded_urls', keep='first')
- Delete all missing rows In c_twitter_df
- in_reply_to_status_id
- in_reply_to_user_id
- retweeted_status_id
- retweeted_status_user_id
- retweeted_status_timestamp
c_twitter_df = c_twitter_df.drop(columns=['in_reply_to_status_id','in_reply_to_user_id','retweeted_status_id','retweeted_status_user_id','retweeted_status_timestamp'])
c_twitter_df.info()
c_twitter_df.head()
Delete the useless column source, expand_urls
c_twitter_df = c_twitter_df.drop(columns=['expanded_urls','source'])
c_twitter_df.info()
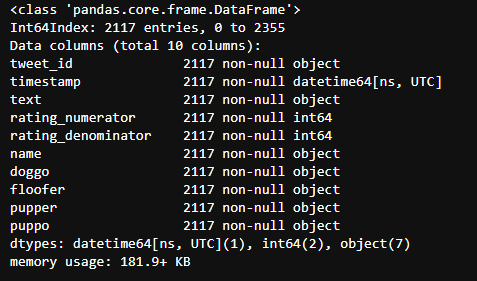
Modify data types
Use astype to change the data type to a more appropriate type
c_twitter_df
- tweet_id => string
- timestamp => datetime
c_scrapped
- created_at => datetime
- tweet_id => string
c_pred
- tweet_id => string
c_twitter_df['tweet_id'] = c_twitter_df['tweet_id'].astype('str')
c_twitter_df['timestamp'] = pd.to_datetime(c_twitter_df['timestamp'])
c_scrapped['created_at'] = pd.to_datetime(scrapped_df['created_at'])
c_scrapped['tweet_id'] = c_scrapped['tweet_id'].astype('str')
c_pred['tweet_id'] = c_pred['tweet_id'].astype('str')
c_twitter_df.info()
c_scrapped.info()
c_pred.info()
- doggo, floofer, pupper, puppo columns can be merged into one column
- But some lines have more than one stage, which interferes with subsequent analysis, so delete these lines
c_twitter_df['doggo'] = c_twitter_df['doggo'].replace('None', 0)
c_twitter_df['doggo'] = c_twitter_df['doggo'].replace('doggo', 1)
c_twitter_df['floofer'] = c_twitter_df['floofer'].replace('None', 0)
c_twitter_df['floofer'] = c_twitter_df['floofer'].replace('floofer', 1)
c_twitter_df['pupper'] = c_twitter_df['pupper'].replace('None', 0)
c_twitter_df['pupper'] = c_twitter_df['pupper'].replace('pupper', 1)
c_twitter_df['puppo'] = c_twitter_df['puppo'].replace('None', 0)
c_twitter_df['puppo'] = c_twitter_df['puppo'].replace('puppo', 1)
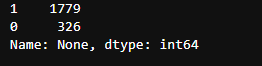
c_twitter_df['None'] = 0
Assign a value of 1 to the None column without dog stage rows
c_twitter_df.loc[(c_twitter_df['puppo']+c_twitter_df['floofer']+c_twitter_df['pupper']+c_twitter_df['doggo'] == 0),'None'] = 1
c_twitter_df['None'].value_counts()
Check whether a row has multiple dog stage s
c_twitter_df[(c_twitter_df['puppo']+c_twitter_df['floofer']+c_twitter_df['pupper']+c_twitter_df['doggo']+c_twitter_df['None']> 1)]
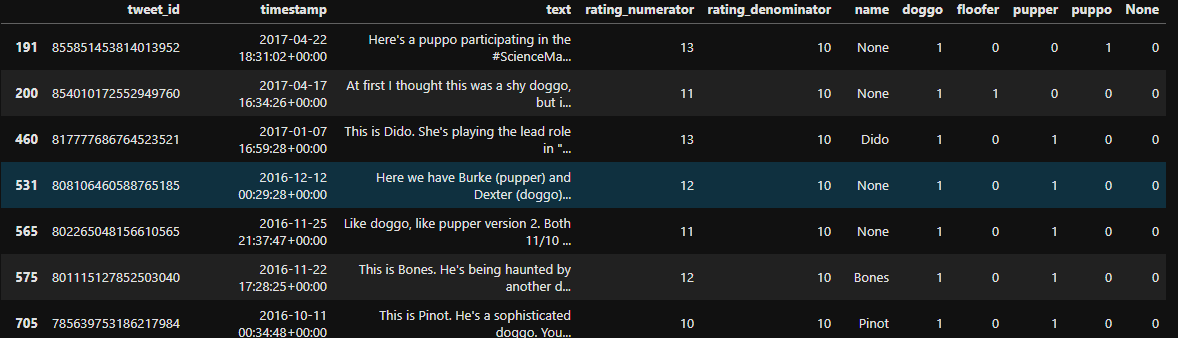
Delete these 12 lines because they interfere with subsequent analysis
# ~ Inversion
c_twitter_df = c_twitter_df[~(c_twitter_df['puppo']+c_twitter_df['floofer']+c_twitter_df['pupper']+c_twitter_df['doggo']> 1)]
len(c_twitter_df)
# Output 2105
c_twitter_df['None'].value_counts()
Fusion of doggo, floofer, pupper, puppo into one column
# pandas.melt(frame, id_vars=None, value_vars=None, var_name=None, value_name='value', col_level=None)
# frame: Data to be processed
# id_vars: Column names that do not need to be converted
# value_vars: Column names that need to be converted. If all the remaining columns need to be converted, you don't have to write
# var_name and value_name are column names corresponding to custom settings
# col_level: Use this level if the column is MultiIndex.
values = ['doggo', 'floofer', 'pupper', 'puppo', 'None']
ids = [x for x in list(c_twitter_df.columns) if x not in values]
c_twitter_df = pd.melt(c_twitter_df, id_vars = ids, value_vars = values, var_name='stage')
c_twitter_df = c_twitter_df[c_twitter_df.value == 1]
c_twitter_df.drop('value', axis=1, inplace=True)
c_twitter_df.head()
# reset_index can restore the index and revert to the default integer index
# DataFrame.reset_index(level=None, drop=False, inplace=False, col_level=0, col_fill=")
# Level controls the index of the specific level to be restored
# If drop is False, the index column will be restored to normal column, otherwise it will be lost.
c_twitter_df.reset_index(drop=True, inplace=True)
# Convert stage to category type
c_twitter_df.stage = c_twitter_df.stage.astype('category')
None should be the same as before
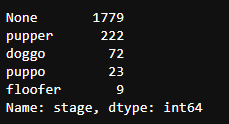
c_twitter_df['stage'].value_counts()
len(c_twitter_df)
# Output 2105
Clean Dog Predictions
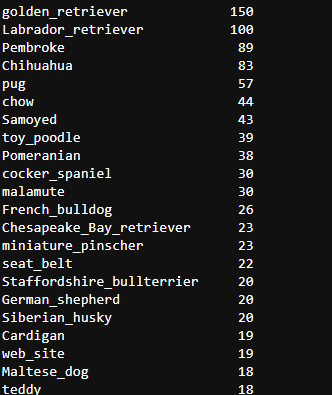
c_pred['p1'].value_counts()
c_pred['p2'].value_counts()
c_pred['p3'].value_counts()
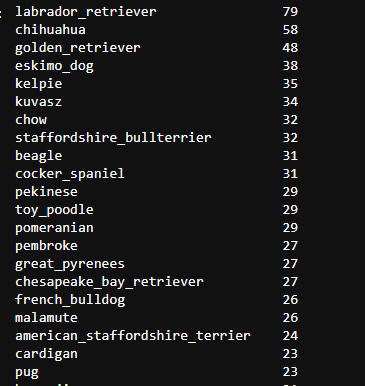
c_pred['p1'] = c_pred['p1'].str.lower()
c_pred['p1'] = c_pred['p1'].replace([' ','-'],'_')
c_pred['p2'] = c_pred['p2'].str.lower()
c_pred['p2'] = c_pred['p2'].replace([' ','-'],'_')
c_pred['p3'] = c_pred['p3'].str.lower()
c_pred['p3'] = c_pred['p3'].replace([' ','-'],'_')
c_pred['p1'].value_counts()
c_pred['p2'].value_counts()
c_pred['p3'].value_counts()
The predicted object may not be a dog. If all three predictions are true, create a dog to make a separate prediction column. If all three predictions are wrong, it is not a dog.
pred = ['p1_dog', 'p2_dog', 'p3_dog']
for p in pred:
    c_pred[p] = c_pred[p].astype(int)
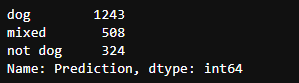
c_pred.loc[(c_pred['p1_dog']+c_pred['p2_dog']+c_pred['p3_dog'] == 0),'Prediction'] = 'not dog'
c_pred.loc[(c_pred['p1_dog']+c_pred['p2_dog']+c_pred['p3_dog'] == 1),'Prediction'] = 'mixed'
c_pred.loc[(c_pred['p1_dog']+c_pred['p2_dog']+c_pred['p3_dog'] == 2),'Prediction'] = 'mixed'
c_pred.loc[(c_pred['p1_dog']+c_pred['p2_dog']+c_pred['p3_dog'] == 3),'Prediction'] = 'dog'
c_pred['Prediction'].value_counts()
c_twitter_df['name'].value_counts()
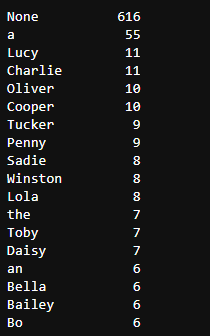
- Name has obvious errors,'an','a'and'the' can be considered names, so remove the wrong names first.
- Names should start in capitals, and find names that do not begin in capitals.
pd.set_option('display.max_colwidth', -1)
vals = c_twitter_df[~c_twitter_df['name'].str[0].str.isupper()]['name'].value_counts()
vals.keys()
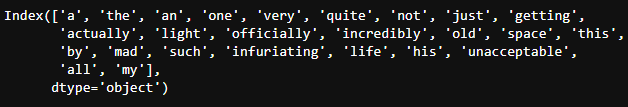
# Change incorrect names to None
for val in vals.keys():
    c_twitter_df['name'] = c_twitter_df['name'].replace(val,'None')
c_twitter_df['name'] = c_twitter_df['name'].replace('a','None')
c_twitter_df['name'] = c_twitter_df['name'].replace('an','None')
c_twitter_df['name'] = c_twitter_df['name'].replace('the','None')
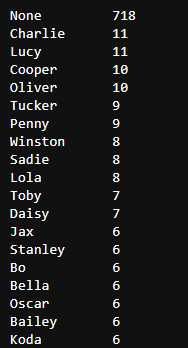
c_twitter_df['name'].value_counts()
- Part of the rating_numerator, rating_denominator column data does not match the original information in the text column
- Delete the wrong score
rating_denominator
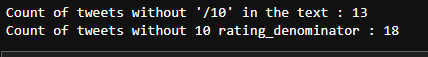
print("Count of tweets without '/10' in the text : {}".format(c_twitter_df[~c_twitter_df['text'].str.contains('/10')]['tweet_id'].count()))
print("Count of tweets without 10 rating_denominator : {}".format(c_twitter_df[c_twitter_df['rating_denominator'] != 10]['tweet_id'].count()))
c_twitter_df = c_twitter_df[c_twitter_df['text'].str.contains('/10')]
print("Count of tweets without 10 rating_denominator {}:".format(c_twitter_df[c_twitter_df['rating_denominator'] != 10].tweet_id.count()))

Check these five lines to see if they can be repaired manually.
c_twitter_df[c_twitter_df['rating_denominator'] != 10].text
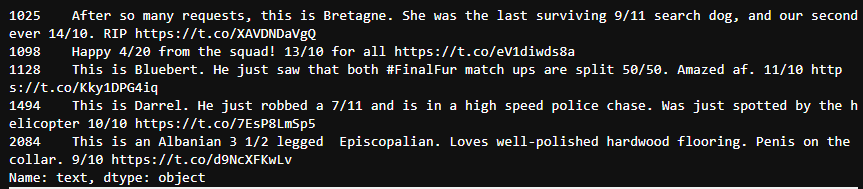
We can see that the tweet is correct, so we can repair the data manually.
idx = c_twitter_df[c_twitter_df['rating_denominator'] != 10].index
for i in idx:
    c_twitter_df.at[i, 'rating_denominator'] = 10
c_twitter_df['rating_denominator'].value_counts()

rating_numerator
c_twitter_df['rating_numerator'].value_counts()
# strip removes first and last spaces by default
cannot_parse = set()
incorrect = set()
for i in c_twitter_df.index:
index = int(c_twitter_df.loc[i].text.find('/10'))
try:
numerator = int(c_twitter_df.loc[i].text[index-2:index].strip())
except:
cannot_parse.add(i)
continue
if numerator != c_twitter_df.loc[i].rating_numerator:
incorrect.add(i)
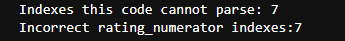
print('Indexes this code cannot parse: {}'.format(len(cannot_parse)))
print('Incorrect rating_numerator indexes:{}'.format(len(incorrect)))
for i in incorrect:
    print('{} - {}'.format(i, c_twitter_df.loc[i]['text']))
You can see that these scores follow the unique scoring mechanism of Twitter, so we can repair molecules manually.
c_twitter_df.loc[995,'rating_numerator'] = 9
c_twitter_df.loc[232,'rating_numerator'] = 8
c_twitter_df.loc[363,'rating_numerator'] = 13.5
c_twitter_df.loc[1198,'rating_numerator'] = 12
c_twitter_df.loc[1328,'rating_numerator'] = 8
c_twitter_df.loc[1457,'rating_numerator'] = 9
c_twitter_df.loc[1275,'rating_numerator'] = 9
c_twitter_df['rating_numerator'].value_counts()
Connection table
Since c_pred is a different set of information, it is not necessary to combine it with c_twitter_df.
print(len(c_twitter_df))
print(len(c_pred))
print(len(c_scrapped))

# Remove unwanted information
c_pred = c_pred.drop(columns=['p1_dog','p2_dog','p3_dog'])
c_scrapped = c_scrapped.drop(columns=['created_at','favorited','retweeted'])
c_twitter_df = c_twitter_df.drop(columns=['text'])
# Connect c_twitter to c_scrapped
main_df = c_twitter_df.merge(c_scrapped, on='tweet_id',how='inner')
main_df.head()
Storing
Save the cleaned data
main_df.to_csv('../data/twitter_archive_master.csv', index=False)
c_pred.to_csv('../data/image_archive_master.csv', index=False)
Analysis
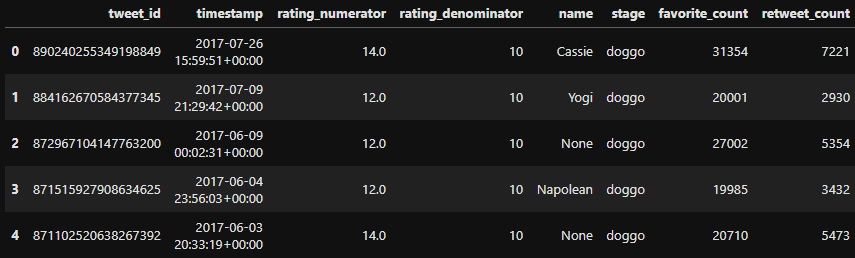
tweet_df = pd.read_csv('../data/twitter_archive_master.csv')
tweet_df.head()
image_df = pd.read_csv('../data/image_archive_master.csv')
image_df.head()
We analyze the following issues:
- How does the score affect the number of forwards?
- Over time, how does the forwarding volume and point approval change?
- How does the model behave?
- What is the most popular dog name?
- What types of dogs are there?
1. How does score affect the amount of Twitter forwarding?
import seaborn as sns
plt.style.use('ggplot')
# Delete Molecules Over 20 Scores
ratings = tweet_df[tweet_df['rating_numerator'] < 20]['rating_numerator']
count = tweet_df[tweet_df['rating_numerator'] < 20]['retweet_count']
sns.scatterplot(ratings,count)
plt.xlabel('score')
plt.ylabel('Forwarding volume')
plt.title('How does the score affect the amount of Twitter forwarding?')
plt.show()
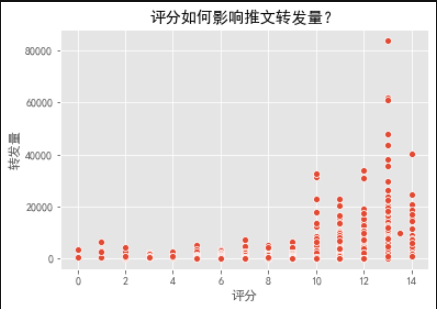
- We can see that the number of forwards with a score of less than 10 is very small, the number of forwards with a score of more than 10 is also large, and the number of forwards with a score of 13 is the largest.
- However, this may be caused by other factors, and it can not be explained that there is a causal relationship between the two.
2. How does the forwarding volume and point approval change over time?
time = pd.to_datetime(tweet_df[tweet_df.favorite_count < 10000].timestamp).dt.date

fig, ax = plt.subplots(figsize=(20,10))
plt.plot_date(time,tweet_df[tweet_df.favorite_count < 10000].retweet_count,color='b' , label='retweet_count')
plt.plot_date(time,tweet_df[tweet_df.favorite_count < 10000].favorite_count, color='r', label='favorite_count')
plt.xlabel('time')
plt.ylabel('Number')
plt.title('Over time, how does the forwarding volume and point approval change?')
plt.legend()
ax.xaxis.set_tick_params(rotation=90, labelsize=10)
plt.show()
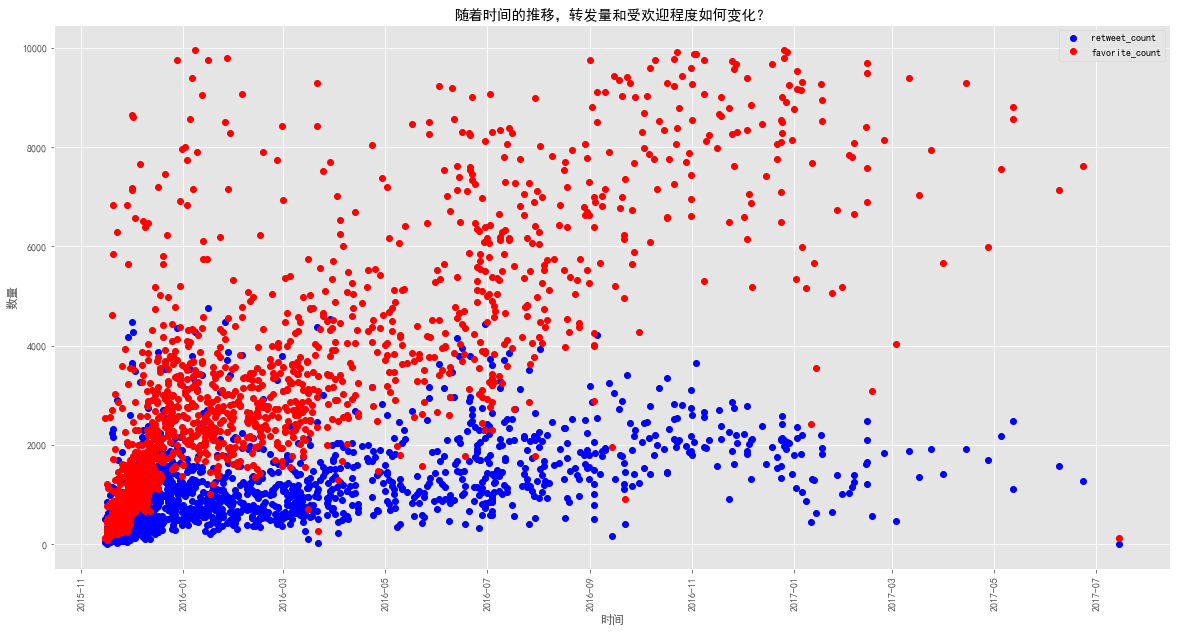
- An obvious trend is that at the beginning, the number of points is similar to the number of forwards, but the number of forwards is more. But by 2016 and 2017, the number of Twitters was getting smaller and smaller (as can be seen from the number of blue and red dots, but the number of dots was getting larger and larger). ) Another noteworthy trend is that the number of point reviews has increased dramatically, but during the whole process, the number of forwards has not exceeded 5,000 at most.
3. How does the model perform?
image_df.describe()
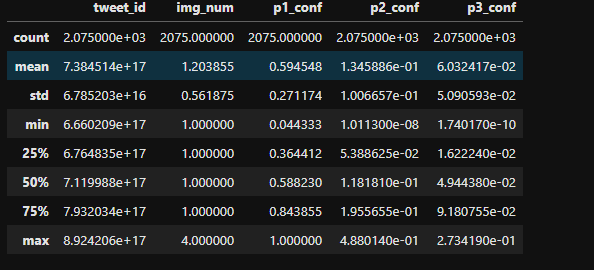
- The p1_conf value of some tweets is 1, which shows that the neural network is very confident in them.
- But the two predictions, p2_conf and p3_conf, seem to be less confident.
Let's look at the graph with p1_conf value of 1.
tweet = image_df[image_df.p1_conf == 1.0]
tweet

from IPython.display import IFrame
IFrame('https://pbs.twimg.com/media/CUS9PlUWwAANeAD.jpg',width='100%', height=500)
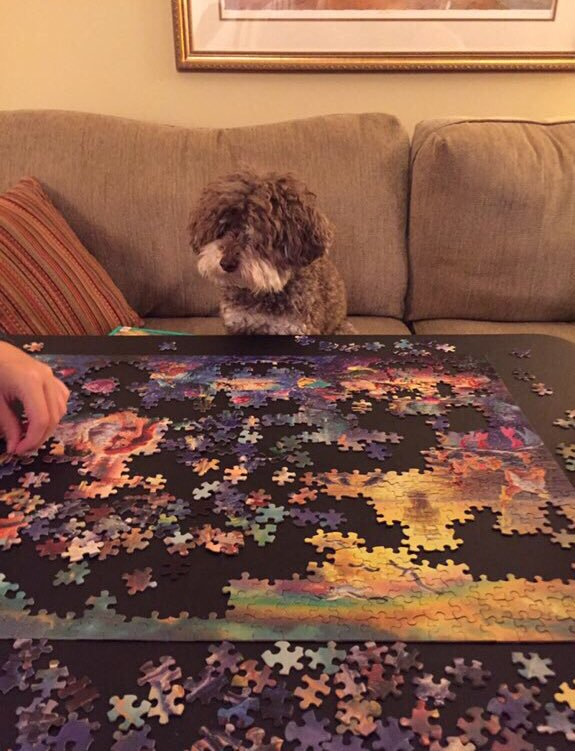
We found that the model decided that the picture was not a dog, but when we opened the website manually, we found that it was a dog looking at the puzzle. The model might not catch the dog, but focused on the puzzle.
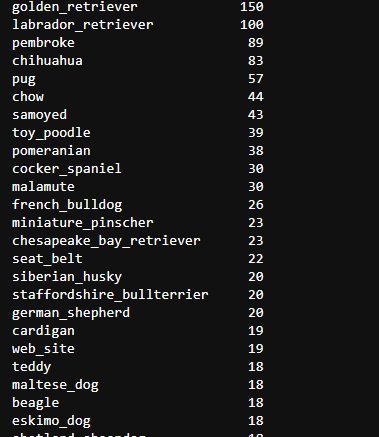
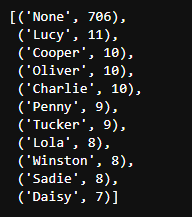
4. What is the most popular dog name?
from collections import Counter

x = tweet_df['name']

count = Counter(x)
count.most_common(11)
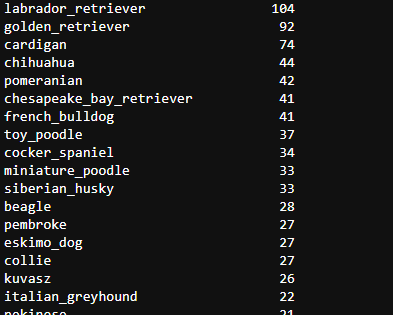
5. What types of dogs are there?
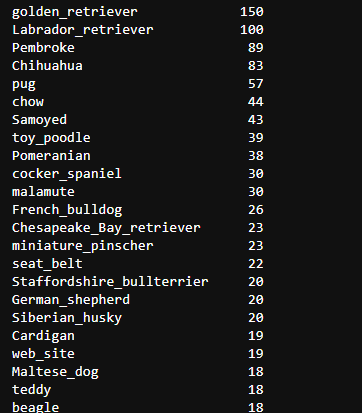
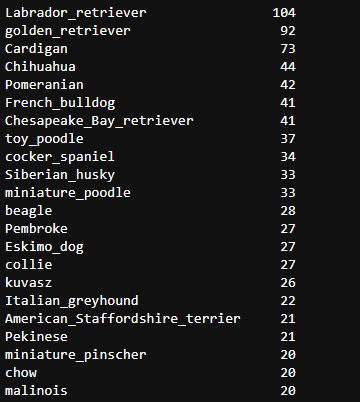
types = image_df[image_df.Prediction == 'dog'].p1.value_counts()
types
plt.bar(types[0:10].index,types[0:10])
plt.xticks(rotation='vertical')
plt.xlabel('Dog Types')
plt.ylabel('Number')
plt.title('What types of dogs are there?')
plt.show()
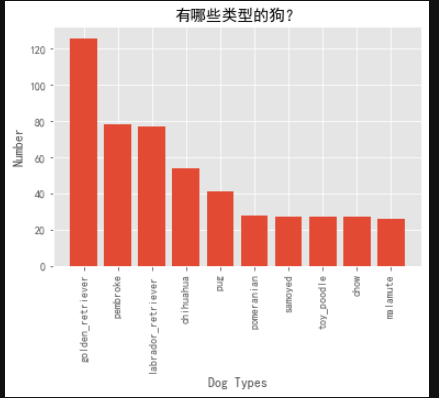
As you can see, the most popular is Golden Hair, followed by Pembroke and Labrador.
Through this project, we understand the importance of data visualization. For many people, it is difficult to find rules from a pile of text data, but we can clearly find the rules and errors through data visualization.
The initial data exploration is very important. It can help us to find problems in the data and help us to further analyze and understand the data.