Drawing method of 1.1 histogram
The first step is to understand what steps are required to draw this histogram.
1. Histogram in the middle
2.X,Y-axis
3. Histograms of the same style
First, the word "histogram" is drawn. What you need is the drawText method, which is located in the middle and bottom, so it's very good to draw.
mPaint.setColor(Color.WHITE);
mPaint.setTextSize(20);
mPaint.setTextAlign(Paint.Align.CENTER);
canvas.drawText("histogram", canvas.getWidth() / 2, canvas.getHeight() * 0.95f, mPaint);
Next comes the X, Y axes, which are drawn using the drawLine method.
 mPaint.setStyle(Paint.Style.STROKE);
 canvas.drawLine(0, 0, 0, -canvas.getHeight() * 0.7f, mPaint);
 canvas.drawLine(0, 0, canvas.getWidth() * 0.8f, 0, mPaint);
Finally there are the tiles, where you need to calculate the width and distance between each tile.Then drawRect and drawText methods are used to achieve the column effect.First calculate:
 float width = (canvas.getWidth() * 0.8f - 100) / mDatas.size() * 0.8f;
 float space = (canvas.getWidth() * 0.8f - 100) / mDatas.size() * 0.2f;
Then draw columns and text:
 float startX = 0.0f;
 for (Data item : mDatas) {
      mPaint.setColor(Color.WHITE);
      mPaint.setStyle(Paint.Style.FILL);
      mPaint.setTextSize(20);
      mPaint.setTextAlign(Paint.Align.CENTER);
          canvas.drawText(item.getName(), startX + space + width / 2, 25, mPaint);

      mPaint.setColor(item.getColor());
      canvas.drawRect(startX + space, -item.getChance() / max * canvas.getHeight() * 0.65f, startX + space + width, 0, mPaint);
            startX = space + width + startX;
    }
Finally put mDatas:
private List<Data> mDatas = new ArrayList<>();
Paint mPaint = new Paint(Paint.ANTI_ALIAS_FLAG);
private float max = 0;
private void init() {
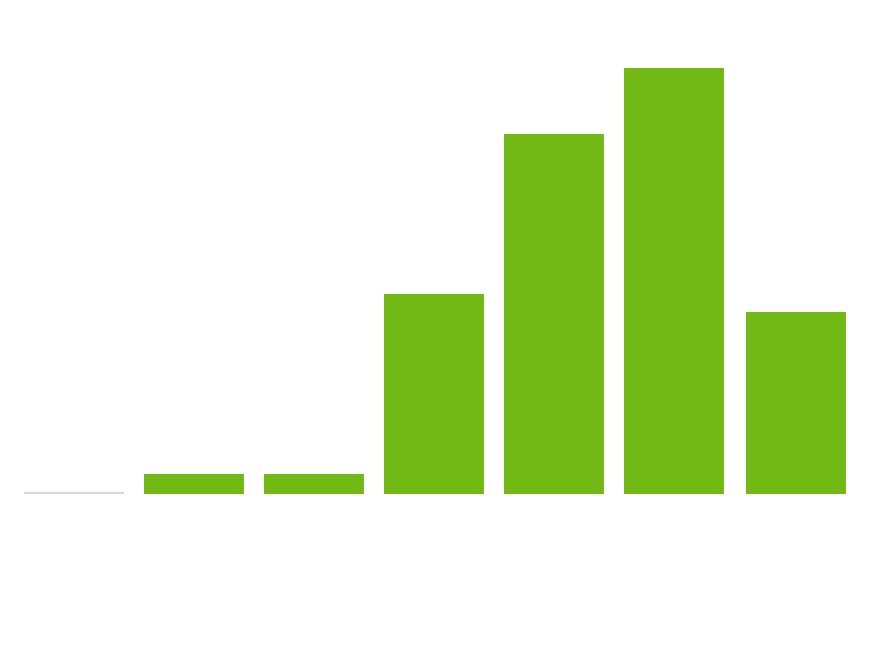
mDatas.add(new Data("Froyo", 5.0f, Color.GREEN));
mDatas.add(new Data("GB", 25.0f, Color.GREEN));
mDatas.add(new Data("ICS", 25.0f, Color.GREEN));
mDatas.add(new Data("JB", 90.0f, Color.GREEN));
mDatas.add(new Data("KitKat", 180.0f, Color.GREEN));
mDatas.add(new Data("L", 225.0f, Color.GREEN));
mDatas.add(new Data("M", 160.0f, Color.GREEN));
for (Data data : mDatas) {
max = Math.max(max, data.getChance());
}
}public class Data {
private String name;
private float chance;
private int color;
public Data(String name, float chance, int color) {
this.name = name;
this.chance = chance;
this.color = color;
}
.....
}