1. PIL-Python image library
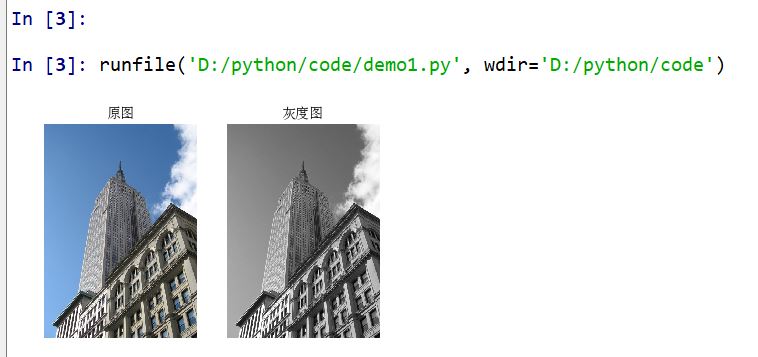
1.1 image gray processing
code implementation
# -*- coding: utf-8 -*-
from PIL import Image
from pylab import *

# Add Chinese font support
from matplotlib.font_manager import FontProperties
font = FontProperties(fname=r"c:\windows\fonts\SimSun.ttc", size=14)
figure()

pil_im = Image.open('D:\\python\pcv_data\data\empire.jpg')
gray()
subplot(121)
title(u'Original graph',fontproperties=font)
axis('off')
imshow(pil_im)

pil_im = Image.open('D:\\python\pcv_data\data\empire.jpg').convert('L')
subplot(122)
title(u'Grayscale',fontproperties=font)
axis('off')
imshow(pil_im)

show()
Operation result
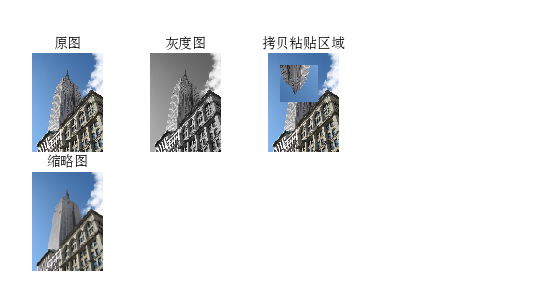
1.2 adjustment of dimensions and rotation
Call the resize() method to adjust the size of the picture. The tuple contains the size you want to adjust.
Call the rotate() method to rotate the image.
code implementation
# -*- coding: utf-8 -*-
from PIL import Image
from pylab import *

# Add Chinese font support
from matplotlib.font_manager import FontProperties
font = FontProperties(fname=r"c:\windows\fonts\SimSun.ttc", size=14)
figure()

# Display original graph
pil_im = Image.open('D:\\python\pcv_data\data\empire.jpg')
print pil_im.mode, pil_im.size, pil_im.format
subplot(231)
title(u'Original graph', fontproperties=font)
axis('off')
imshow(pil_im)

# Show grayscale
pil_im = Image.open('D:\\python\pcv_data\data\empire.jpg').convert('L')
gray()
subplot(232)
title(u'Grayscale', fontproperties=font)
axis('off')
imshow(pil_im)

#Copy paste area
pil_im = Image.open('D:\\python\pcv_data\data\empire.jpg')
box = (100,100,400,400)
region = pil_im.crop(box)
region = region.transpose(Image.ROTATE_180)
pil_im.paste(region,box)
subplot(233)
title(u'Copy paste area', fontproperties=font)
axis('off')
imshow(pil_im)

# thumbnail
pil_im = Image.open('D:\\python\pcv_data\data\empire.jpg')
size = 128, 128
pil_im.thumbnail(size)
print pil_im.size
subplot(234)
title(u'thumbnail', fontproperties=font)
axis('off')
imshow(pil_im)
pil_im.save('D:\\python\images\thumbnail.jpg') #Save Thumbnail Image

# Resize image
pil_im = Image.open('D:\\python\pcv_data\data\empire.jpg')
pil_im = pil_im.resize(size)
print pil_im.size
subplot(235)
title(u'Resized image', fontproperties=font)
axis('off')
imshow(pil_im)

# Rotate image 45 °
pil_im = Image.open('D:\\python\pcv_data\data\empire.jpg')
pil_im = pil_im.rotate(45)
subplot(236)
title(u'Rotate 45°After image', fontproperties=font)
axis('off')
imshow(pil_im)

show()
Operation result
2. Matplotlib Library
When dealing with mathematics and drawing or drawing points, lines and curves on images, Matplotlib is a good drawing library, which provides more powerful features than PIL library.
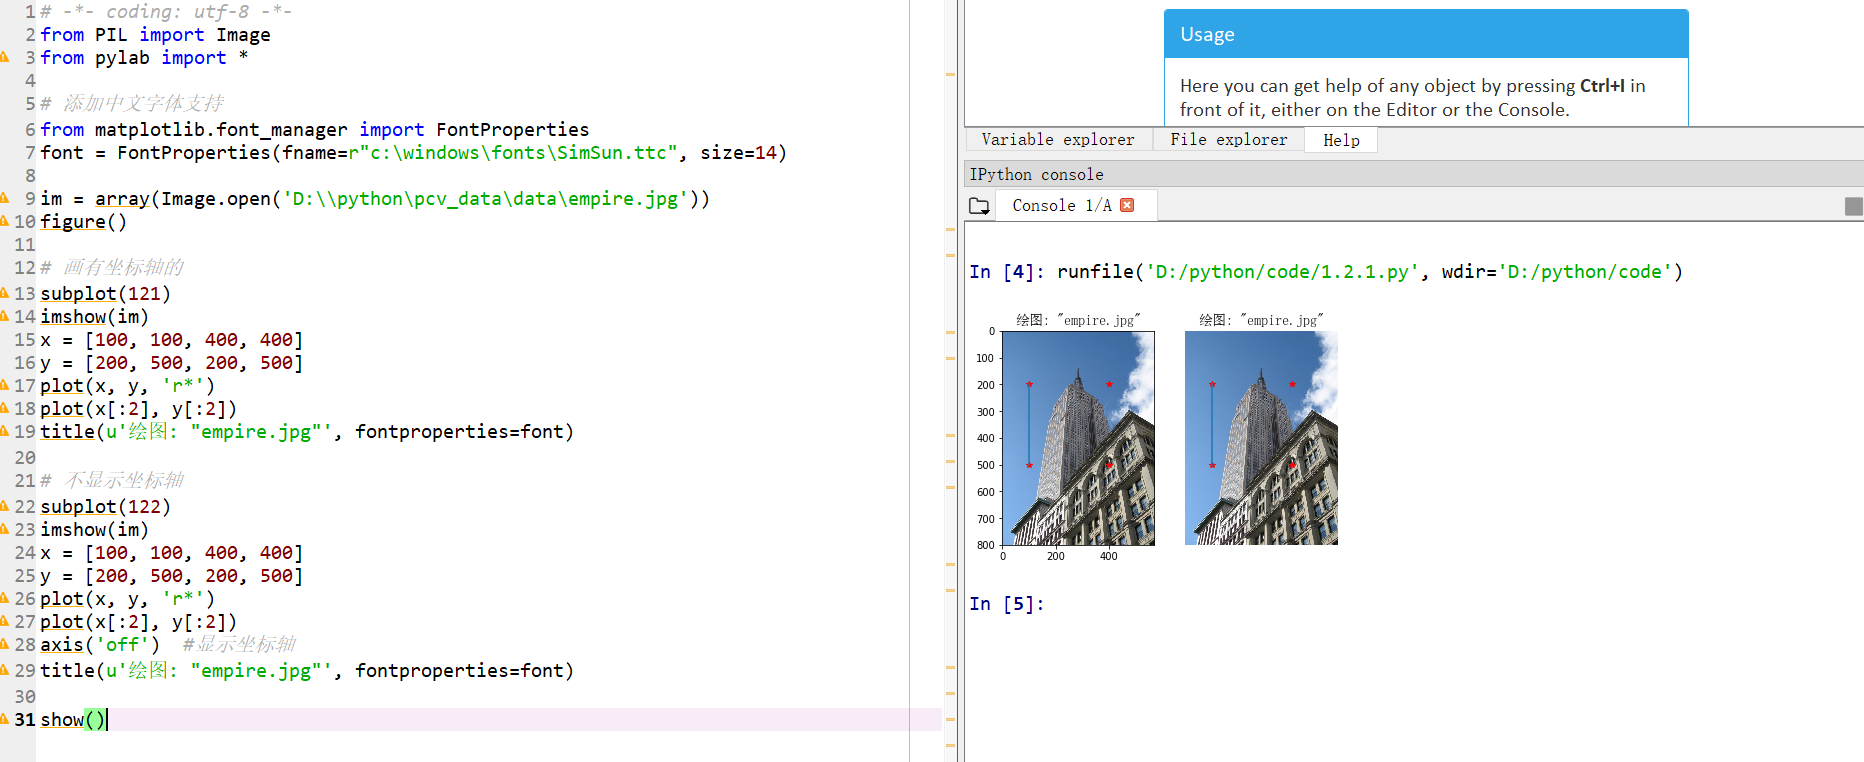
2.1 drawing, tracing points and lines
code implementation
# -*- coding: utf-8 -*-
from PIL import Image
from pylab import *

# Add Chinese font support
from matplotlib.font_manager import FontProperties
font = FontProperties(fname=r"c:\windows\fonts\SimSun.ttc", size=14)

im = array(Image.open('D:\\python\pcv_data\data\empire.jpg'))
figure()

# Drawn with axis
subplot(121)
imshow(im)
x = [100, 100, 400, 400]
y = [200, 500, 200, 500]
plot(x, y, 'r*')
plot(x[:2], y[:2])
title(u'Mapping: "empire.jpg"', fontproperties=font)

# Do not show axis
subplot(122)
imshow(im)
x = [100, 100, 400, 400]
y = [200, 500, 200, 500]
plot(x, y, 'r*')
plot(x[:2], y[:2])
axis('off')  #Show axis
title(u'Mapping: "empire.jpg"', fontproperties=font)

show()
Operation result
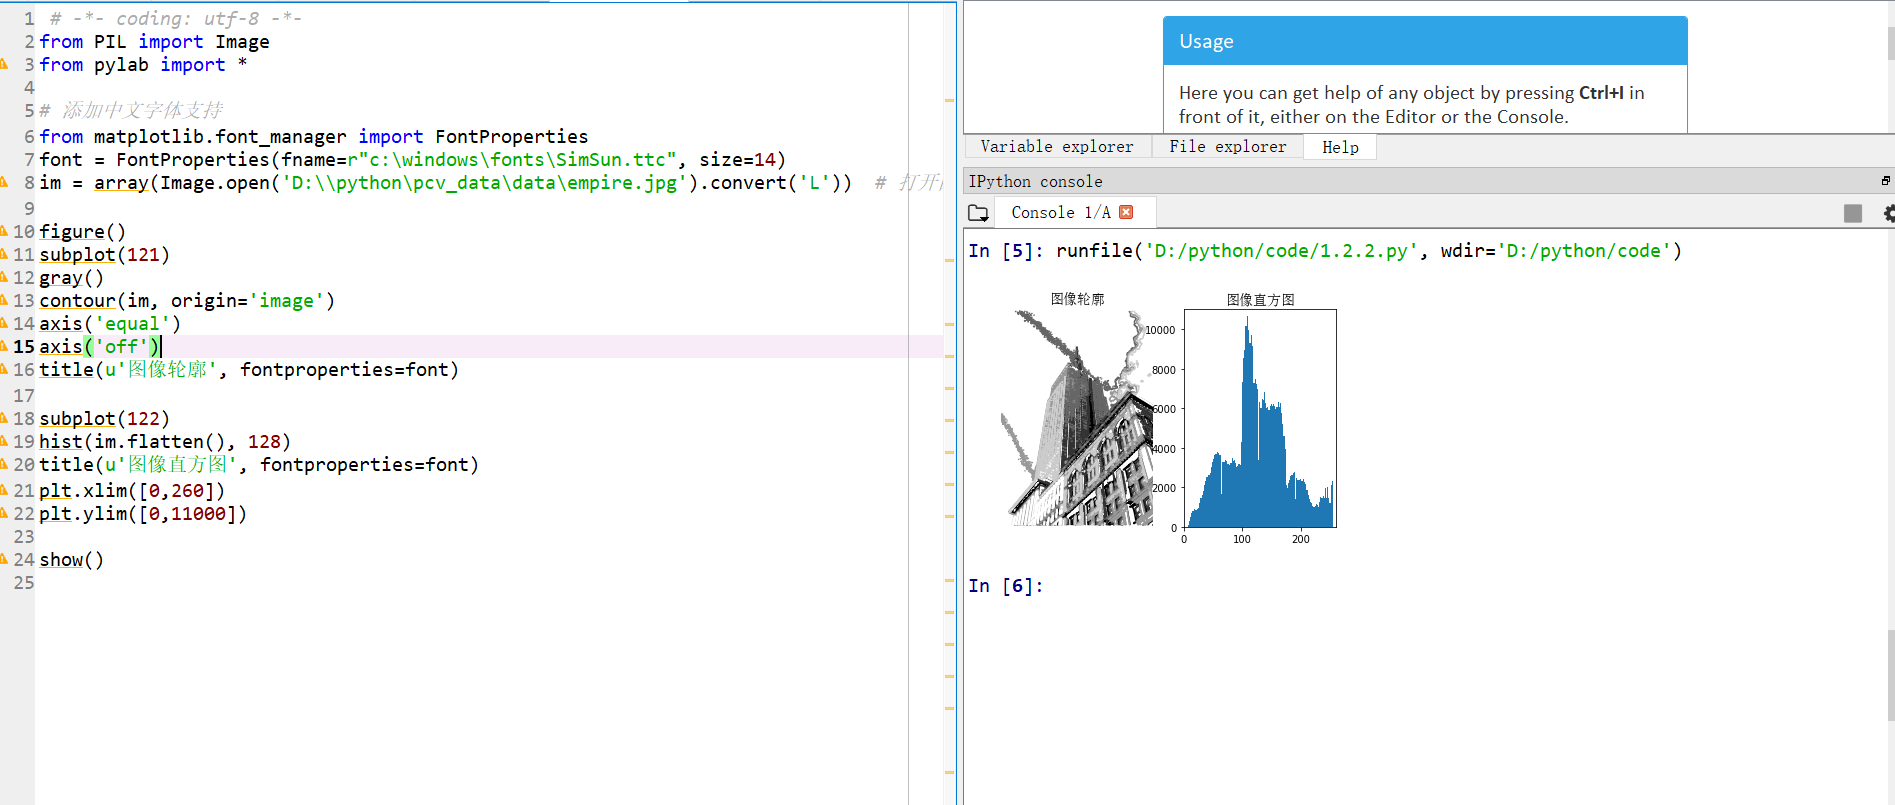
2.2 image outline and histogram
code implementation
 # -*- coding: utf-8 -*-
from PIL import Image
from pylab import *

# Add Chinese font support
from matplotlib.font_manager import FontProperties
font = FontProperties(fname=r"c:\windows\fonts\SimSun.ttc", size=14)
im = array(Image.open('D:\\python\pcv_data\data\empire.jpg').convert('L'))  # Open image and convert to grayscale image

figure()
subplot(121)
gray()
contour(im, origin='image')
axis('equal')
axis('off')
title(u'Image contour', fontproperties=font)

subplot(122)
hist(im.flatten(), 128)
title(u'image histogram ', fontproperties=font)
plt.xlim([0,260])
plt.ylim([0,11000])

show()
Operation result
3. NumPy Library
NumPy is a popular package for scientific computing in Python. It contains many useful objects and linear algebraic functions such as vector, matrix, image and so on.
3.1 gray scale transformation
code implementation
 # -*- coding: utf-8 -*-
from PIL import Image
from numpy import *
from pylab import *

im = array(Image.open('D:\\python\pcv_data\data\empire.jpg').convert('L'))
print int(im.min()), int(im.max())

im2 = 255 - im  # invert image
print int(im2.min()), int(im2.max())

im3 = (100.0/255) * im + 100  # clamp to interval 100...200
print int(im3.min()), int(im3.max())

im4 = 255.0 * (im/255.0)**2  # squared
print int(im4.min()), int(im4.max())

figure()
gray()
subplot(1, 3, 1)
imshow(im2)
axis('off')
title(r'$f(x)=255-x$')

subplot(1, 3, 2)
imshow(im3)
axis('off')
title(r'$f(x)=\frac{100}{255}x+100$')

subplot(1, 3, 3)
imshow(im4)
axis('off')
title(r'$f(x)=255(\frac{x}{255})^2$')
show()
Operation result
On the left side, f(x)=255-x is used, in the middle, f(x)=(100/255)x+100 is used, and on the right side, f(x)=255(x/255)^2 is used.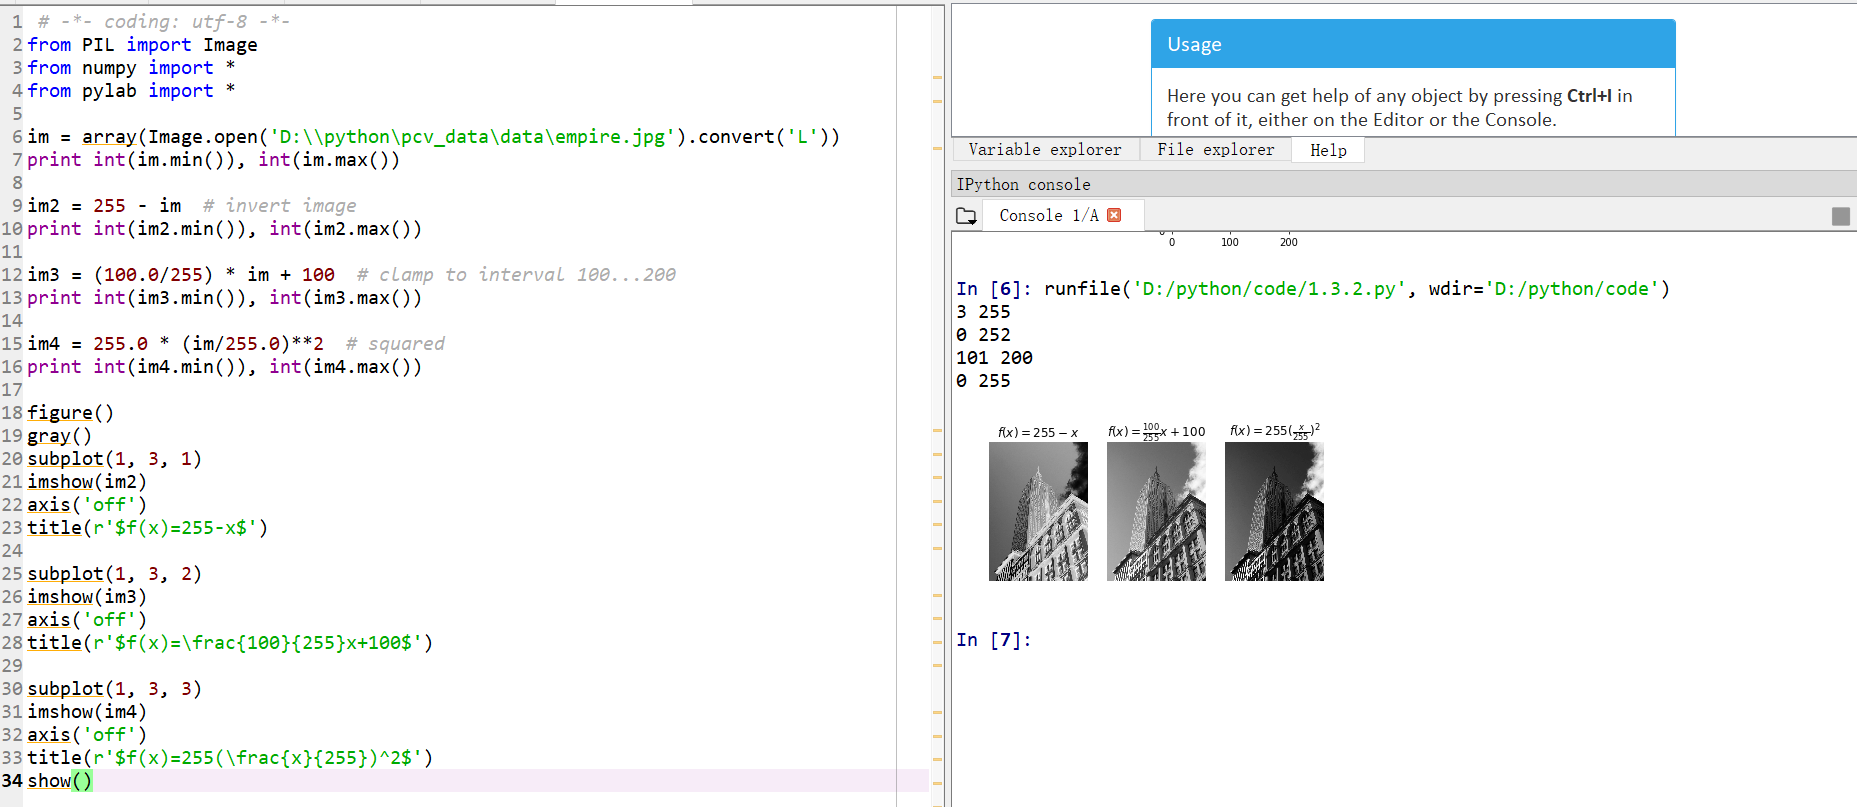
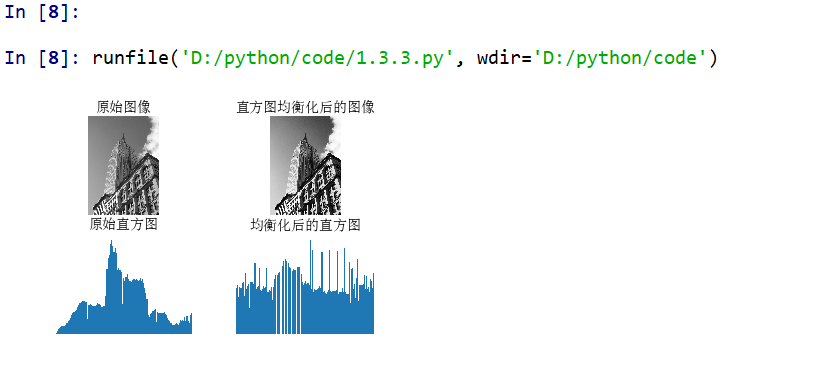
3.2 histogram equalization
code implementation
# -*- coding: utf-8 -*-
from PIL import Image
from pylab import *
from PCV.tools import imtools

# Add Chinese font support
from matplotlib.font_manager import FontProperties
font = FontProperties(fname=r"c:\windows\fonts\SimSun.ttc", size=14)

im = array(Image.open('D:\\python\pcv_data\data\empire.jpg').convert('L'))  # Open image and convert to grayscale image
#im = array(Image.open('../data/AquaTermi_lowcontrast.JPG').convert('L'))
im2, cdf = imtools.histeq(im)

figure()
subplot(2, 2, 1)
axis('off')
gray()
title(u'original image', fontproperties=font)
imshow(im)

subplot(2, 2, 2)
axis('off')
title(u'Image after histogram equalization', fontproperties=font)
imshow(im2)

subplot(2, 2, 3)
axis('off')
title(u'Original histogram', fontproperties=font)
#hist(im.flatten(), 128, cumulative=True, normed=True)
hist(im.flatten(), 128, normed=True)

subplot(2, 2, 4)
axis('off')
title(u'Histogram after equalization', fontproperties=font)
#hist(im2.flatten(), 128, cumulative=True, normed=True)
hist(im2.flatten(), 128, normed=True)

show()
Operation result
4. SciPy module
SciPy is an open source math toolkit, which is based on NumPy. It provides many effective routine operations, including numerical synthesis, optimization, statistics, signal processing and image processing. As shown next, the SciPy library contains many useful modules.
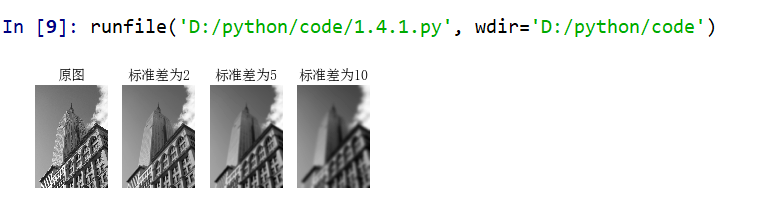
4.1 Gaussian blur
Gaussian blur can be used to define image scale, calculate interest points and many other applications.
code implementation
 # -*- coding: utf-8 -*-
from PIL import Image
from pylab import *
from scipy.ndimage import filters

# Add Chinese font support
from matplotlib.font_manager import FontProperties
font = FontProperties(fname=r"c:\windows\fonts\SimSun.ttc", size=14)

#im = array(Image.open('board.jpeg'))
im = array(Image.open('D:\\python\pcv_data\data\empire.jpg').convert('L'))

figure()
gray()
axis('off')
subplot(1, 4, 1)
axis('off')
title(u'Original graph', fontproperties=font)
imshow(im)

for bi, blur in enumerate([2, 5, 10]):
  im2 = zeros(im.shape)
  im2 = filters.gaussian_filter(im, blur)
  im2 = np.uint8(im2)
  imNum=str(blur)
  subplot(1, 4, 2 + bi)
  axis('off')
  title(u'Standard deviation is'+imNum, fontproperties=font)
  imshow(im2)

#If it is a color image, blur the three channels respectively
#for bi, blur in enumerate([2, 5, 10]):
#  im2 = zeros(im.shape)
#  for i in range(3):
#    im2[:, :, i] = filters.gaussian_filter(im[:, :, i], blur)
#  im2 = np.uint8(im2)
#  subplot(1, 4,  2 + bi)
#  axis('off')
#  imshow(im2)

show()
Operation result
The first image is to be blurred, the second image is to be blurred with a Gaussian standard deviation of 2, the third image is to be blurred with a Gaussian standard deviation of 5, and the last image is to be blurred with a Gaussian standard deviation of 10.