Introduction to K-means clustering algorithm
k-means clustering algorithm is an iterative clustering analysis algorithm. It is also regarded as unsupervised learning, the simplest clustering algorithm.
The overall idea is to divide the data into K groups, randomly select K objects as the initial cluster center, then calculate the distance between each object and each seed cluster center, and assign each object to the nearest cluster center. Cluster centers and the objects assigned to them represent a cluster. Each time a sample is allocated, the cluster center of the cluster will be recalculated according to the existing objects in the cluster.
This process will be repeated until a termination condition is met. The termination condition can be that no (or minimum number) objects are reassigned to different clusters, no (or minimum number) cluster centers change again, and the sum of squares of errors is locally minimum.
Next, the clustering algorithm, handwriting and library function call are realized in two ways.
K-means comprehensible writing
This is an assignment for my friend who has a very good relationship. It's relatively simple, but he still can't. Really, can he think of improving himself? He's a junior and still in this wave. Their teacher's purpose is to understand the process of K-means clustering algorithm and write it yourself. The main goal is to complete the mine_align(), and hero_ The two functions of move () are also the two most critical parts of the k-means. Take the title as an example, let's explain it below.
# For commercial reprint, please contact the author for authorization, and for non-commercial reprint, please indicate the source.
# For commercial use, please contact the author for authorization. For non-commercial use, please indicate the source.
# License: signature - non-commercial use - sharing in the same way (CC BY-NC-SA 4.0)
# Author:
# Link (URL): http://begin.hjnodm.com/index.php/2021/10/18/k-means/
# Source:

import numpy as np
import matplotlib.pyplot as plt
import random
import time


class Map():
    def __init__(self, num_mine, num_hero):
        self.num_mine = num_mine
        self.num_hero = num_hero
        self.mines = []
        self.heros = []
        self.init_map()

    def init_map(self):
        for i in range(self.num_mine):
            x = random.random()
            y = random.random()
            self.mines.append([x, y])
        for j in range(self.num_hero):
            x1 = random.random()
            y1 = random.random()
            self.heros.append([x1, y1])

    def hero_move(self):
        #Recalculate centroid
        for center in self.result_c:
            self.heros[center] = np.average(self.result_c[center], axis=0)
    def mine_align(self):
        #What are the classification points to which the current centroid point belongs
        self.result_c = {}
        for i in range(self.num_hero):
            self.result_c[i] = []
        for it in self.mines:
            distance = []
            for center in self.heros:
                distance.append(np.linalg.norm(np.array(it) - np.array(center)))
            classification = distance.index(min(distance))
            self.result_c[classification].append(it)

    def map_visualization(self):
        tmp = np.array(self.mines)
        X = tmp[:, 0]
        Y = tmp[:, 1]
        plt.plot(X, Y, 'b*')
        tmp = np.array(self.heros)
        X = tmp[:, 0]
        Y = tmp[:, 1]
        plt.plot(X, Y, 'ro')

        plt.show()


def main():
    map = Map(num_mine=100, num_hero=3)
    while True:
        map.mine_align()
        map.hero_move()
        map.map_visualization()
        time.sleep(3)


if __name__ == '__main__':
    main()
mine_ The align () function mainly completes the arrangement of ores (classification points) at this stage. I prefer to call it classification. Its function is to calculate the distance between each classification point and hero point (centroid point), and select the one with the smallest distance as the category of the classification point according to the result. Then iterate this process to get the hero category corresponding to all ores. The key functions are as follows.
np.linalg.norm(np.array(it) - np.array(center))
#Find the distance between two points < / code > < / pre >
It uses the functions in numpy library. Its original function is to find the norm and calculate the vector norm. It is simply used to calculate the distance between two points.
hero_ The function of move() is to calculate the average value of all classification points (the point closest to the sum of the distances of all ores in the category) of the hero belonging to the original category again as the new coordinates of the hero according to the classification of ores after arrangement.
However, the template has no end condition, which is equivalent to that when the position of the final hero is no longer changed, but the program is still running. It should be combined with other game programs. If you simply write K-means algorithm, the end condition must be.
K-means library function writing
The following is my personal k-means algorithm using sklearn library function. The key point is to find the most appropriate K value for a data.
import numpy as np
from sklearn.cluster import KMeans
from sklearn.metrics import silhouette_score
import matplotlib.pyplot as plt
import pandas as pd
from pandas.plotting import andrews_curves
path = 'tf_idf.csv'
data = np.loadtxt(path, dtype=float, delimiter=',')
#Import data
print(data)
k = 33
model = KMeans(n_clusters=k)
model.fit(data)
#Determine the classified cluster, i.e. K value. Fit calculation
for index, label in enumerate(model.labels_, 1):
print("index:{}⑧⑧⑧⑧⑧label:{}".format(index, label))
#Print out each classification point and its cluster (category).
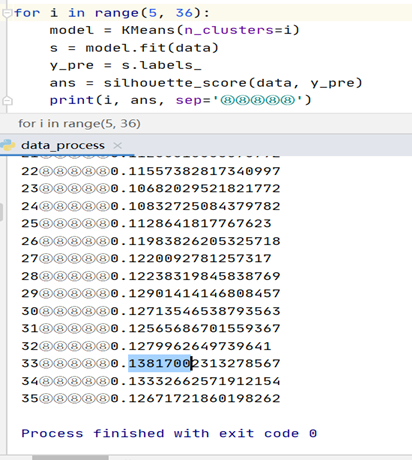
# for i in range(5, 36):
# model = KMeans(n_clusters=i)
# s = model.fit(data)
# y_pre = s.labels_
# ans = silhouette_score(data, y_pre)
# print(i, ans, sep='⑧⑧⑧⑧⑧')
#The key point is to find the optimal number of clusters of the data, that is, K value.
df = pd.read_csv(path, header=None)
df[3296] = model.labels_
print(df)
#Add a new column to represent its label value, namely label
plt.figure()
andrews_curves(df, 3296)#There are two visual representations, Andrew curve and radar chart, which are located in the pandas library. If you want to know, take a look at the last library imported above
plt.savefig('1.jpg')
plt.show()
#Save the picture and show it</ code></pre>
K-Means pursues to maximize the distance between clusters and minimize the distance within clusters. The commonly used is the contour coefficient. For a sample set, its contour coefficient is the average of all sample contour coefficients. The value range of contour coefficient is [- 1,1]. The closer the distance between samples of the same category is, the farther the distance between samples of different categories is, and the higher the score is. However, considering the actual situation, the contents of 143 texts are not much different. It is not easy to classify too many clusters, so choose the best value of K directly at 5-35. The data is finally selected 33.
Overall summary
From personal experience, beginners can write their code after learning the k-means algorithm, focusing on understanding. However, if handwriting is used, the data processing dimension may be low, which is a simple two-dimensional X and Y-axis problem. Three-dimensional data and four-dimensional data can be processed barely. When we have a certain understanding of the K-means, we use the library function to call the k-means algorithm, and the amount of data processed will also increase sharply. The advantages of the library function can also help us complete the task.