Learning objectives:
| 1. Understand and master the logistic regression classification method; 2. Master the effect evaluation of logistic regression model; 3. Master the application scenarios of decision tree classification. |
Learning content:
| 1. This experiment is the analysis and prediction of telecom customer churn rate. 2. Analyze whether users will be lost by analyzing users' packages, calls, traffic, behavior, contracts, associated purchases, service months, etc., and predict the loss possibility of some users, 3. You can launch some new policies or activities for retention according to the situation associated with the user. |
Study time:
1. 7 p.m. - 9 p.m. from Monday to Friday
2. Saturday 9 a.m. - 11 a.m
3. 3 p.m. - 6 p.m. Sunday
Learning output:
Hello, everyone! I'm honey. I want to share the classification with you today. I'm half ignorant and half understood. I have many questions. Let's have a look!
Before that, we should first understand the indicators for evaluating the quality of the model and what model is better for classification. Because there is more than one factor affecting the data results, we should use the decision tree to rank the root nodes. Hey! Anyway, I think so, and then talk about the meaning of some words of the evaluation model we use this time!
| 1. Logistic regression model and decision tree Decision tree classification principle decision tree is a process of classifying data through a series of rules. It provides a rule like method of what values will be obtained under what conditions. Decision tree is divided into classification tree and regression tree. Classification tree makes decision tree for discrete variables 2.AUC,fpr,tpr; AUC (Area Under Curve) is defined as the area enclosed by the coordinate axis under the ROC curve. Obviously, the value of this area will not be greater than 1. Since the ROC curve is generally above the line y=x, the value range of AUC is between 0.5 and 1. The closer the AUC is to 1.0, the higher the authenticity of the detection method; When it is equal to 0.5, the authenticity is the lowest and has no application value. TPR and FRP are commonly used indicators for classification and detection. TPR is the real rate and FPR is the false positive rate. They are all based on the measurement standard of confusion matrix. 3.ROC curve; The Chinese name of ROC is receiver operating characteristic curve, which originates from the radar signal analysis technology of World War II. ROC curve drawing: calculate the FPR and TPR of the model results respectively, and then draw the TPR as the ordinate and TPR as the abscissa to obtain the ROC curve. Each point on the ROC curve corresponds to a threshold |
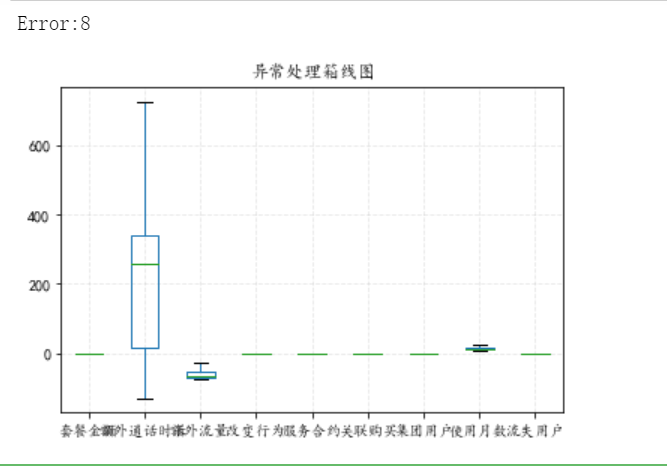
| 1. Data loading 2. Data analysis Use describe to handle data exceptions and process data give the result as follows
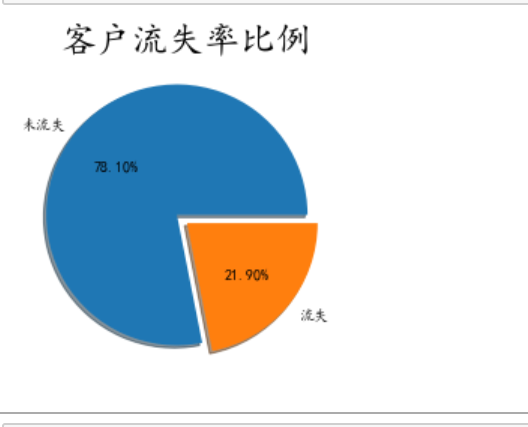
From the customer churn ratio chart, we can see that the customer churn ratio is about 21%, accounting for about 1 / 5 of the total customers. If we can reduce the number of customers, the enterprise will reach another height. Let's look at the specific factors causing customer churn
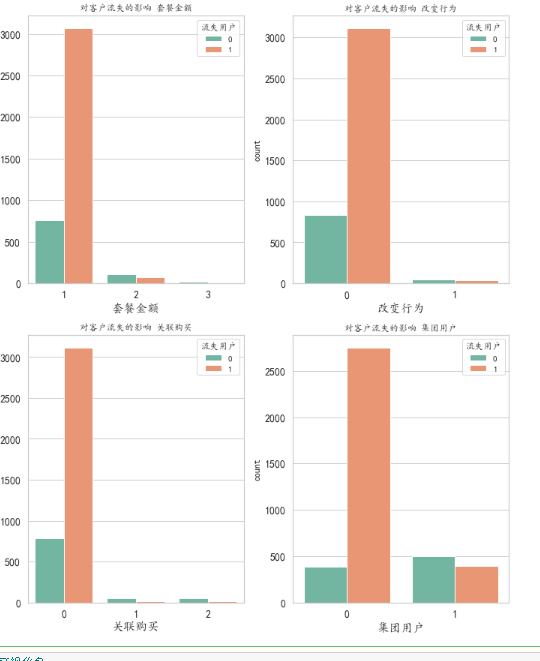
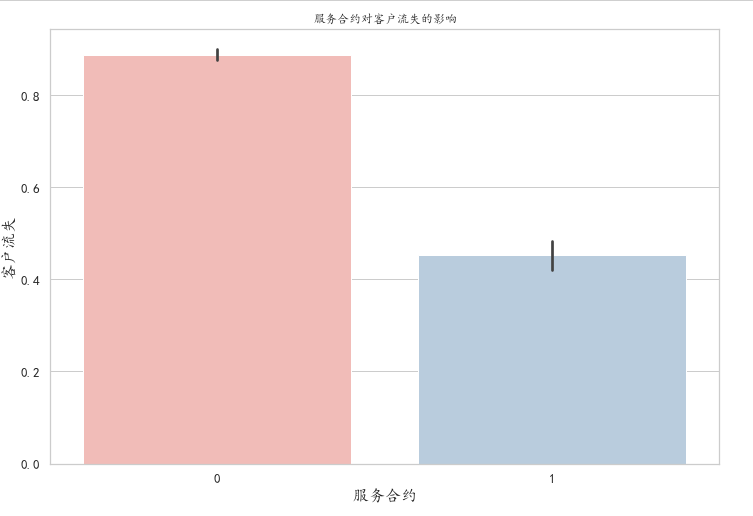
As can be seen from the chart, this is a factor that has a great impact on customers, especially the package amount Impact of signing a contract or not on customer churn
It can be seen from the histogram that the turnover rate of customers who have signed the contract is low, partly because the customers who choose to sign the contract are relatively stable, and also because the contract has a long-term constraint rate. When the customer signs the contract, preferential promotion can be carried out for the customers who sign the contract.
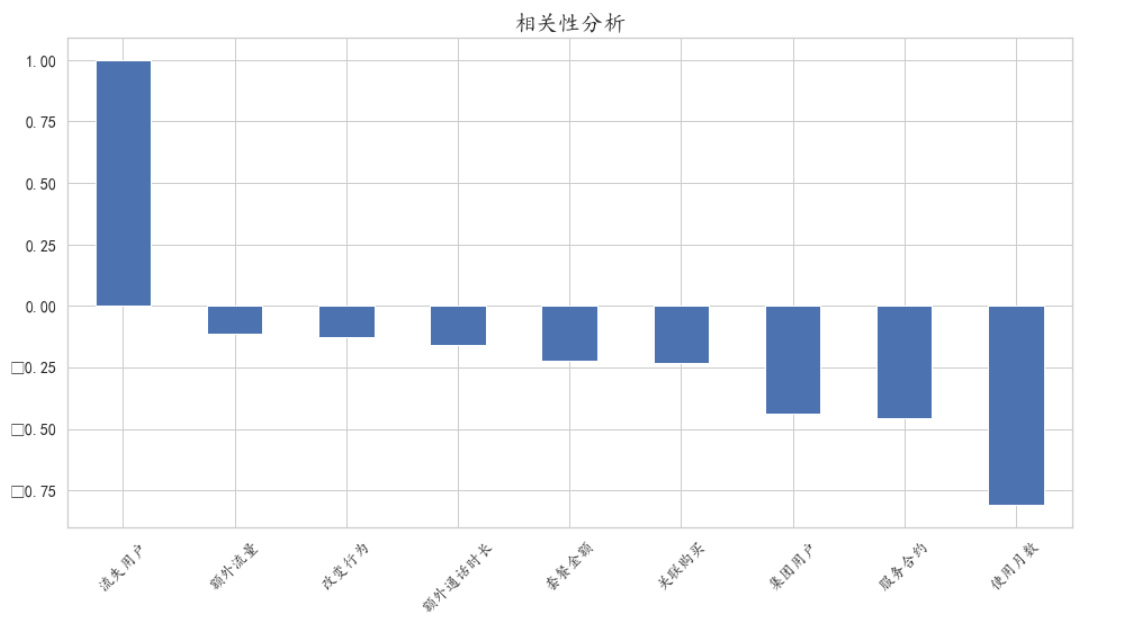
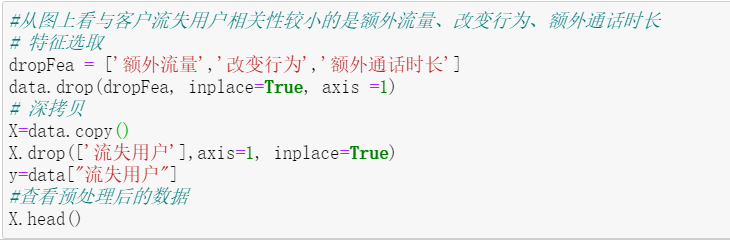
From the figure, the factors that are less relevant to the loss of customers are additional traffic, behavior change and additional call duration, so we can temporarily ignore these three factors when modeling Based on several factors with strong correlation, the data set is divided to prepare for the establishment of the following model
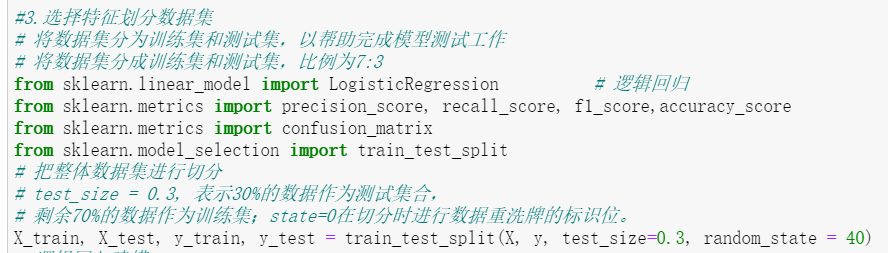
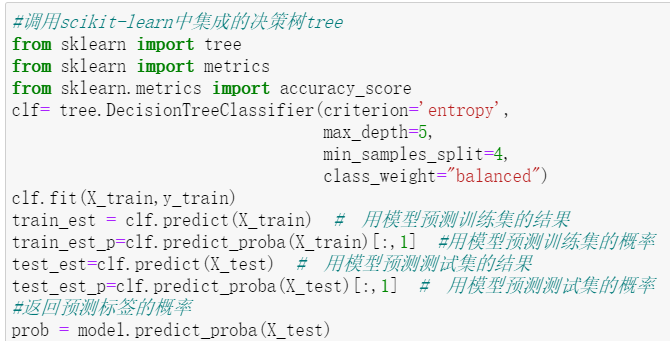
2. Prediction modeling (1) The decision tree is used to model on the training set.
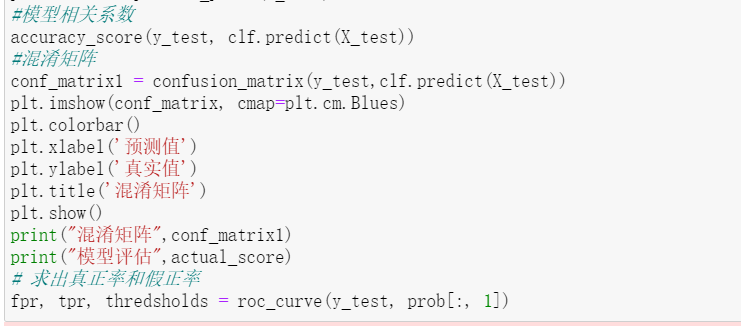
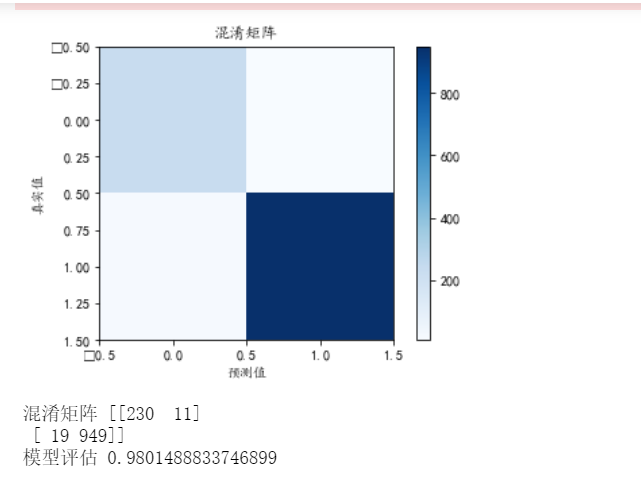
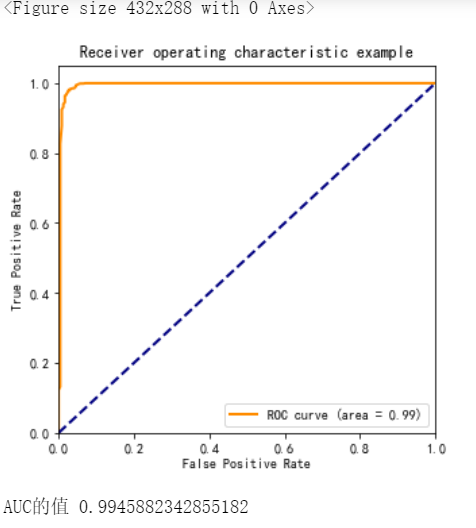
The confusion matrix and ROC curve are used to evaluate the model in the test set. We evaluate the model based on fpr, tpr, confusion matrix and roc
As we all know, the closer R^2 is to 1, the better the model is. From the perspective of R^2, the prediction rate of the model is still relatively good. It can also be seen from the confusion matrix that most of the predicted values (i.e. dark parts) are concentrated between 0.5 and 1.5, which shows that the accuracy of the model can indeed reach 98%
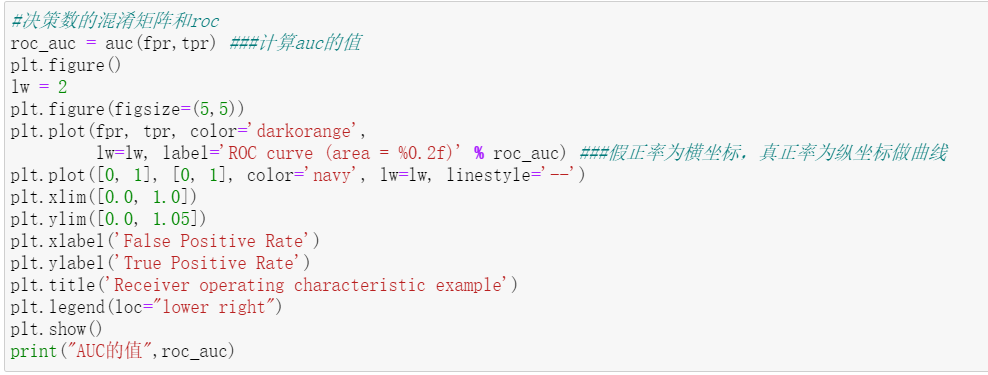
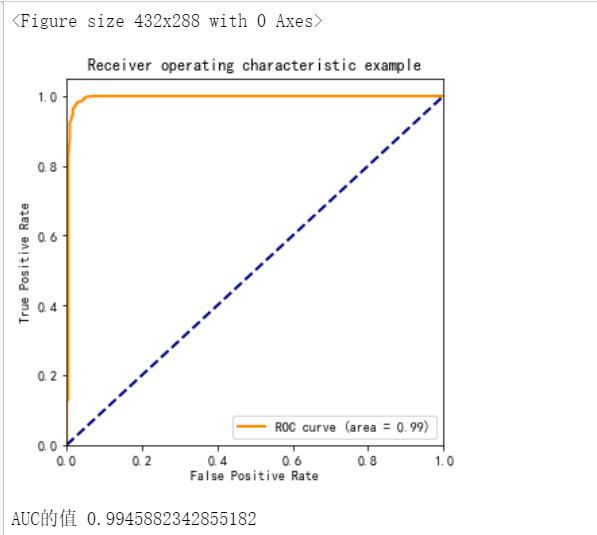
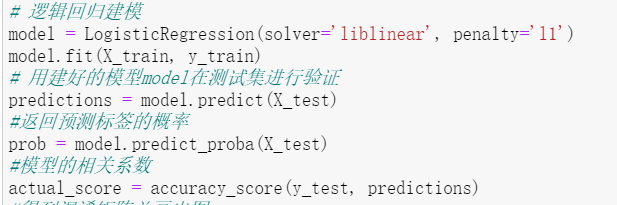
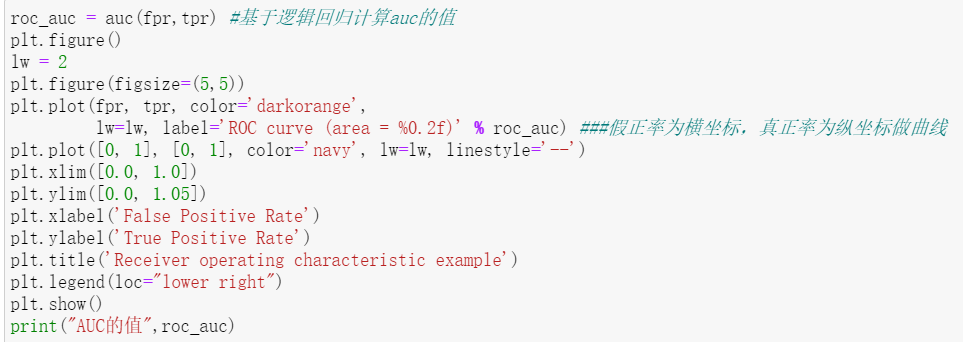
The same conclusion can be obtained from the AUC value of roc (2) Modeling of logistic regression algorithm on training set
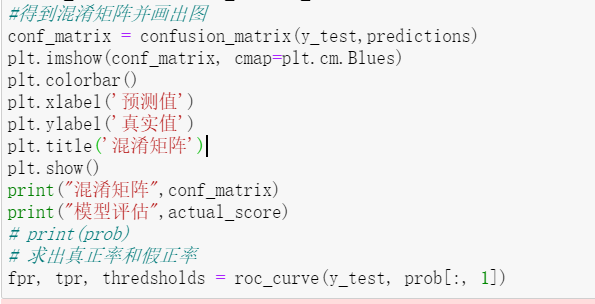
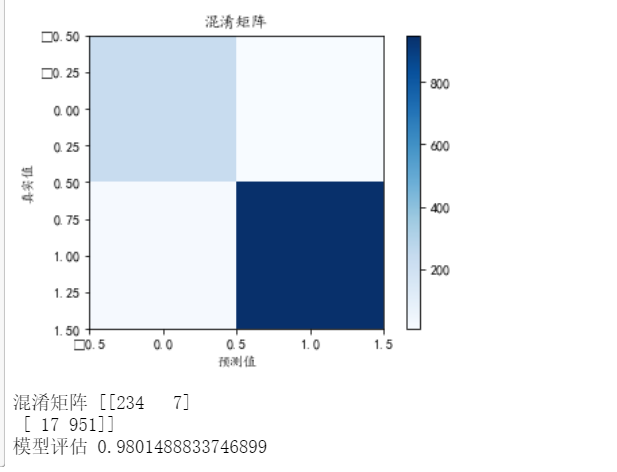
The confusion matrix and ROC curve are used to evaluate the model in the test set.
From the prediction test results of the above two models, we can find that in fact, the prediction accuracy of the two models is similar, and the accuracy can reach 98%. Summary of results After a series of analysis, we can find that there are many external factors affecting customer churn, but the customer churn rate of signed contracts will be particularly low. Therefore, what we need to do is to increase preferential efforts, develop more signed users and firmly grasp old users. Therefore, gradient stratification of preferential policies may be carried out, and preferential policies for those in dispute may get twice the result with half the effort. Let's share it here today! No, this code reference is not easy to use. It's not as good as my picture! |