Author: ye Jinrong, co-founder of zhishutang, and co-founder of 3306pai community
Preface
What causes the util and iowait of disk I/O of online database server to keep soaring?
1. Problem description
A friend Xiaoming's online database gave a serious alarm. The business side reported that writing data was blocked all the time. Many locks rolled back after timeout. I didn't know what happened, so I found him.
No matter 3721, first collect the necessary information of the scene.
a. System load, mainly the load data of disk I/O
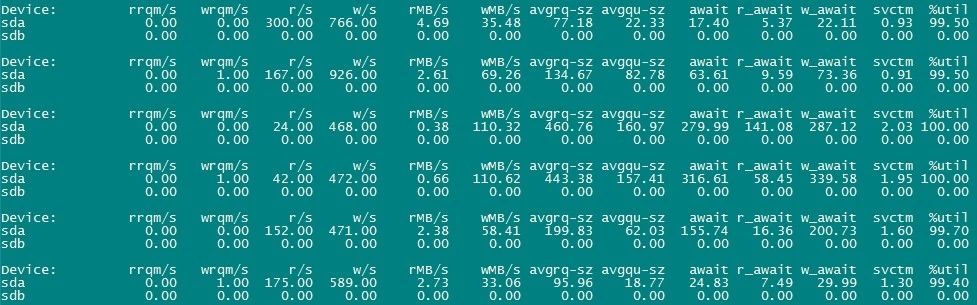
The disk of the server is a RAID-5 array composed of six 2T SSD hard disks. From the above screenshot, I/O% util is almost full, and iowait is also very high. Obviously, disk I/O pressure is too high. Then find out what causes the high pressure.
b. Active transaction list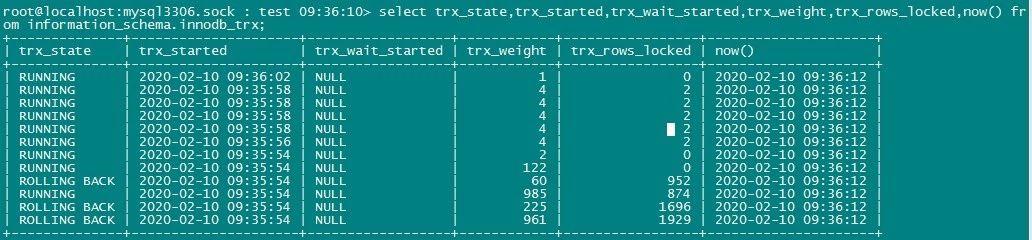
As you can see, there are several active transactions with high cost and many rows locked. Two of them were rolled back because they timed out too long.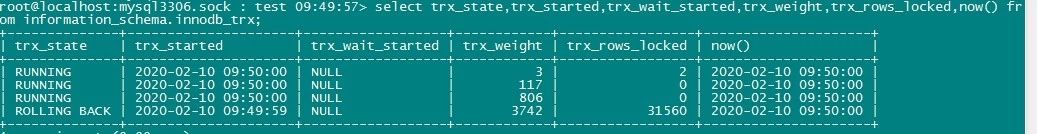
Looking at the active transaction list again, we find that there are more rows locked by transactions, which indicates that the efficiency of active business SQL is not very good and needs to be optimized. This is one of the reasons. Write it down first.
c. View InnoDB status
Execute SHOW ENGINE INNODB STATUS\G to view InnoDB status. Here are only a few key points:
...
0x7f8f700e9700 INNODB MONITOR OUTPUT
...
LATEST DETECTED DEADLOCK
------------------------
...
*** (2) TRANSACTION:
TRANSACTION 52970892097, ACTIVE 1 sec starting index read
mysql tables in use 2, locked 2
80249 lock struct(s), heap size 9691344, 351414 row lock(s),
 undo log entries 30005
 ### It is clear here that one of the transactions with deadlock holds many row locks and needs to optimize SQL
 ...
 update a inner join b on a.uid=b.uid set a.kid=if(b.okid=0,b.kid,b.okid),a.aid=b.aid where a.date='2020-02-10'
 ...
 TRANSACTIONS
 ------------
 Trx id counter 52971738624
 Purge done for trx's n:o < 52971738461 undo n:o < 0
 state: running but idle
 History list length 81
 ...
 ---TRANSACTION 52971738602, ACTIVE 0 sec inserting
 mysql tables in use 1, locked 1
 1 lock struct(s), heap size 1136, 0 row lock(s),
 undo log entries 348
 ### Also, there are many row locks
 ...
 LOG
 ---
 Log sequence number 565123876918590
 Log flushed up to   565123858946703
 Pages flushed up to 565121518602442
 Last checkpoint at  565121518602442
 ...
 ### Note that the gap between Last checkpoint and LSN is very large, about 2249MB
 ### This indicates that the checkpoint of redo log has severe delay, which may be due to the slow disk I/O,
 ### It is also possible that there are too many dirty pages generated too fast to refresh
 ----------------------
 BUFFER POOL AND MEMORY
 ----------------------
 Total large memory allocated 201200762880
 Dictionary memory allocated 130361859
 Internal hash tables (constant factor + variable factor)        Adaptive hash index 3930999872      (3059599552 + 871400320)
     Page hash           23903912 (buffer pool 0 only)
     Dictionary cache    895261747       (764899888 + 130361859)
     File system         16261960        (812272 + 15449688)
     Lock system         478143288       (478120568 + 22720)
     Recovery system     0       (0 + 0)
Buffer pool size   11795040
Buffer pool size, bytes 193249935360
Free buffers       7035886
Database pages     4705977O
ld database pages 1737005
Modified db pages  238613
### The proportion of dirty pages is about 2%. It looks good, and there are many free page s
...
d. View the thread status of MySQL*
+---------+------+--------------+---------------------
| Command | Time | State        | Info                                                                                                 |
+---------+------+--------------+---------------------
| Query   |    1 | update       | insert xxx
| Query   |    0 | updating     | update xxx
| Query   |    0 | updating     | update xxx
| Query   |    0 | updating     | update xxx
| Query   |    0 | updating     | update xxx
+---------+------+--------------+---------------------
You can see that several transactions are in the updating state. It means that when scanning data and preparing to update, when the transaction status is visible to the naked eye, it is generally because of the high system load, so the transaction execution is slow; or the transaction is waiting for the row lock to be released.
2. Problem analysis and optimization
By analyzing the above field information, we can get the following conclusions:
a. Disk I/O pressure is high. First, change the cache policy of the array card to WB, but since it is already SSD disk, this is not very effective. You can only apply for a new machine that is replaced with RAID-10 array, and you need to wait for resource allocation.
b. Need to optimize active SQL to reduce lock cost
[root@yejr.me]> desc  select * from a inner join b on a.uid=b.uid where a.date='2020-02-10';
+-------+--------+------+---------+----------+-------+----------+-----------------------+
| table | type   | key  | key_len | ref      | rows  | filtered | Extra                 |
+-------+--------+------+---------+----------+-------+----------+-----------------------+
| a     | ref    | date | 3       | const    | 95890 |   100.00 | NULL                  |
| b     | eq_ref | uid  | 4       | db.a.uid |     1 |   100.00 | Using index condition |
+-------+--------+------+---------+----------+-------+----------+-----------------------+
[root@yejr.me]> select count(*) from a inner join b on a.uid=b.uid where a.date='2020-02-10';
+----------+
| count(*) |
+----------+
|    40435 |
+----------+
1 row in set (0.22 sec)
Although the execution plan seems to be able to use indexes, it is not efficient. After checking, I found that the uid column of table a was not indexed. I was sweating...
c. InnoDB's redo log checkpoint has a large latency of 2249MB. First, check the settings of redo log:
innodb_log_file_size = 2G
innodb_log_files_in_group = 2
This is a big problem. The redo log is obviously too small. The redo waiting for checkpoint is more than 2G. It must be frantically scrubbing dirty pages, so the disk I/O write is so high. The I/O% util and iowait are also very high.
It is recommended to adjust redo log size to 4G and 3 groups.
innodb_log_file_size = 4Ginnodb_log_files_in_group = 2
In addition, I also checked several other important options of InnoDB
innodb_thread_concurrency = 0
# It is recommended to keep the setting 0 unchanged
innodb_max_dirty_pages_pct = 50
# Due to the large amount of writes per second in this instance, it is recommended to adjust to 75 first to reduce the frequency of dirty pages,
# By the way, relieve the pressure of redo log checkpoint.
# In this case, we finally adjusted the value to 90.
Special reminder
From MySQL 5.6, after modifying the redo log settings, the instance will automatically complete the reinitialization of the redo log when it is restarted, but only if the instance is shut down cleanly. Therefore, it is recommended that you modify the following two options the first time you close:
innodb_max_dirty_pages_pct = 0
innodb_fast_shutdown = 0
In addition, a new option is added to prevent external applications from connecting to write data after the instance is started:
skip-networking
After ensuring that all dirty pages (Modified db pages seen above are 0) are flushed, and the redo log is also checkpointed (the value of Log sequence number * * and Last checkpoint at * * seen above are equal), you can safely modify the InnoDB log file size option configuration and restart. After confirmation, turn off the skip Networking Option to provide services for the business.
After some optimization and adjustment, let's look at the load of the server and database. A kind of
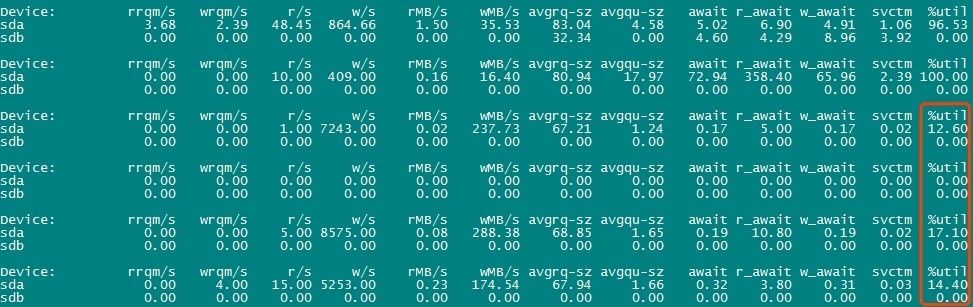
As you can see, the disk I/O pressure of the server is no longer so great, and a large number of row lock waiting or rolling back transactions will not occur frequently in the database.
[root@yejr.me]> SHOW ENGINE INNODB STATUS\g
Log sequence number 565749866400449
Log flushed up to   565749866400449
Pages flushed up to 565749866318224
Last checkpoint at  565749866315740
[root@yejr.me]> SHOW ENGINE INNODB STATUS\g
Log sequence number 565749866414660
Log flushed up to   565749866400449
Pages flushed up to 565749866320827
Last checkpoint at  565749866315740
[root@yejr.me]> SHOW ENGINE INNODB STATUS\g
Log sequence number 565749866414660
Log flushed up to   565749866414660
Pages flushed up to 565749866322135
Last checkpoint at  565749866315740
[root@yejr.me]> select (565749866400449-565749866315740)/1024;
+----------------------------------------+
| (565749866400449-565749866315740)/1024 |
+----------------------------------------+
|                                82.7236 |
+----------------------------------------+
1 row in set (0.00 sec)
[root@yejr.me]> select (565749866414660-565749866315740)/1024;
+----------------------------------------+
| (565749866414660-565749866315740)/1024 |
+----------------------------------------+
|                                96.6016 |
+----------------------------------------+
Obviously, there is almost no redo log checkpoint lag.
Perfect!
Written in the end
In case of database performance bottleneck and high load, we only need a complete set of methodology Optimization series: instance analysis, MySQL performance bottleneck troubleshooting and positioning According to all kinds of clues on site, we can basically find out the cause of the problem by analyzing them one by one. In fact, this case is not difficult. It is done according to this method. In the end, if perf top is not used, the cause of the problem can be roughly determined soon.