order
The best way to represent data depends not only on the semantics of the data, but also on the type of model used. linear model With tree based models (e.g Decision tree,Gradient lifting tree and Random forest )It is a very common model with many members. They have very different properties when dealing with different feature representations. We first train a data set with linear model and decision tree.
PS: linear model and Decision tree The model has been explained before. If you are interested, you can click the relevant links to have a look. I won't repeat it here.
Training model
1. Data sources
Bisection data of first person fps game csgo: https://www.kaggle.com/sp1nalcord/mycsgo-data
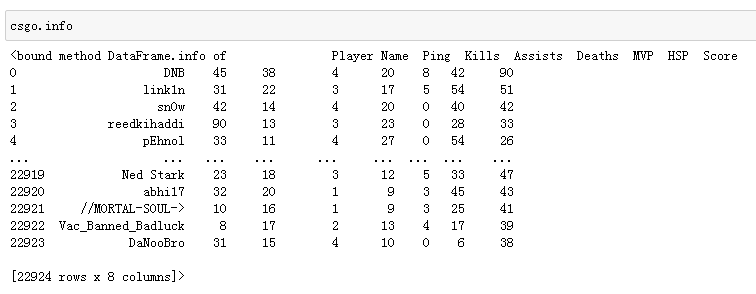
csgo is a first person shooting game. The data includes each player's network delay (ping), number of kills, number of deaths, score, etc.
Hey, hey, I still know a lot about the game. This is the only blogger who can understand the data set of all dimensions without reading the English introduction of the original data.
2. Read file
import pandas as pd
import winreg
real_address = winreg.OpenKey(winreg.HKEY_CURRENT_USER,r'Software\Microsoft\Windows\CurrentVersion\Explorer\Shell Folders',)
file_address=winreg.QueryValueEx(real_address, "Desktop")[0]
file_address+='\\'
file_origin=file_address+"\\Source data-analysis\\model_data.csv"
csgo=pd.read_csv(file_origin)#https://www.kaggle.com/sp1nalcord/mycsgo-data
Because it is troublesome to transfer the file to the python root directory or to the download folder after downloading the data every time. Therefore, I set up the absolute desktop path through the winreg library. In this way, as long as I download the data to the desktop or paste it into a specific folder on the desktop to read it, I won't be confused with other data.
In fact, this step is a process. Basically, every data mining has to be done again. There is nothing to say.
3. Cleaning data
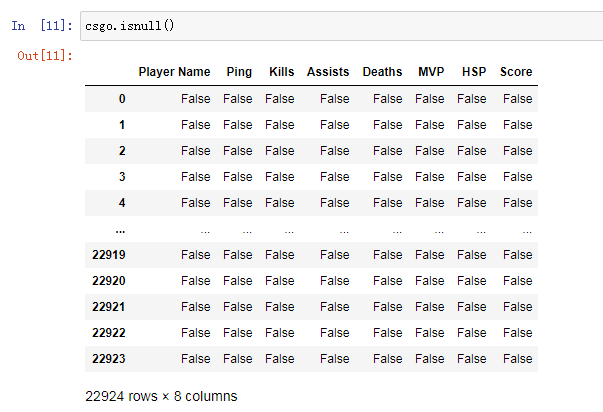
It can be seen that the data does not include missing values, and there is no attribute overlap between characteristic values, so no processing is required for the time being.
4. Modeling
import numpy as np
from sklearn.model_selection import train_test_split
from sklearn.tree import DecisionTreeRegressor#Decision tree
from sklearn.linear_model import LinearRegression#linear model
from sklearn.metrics import r2_score
X_train,X_test,y_train,y_test=train_test_split(csgo[["Ping","Kills","Assists","Deaths","MVP","HSP"]],csgo["Score"],random_state=1)
LR=LinearRegression()
LR.fit(X_train,y_train)
prediction=LR.predict(X_test)
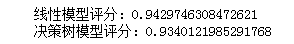
print("Linear model score:"+str(r2_score(y_test,prediction)))
tree=DecisionTreeRegressor(min_samples_split=300)
tree_prediction=tree.fit(X_train,y_train).predict(X_test)
print("Decision tree model score:"+str(r2_score(y_test,tree_prediction)))
The results are as follows:
Sub box
As we all know, linear models can only be modeled for linear relationships. For a single feature, it is a straight line. Decision tree can build more complex data model, but it strongly depends on data representation. There is a way to make linear models more powerful on continuous data. Feature separation (also known as discretization) is used to divide it into multiple features.
We assume that the input range of features (in the above data set, we only consider the kills feature) is divided into a fixed number of boxes, such as 9, so the data points can be represented by the box in which they are located. To determine this, we first need to define the box. In the above data set, we define 9 evenly distributed boxes between - 4 and 64 according to the maximum and minimum values in the kills feature. We use the np.linspace function to create 9 boxes, that is, the space between two continuous boundaries:
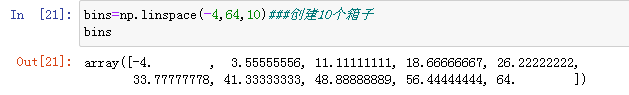
Here, the first box contains all data points with eigenvalues between - 4 and 3.56, and the second box contains eigenvalues between 3.56
Next, we record the box to which each data point belongs. This can be easily calculated with the np.digitize function:
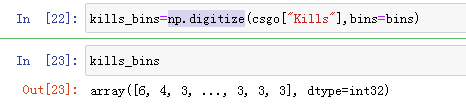
What we do here is to transform the continuous input features (kills) in the data set into a classification feature to represent the box where the data points are located. To use the scikit learn model on this data, we use pd.get_dummies transforms this discrete feature into a single heat coding.
PS: Unique heat coding I have already said the content of. If you are interested, you can click the relevant links to have a look. I won't repeat it here.
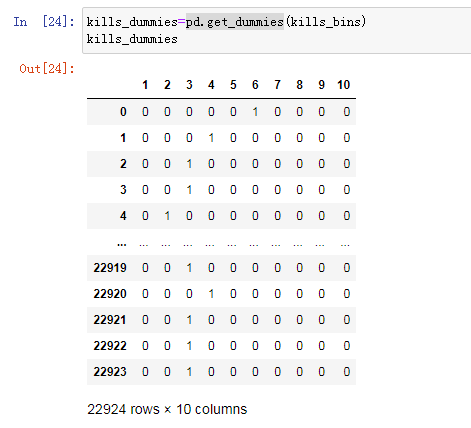
Since we specify 10 elements, the transformed eigenvalue contains 10 features.
Retraining
Next, we build a new linear model and a new decision tree model on the data after independent heat coding:
binned=pd.concat([csgo[["Ping","Kills","Assists","Deaths","MVP","HSP"]],kills_dummies],axis=1,ignore_index=False)###Merge two dataframe s
X_train,X_test,y_train,y_test=train_test_split(binned,csgo["Score"],random_state=1)
LR=LinearRegression()
LR.fit(X_train,y_train)
prediction=LR.predict(X_test)
print("Linear model score:"+str(r2_score(y_test,prediction)))
tree=DecisionTreeRegressor(min_samples_split=300)
tree_prediction=tree.fit(X_train,y_train).predict(X_test)
print("Decision tree model score:"+str(r2_score(y_test,tree_prediction)))
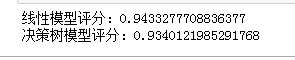
It can be seen that the accuracy of the linear model is higher than before (the more unsuitable the data set is for the linear model, the better the box splitting effect.) while the score of the decision tree model is unchanged. For each box, both predict a constant value. Because the characteristics in each box are constant, any model will predict the same value for all points in a box. Comparing the contents of the model before and after the feature box division, we find that the linear model becomes more flexible, because it now has different values for each box, and the flexibility of the decision tree model is reduced. The box feature usually does not have a better effect on the tree based model, because this model can learn to divide data at any location. In a sense, the decision tree can learn how to divide boxes, which is most useful for predicting these data. In addition, the decision tree views multiple features at the same time, while the box is usually for a single feature value. However, the expressiveness of linear model has been greatly improved after data transformation.
For a specific data set, if there is a good reason to use a linear model - for example, the data set is large, the dimension is high, but the relationship between some features and the output is nonlinear - then binning is a good way to improve the modeling ability.
Personal blog: https://www.yyb705.com/
Welcome to my personal blog. There are not only technical articles, but also internalized notes of a series of books.
There are many places that are not doing very well. Welcome netizens to put forward suggestions, and hope to meet some friends to exchange and discuss together.