Demand Background:
Business development is more and more huge, and servers are more and more.
There are more and more access logs, application logs and error logs, which make the operation and maintenance personnel unable to manage the logs well.
It is inconvenient for the developer to check the logs on the server.
Operators need some data and we need to run and maintain it to the server to analyze the logs.
Why use ELK:
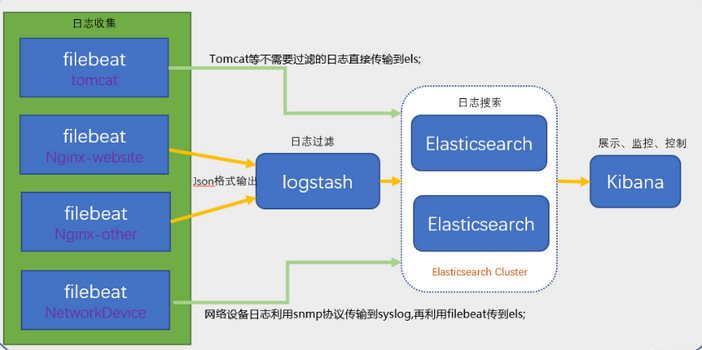
In general, we need to do log analysis scenarios: we can get the information we want directly in the log file grep, awk. But in larger scale scenarios, where logs are large and complex,
This method is inefficient and faces many problems, such as how to archive too many logs, how to search text too slowly, and how to query multi-dimensionally. Centralized log management is required, and logs on all servers are collected and aggregated.
The common solution is to establish a centralized log collection system, which collects, manages and accesses logs on all nodes.

Large-scale systems are usually distributed deployment architectures. Different service modules are deployed on different servers. When problems arise, most of the cases need to expose key information according to the problems.
To locate specific server and service modules and build a centralized log system can improve the efficiency of locating problems.

A complete centralized logging system needs to include the following main features:

Collection - The ability to collect log data from multiple sources
 Transport - The ability to stably transfer log data to the central system
 Storage - How to Store Log Data
 Analysis - UI analysis can be supported
 Warning - error reporting, monitoring mechanism

ELK provides a whole set of solutions, and all of them are open source software, which can be used in conjunction with each other, perfectly linking up and efficiently satisfying the application of many occasions. At present, it is a mainstream log system.
ELK introduction:
ELK is the abbreviation of three open source software: Elastic search, Logstash and Kibana. They are all open source software. But now there's a new Beats.
It is a lightweight Log Collection and Processing Tool (Agent). Beats occupy less resources and are suitable for transferring logs to Logstash after searching for logs on various servers. Officials also recommend this tool.
At present, the original ELK Stack member has been renamed Elastic Stack because of the addition of Beats tools.
Elastic Stack contains:
Elastic search is an open source distributed search engine, which provides three functions: collecting, analyzing and storing data. Its characteristics are: distributed, zero configuration, automatic discovery, automatic index segmentation.
Index copy mechanism, restful style interface, multiple data sources, automatic search load, etc. Refer to the Elastic search authoritative guide for details.

Logstash is mainly used to collect, analyze and filter logs, supporting a large number of data acquisition methods. The general working mode is c/s architecture. client end is installed on the host that needs to collect logs.
The server side is responsible for filtering and modifying the logs received by each node and sending them to elastic search.

Kibana is also an open source and free tool. Kibana can provide log analysis friendly Web interface for Logstash and Elastic Search, which can help aggregate, analyze and search important data logs.

Beats is a lightweight log collector here. In fact, Beats family has six members. Logstash is used to collect and parse logs in the early ELK architecture, but Logstash consumes a lot of resources such as memory, cpu and io.
Compared with Logstash, the CPU and memory of the Beats system are almost negligible.
Some components of ELK:
openjdk 1.8.0_191
ElasticSearch
Logstash
Kibana
Filebeat
ELK Stack (after version 5.0) - > Elastic Stack == (ELK Stack + Beats). Beats currently includes six tools:
Packetbeat: Network data (collecting network traffic data)
Metricbeat: Indicators (collecting system, process and file system level CPU and memory usage, etc.)
Filebeat: Log files (collecting file data)
Winlogbeat: Windows Event Log (Collecting Windows Event Log Data)
Auditbeat: Audit data (collection of audit logs)
Heartbeat: Runtime monitoring (collecting data on system runtime)
About the x-pack tool:
X-pack provides Elastic Stack with a security, alarm, monitoring, report and chart extension package, which is charged, so this article does not cover the installation of x-pack.
ELK related links:
ELK official website: https://www.elastic.co/cn/
Chinese Guide: https://www.gitbook.com/book/chenryn/elk-stack-guide-cn/details
Note: The above content comes from the network.
I. preparation
ELK Notes:
1. Master logstash principle, Elastic Search principle, Kibana visualization technology (here I use Grafana visualization)
2. When logstash, output is first output to the command console and then written to the configuration file if there is no problem.
3. There are many advantages in introducing redis or kanfa. In general, redis are competent, kanfa is too heavy.
1. Close firewalls and selinux
[root@iZj6c7bp1a289r04izstw4Z ~]# systemctl stop firewalld
[root@iZj6c7bp1a289r04izstw4Z ~]# systemctl disable firewalld
[root@iZj6c7bp1a289r04izstw4Z ~]# vi /etc/sysconfig/selinux
SELINUX=disabled
2. Installation of common tools, synchronization time
[root@iZj6c7bp1a289r04izstw4Z ~]# yum -y install lrzsz rdate wget vim net-tools ntpdate
[root@iZj6c7bp1a289r04izstw4Z ~]# rdate -s time-b.nist.gov
3. Change the maximum file descriptor, number of openings, number of processes
[root@iZj6c7bp1a289r04izstw4Z ~]# vim /etc/security/limits.conf
*    hard    nofile    65536
*    soft    nofile    65536
*    soft    nproc    65536
*    hard    nproc    65536
4. Modify the maximum number of open processes, minimum 2048
[root@iZj6c7bp1a289r04izstw4Z ~]# vim /etc/security/limits.d/20-nproc.conf
*          soft    nproc     4096
5. Other settings
[root@iZj6c7bp1a289r04izstw4Z ~]# vim /etc/sysctl.conf
vm.max_map_count=655360
net.core.somaxconn=65535
net.ipv4.ip_forward = 1

[root@iZj6c7bp1a289r04izstw4Z ~]# sysctl -p
II. Installation of JDK Environment
It can be installed in yum, rpm, tar.gz, etc. For simplicity and simplicity, I install it directly in Yum mode (yum mode is recommended because it places java programs in directories such as / usr/bin).
The other two ways will cause the service to fail to start, and need to set environment variables, elk configuration files or do soft links.

[root@iZj6c7bp1a289r04izstw4Z ~]# yum install java-1.8.0-openjdk -y
[root@localhost ~]# java -version
openjdk version "1.8.0_191"
OpenJDK Runtime Environment (build 1.8.0_191-b12)
OpenJDK 64-Bit Server VM (build 25.191-b12, mixed mode)
III. Installation of ELK
1. Configuring yum sources
[root@iZj6c7bp1a289r04izstw4Z ~]# rpm --import https://artifacts.elastic.co/GPG-KEY-elasticsearch
[root@iZj6c7bp1a289r04izstw4Z ~]# vim /etc/yum.repos.d/elk.repo
[elk-6]
name=elk-6
baseurl=https://artifacts.elastic.co/packages/6.x/yum
gpgcheck=1
gpgkey=https://artifacts.elastic.co/GPG-KEY-elasticsearch
enabled=1

[root@iZj6c7bp1a289r04izstw4Z ~]# yum clean all
[root@iZj6c7bp1a289r04izstw4Z ~]# yum makecache
2. Installation of ELK
[root@iZj6c7bp1a289r04izstw4Z ~]# yum install elasticsearch logstash kibana filebeat -y
 Note: Of course, elk can be installed in rpm, tar.gz and other ways besides using Yum mode. Since the default Yum installation is the same as other versions, I chose to use yum.

The rpm package links are as follows:
https://artifacts.elastic.co/downloads/elasticsearch/elasticsearch-6.6.1.rpm
https://artifacts.elastic.co/downloads/logstash/logstash-6.6.1.rpm
https://artifacts.elastic.co/downloads/kibana/kibana-6.6.1-x86_64.rpm
https://artifacts.elastic.co/downloads/beats/filebeat/filebeat-6.6.1-x86_64.rpm
IV. Configuring ELK
1. Configure elastic search
[root@iZj6c7bp1a289r04izstw4Z ~]# rpm -qc elasticsearch
/etc/elasticsearch/elasticsearch.yml
/etc/elasticsearch/jvm.options
/etc/elasticsearch/log4j2.properties
/etc/elasticsearch/role_mapping.yml
/etc/elasticsearch/roles.yml
/etc/elasticsearch/users
/etc/elasticsearch/users_roles
/etc/init.d/elasticsearch
/etc/sysconfig/elasticsearch
/usr/lib/sysctl.d/elasticsearch.conf
/usr/lib/systemd/system/elasticsearch.service

[root@iZj6c7bp1a289r04izstw4Z ~]# vim /etc/elasticsearch/elasticsearch.yml
path.data: /var/lib/elasticsearch
path.logs: /var/log/elasticsearch
cluster.name: ELK
node.name: node-1
network.host: 0.0.0.0
http.port: 9200
discovery.zen.ping.unicast.hosts: ["192.168.1.104:9300"]
discovery.zen.minimum_master_nodes: 1

[root@iZj6c7bp1a289r04izstw4Z ~]# systemctl daemon-reload
[root@iZj6c7bp1a289r04izstw4Z ~]# systemctl enable elasticsearch
[root@iZj6c7bp1a289r04izstw4Z ~]# systemctl restart elasticsearch
[root@iZj6c7bp1a289r04izstw4Z ~]# systemctl status elasticsearch
[root@iZj6c7bp1a289r04izstw4Z ~]# ps aux |grep elasticsearch
[root@iZj6c7bp1a289r04izstw4Z ~]# netstat -nltp | grep java
tcp        0      0 0.0.0.0:9200            0.0.0.0:*               LISTEN      1776/java
tcp        0      0 0.0.0.0:9300            0.0.0.0:*               LISTEN      1776/java

[root@iZj6c7bp1a289r04izstw4Z ~]# curl -X GET http://localhost:9200
{
  "name" : "node-1",
  "cluster_name" : "ELK",
  "cluster_uuid" : "egGlhWnESzeeUalJ2FXUuA",
  "version" : {
    "number" : "6.6.1",
    "build_flavor" : "default",
    "build_type" : "rpm",
    "build_hash" : "1fd8f69",
    "build_date" : "2019-02-13T17:10:04.160291Z",
    "build_snapshot" : false,
    "lucene_version" : "7.6.0",
    "minimum_wire_compatibility_version" : "5.6.0",
    "minimum_index_compatibility_version" : "5.0.0"
  },
  "tagline" : "You Know, for Search"
}
2. Configuring kibana
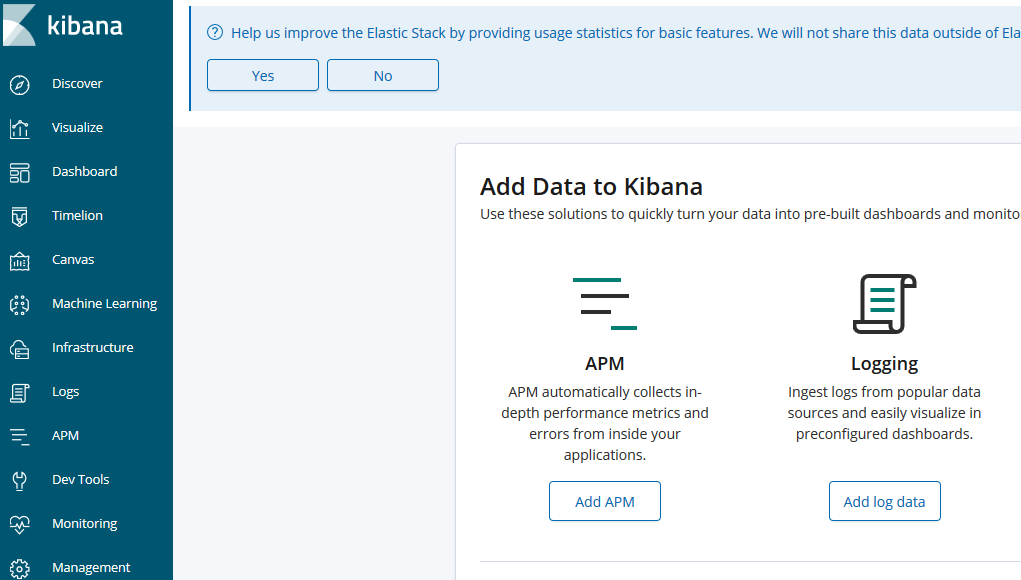
[root@iZj6c7bp1a289r04izstw4Z ~]# rpm -qc kibana
/etc/kibana/kibana.yml

[root@iZj6c7bp1a289r04izstw4Z ~]# vi /etc/kibana/kibana.yml
server.port: 5601
server.host: "0.0.0.0"
elasticsearch.url: "http://localhost:9200"
logging.dest: /var/log/kibana.log

#Create log files:
[root@master-node ~]# touch /var/log/kibana.log; chmod 777 /var/log/kibana.log
[root@iZj6c7bp1a289r04izstw4Z ~]# systemctl start kibana
[root@iZj6c7bp1a289r04izstw4Z ~]# systemctl status kibana
[root@iZj6c7bp1a289r04izstw4Z ~]# ps aux |grep kibana
[root@iZj6c7bp1a289r04izstw4Z ~]# netstat -lntp |grep 5601
tcp        0      0 0.0.0.0:5601            0.0.0.0:*               LISTEN      6030/node
//Note: Since kibana was developed using node.js, the process name is node.
//Then access it in the browser, such as: http://172.31.116.244:5601/, because we did not install x-pack, so there is no user name and password at this time, can be directly accessed:
If you need password authentication, you need to install plug-ins, but plug-ins seem to be charged.
//However, you can install nginx and authentication module, then proxy kibana can be, the specific steps are as follows:

[root@iZj6c7bp1a289r04izstw4Z ~]# yum -y install epel-release   #Install epel source
[root@iZj6c7bp1a289r04izstw4Z ~]# yum -y install nginx httpd-tools   #Install Nginx, httpd user authentication tools
[root@iZj6c7bp1a289r04izstw4Z ~]# vim /etc/nginx/nginx.conf   #Notes are as follows
[root@iZj6c7bp1a289r04izstw4Z ~]# vim /etc/nginx/conf.d/kibana.conf
server {
        listen  5666;
        server_name     kibana;
        auth_basic      "Restricted Access";
        auth_basic_user_file    /etc/nginx/kibana-user;
        location / {
            proxy_pass http://localhost:5601;
            proxy_http_version 1.1;
            proxy_set_header Upgrade $http_upgrade;
            proxy_set_header Connection 'upgrade';
            proxy_set_header Host $host;
            proxy_cache_bypass $http_upgrade;
        }
}

[root@iZj6c7bp1a289r04izstw4Z ~]# htpasswd -cm /etc/nginx/kibana-user gxm
New password:
Re-type new password:
Adding password for user gxm

[root@iZj6c7bp1a289r04izstw4Z ~]# nginx -t
nginx: the configuration file /etc/nginx/nginx.conf syntax is ok
nginx: configuration file /etc/nginx/nginx.conf test is successful

[root@iZj6c7bp1a289r04izstw4Z ~]# systemctl start nginx
[root@iZj6c7bp1a289r04izstw4Z ~]# systemctl status nginx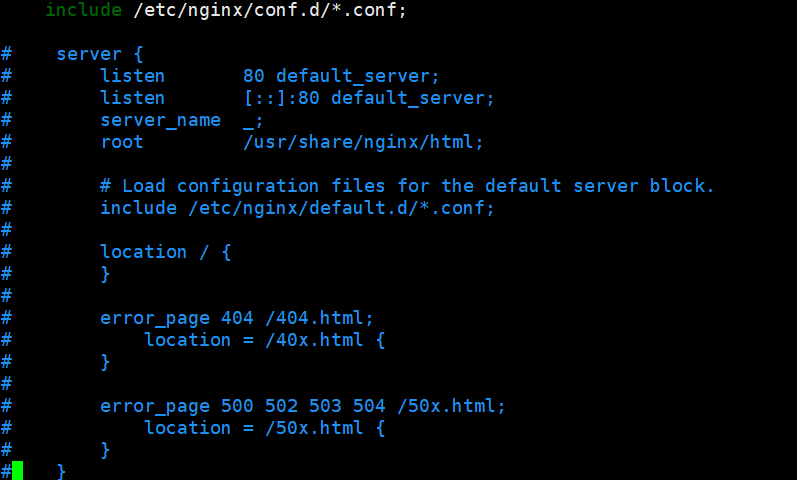
3. Configuring logstash
[root@iZj6c7bp1a289r04izstw4Z ~]# rpm -qc logstash
/etc/logstash/jvm.options
/etc/logstash/log4j2.properties
/etc/logstash/logstash-sample.conf
/etc/logstash/logstash.yml
/etc/logstash/pipelines.yml
/etc/logstash/startup.options

[root@iZj6c7bp1a289r04izstw4Z ~]# vim /etc/logstash/logstash.yml
path.config: /etc/logstash/conf.d
4. Test logstash scenario 1 (system log as input, output directly to terminal).
#Setting up syslog log configuration file
[root@iZj6c7bp1a289r04izstw4Z ~]# vim /etc/rsyslog.conf
#### RULES ####
*.* @172.31.116.244:10514

[root@data-node1 ~]# systemctl restart rsyslog
#Setting logstash configuration file
[root@iZj6c7bp1a289r04izstw4Z ~]# vim /etc/logstash/conf.d/syslog-01.conf
input {  #Define log sources
  syslog {
    type => "system-syslog"  #Define types
    port => 10514    #Define listening ports
  }
}
output {  #Define log output
  stdout {
    codec => rubydebug  #Export logs to the current terminal for display
  }
}

//Note: After installation, do not start the service, configure logstash to collect syslog logs (test only, later this file will be output).
#Detect whether the configuration file is wrong or not, and for ok, there is no problem representing the configuration file.
#Instructions:
--path.settings Used for designation logstash The directory where the configuration file is located
-f Specify the path of the configuration file to be detected
--config.test_and_exit Exit after the specified detection, or it will start directly
[root@iZj6c7bp1a289r04izstw4Z ~]# /usr/share/logstash/bin/logstash --path.settings /etc/logstash/ -f /etc/logstash/conf.d/syslog-01.conf --config.test_and_exit
Sending Logstash logs to /var/log/logstash which is now configured via log4j2.properties
[2019-03-02T23:54:57,560][WARN ][logstash.config.source.multilocal] Ignoring the 'pipelines.yml' file because modules or command line options are specified
Configuration OK
[2019-03-02T23:55:06,025][INFO ][logstash.runner ] Using config.test_and_exit mode. Config Validation Result: OK. Exiting Logstash
#Specify the configuration file just now and start logstash:
[root@iZj6c7bp1a289r04izstw4Z ~]# /usr/share/logstash/bin/logstash --path.settings /etc/logstash/ -f /etc/logstash/conf.d/syslog-01.conf
Sending Logstash's logs to /var/log/logstash which is now configured via log4j2.properties
#The terminal will stay here because what we define in the configuration file is to export information to the current terminal.
#Open a new terminal to check if port 10514 has been listened on (the listening port defined by the logstash configuration file):
[root@iZj6c7bp1a289r04izstw4Z ~]# netstat -lntp |grep 10514
tcp6 0 0 :::10514 :::* LISTEN 4312/java
#Log on to the server remotely and let the system generate a log to observe the output of the above commands:
//You can see that the collected logs are printed in JSON format in the terminal, and the test is successful.
[root@iZj6c7bp1a289r04izstw4Z ~]# /usr/share/logstash/bin/logstash --path.settings /etc/logstash/ -f /etc/logstash/conf.d/syslog-01.conf
{
"@timestamp" => 2019-03-02T16:14:30.000Z,
"@version" => "1",
"host" => "172.31.116.243",
"severity" => 6,
"facility" => 3,
"facility_label" => "system",
"severity_label" => "Informational",
"message" => "Starting logstash...",
"timestamp" => "Mar 3 00:14:30",
"type" => "system-syslog",
"priority" => 30,
"logsource" => "iZj6c7bp1a289r04izstw4Z",
"program" => "systemd"
}5. Test logstash scenario 2 (system log as input, output to es server)
[root@iZj6c7bp1a289r04izstw4Z ~]# vim /etc/logstash/conf.d/syslog-02.conf
input {
  syslog {
    type => "system-syslog-to-es"
    port => 10514
  }
}
output {
  elasticsearch {
    hosts => ["localhost:9200"]  #Define the ip of es server
    index => "system-syslog-toes-%{+YYYY.MM}" #Define the index, pass it to es, and show it in kibana
  }
}
#Detect whether the configuration file is wrong or not, and for ok, there is no problem representing the configuration file. #Instructions: --path.settings Used for designation logstash The directory where the configuration file is located -f Specify the path of the configuration file to be detected --config.test_and_exit Exit after the specified detection, or it will start directly [root@iZj6c7bp1a289r04izstw4Z ~]# /usr/share/logstash/bin/logstash --path.settings /etc/logstash/ -f /etc/logstash/conf.d/syslog-02.conf --config.test_and_exit Sending Logstash logs to /var/log/logstash which is now configured via log4j2.properties [2019-03-02T23:54:57,560][WARN ][logstash.config.source.multilocal] Ignoring the 'pipelines.yml' file because modules or command line options are specified Configuration OK [2019-03-02T23:55:06,025][INFO ][logstash.runner ] Using config.test_and_exit mode. Config Validation Result: OK. Exiting Logstash [root@iZj6c7bp1a289r04izstw4Z ~]# systemctl start logstash [root@iZj6c7bp1a289r04izstw4Z ~]# systemctl enable logstash [root@iZj6c7bp1a289r04izstw4Z ~]# ps aux |grep logstash [root@iZj6c7bp1a289r04izstw4Z ~]# netstat -lntp |grep 10514 #After I started logstash here, the process was normal, but ports 9600 and 10514 were not monitored. So look at logstash's log to see if there is any error message output, but find that there is no log information recorded, then you can only go to look at the message's log, and find the error message as follows
Wrong 1:
[root@iZj6c7bp1a289r04izstw4Z ~]# cat /var/log/messages | grep "ERROR"
Mar  3 00:28:32 iZj6c7bp1a289r04izstw4Z logstash: 2019-03-03 00:28:32,731 main ERROR Unable to invoke factory method in class org.apache.logging.log4j.core.appender.RollingFileAppender for element RollingFile: java.lang.IllegalStateException: No factory method found for class org.apache.logging.log4j.core.appender.RollingFileAppender java.lang.IllegalStateException: No factory method found for class org.apache.logging.log4j.core.appender.RollingFileAppender
Mar  3 00:28:32 iZj6c7bp1a289r04izstw4Z logstash: 2019-03-03 00:28:32,755 main ERROR RollingFileManager (/var/log/logstash/logstash-slowlog-plain.log) java.io.FileNotFoundException: /var/log/logstash/logstash-slowlog-plain.log (Permission denied) java.io.FileNotFoundException: /var/log/logstash/logstash-slowlog-plain.log (Permission denied)
Mar  3 00:28:32 iZj6c7bp1a289r04izstw4Z logstash: 2019-03-03 00:28:32,778 main ERROR Could not create plugin of type class org.apache.logging.log4j.core.appender.RollingFileAppender for element RollingFile: java.lang.IllegalStateException: ManagerFactory [org.apache.logging.log4j.core.appender.rolling.RollingFileManager$RollingFileManagerFactory@43fa1646] unable to create manager for [/var/log/logstash/logstash-slowlog-plain.log] with data [org.apache.logging.log4j.core.appender.rolling.RollingFileManager$FactoryData@53460794[pattern=/var/log/logstash/logstash-slowlog-plain-%d{yyyy-MM-dd}-%i.log.gz, append=true, bufferedIO=true, bufferSize=8192, policy=CompositeTriggeringPolicy(policies=[TimeBasedTriggeringPolicy(nextRolloverMillis=0, interval=1, modulate=true), SizeBasedTriggeringPolicy(size=104857600)]), strategy=DefaultRolloverStrategy(min=1, max=7, useMax=true), advertiseURI=null, layout=[%d{ISO8601}][%-5p][%-25c] %.10000m%n, filePermissions=null, fileOwner=null]] java.lang.IllegalStateException: ManagerFactory [org.apache.logging.log4j.core.appender.rolling.RollingFileManager$RollingFileManagerFactory@43fa1646] unable to create manager for [/var/log/logstash/logstash-slowlog-plain.log] with data [org.apache.logging.log4j.core.appender.rolling.RollingFileManager$FactoryData@53460794[pattern=/var/log/logstash/logstash-slowlog-plain-%d{yyyy-MM-dd}-%i.log.gz, append=true, bufferedIO=true, bufferSize=8192, policy=CompositeTriggeringPolicy(policies=[TimeBasedTriggeringPolicy(nextRolloverMillis=0, interval=1, modulate=true), SizeBasedTriggeringPolicy(size=104857600)]), strategy=DefaultRolloverStrategy(min=1, max=7, useMax=true), advertiseURI=null, layout=[%d{ISO8601}][%-5p][%-25c] %.10000m%n, filePermissions=null, fileOwner=null]]
Mar  3 00:28:32 iZj6c7bp1a289r04izstw4Z logstash: 2019-03-03 00:28:32,801 main ERROR Unable to invoke factory method in class org.apache.logging.log4j.core.appender.RollingFileAppender for element RollingFile: java.lang.IllegalStateException: No factory method found for class org.apache.logging.log4j.core.appender.RollingFileAppender java.lang.IllegalStateException: No factory method found for class org.apache.logging.log4j.core.appender.RollingFileAppender
Mar  3 00:28:32 iZj6c7bp1a289r04izstw4Z logstash: 2019-03-03 00:28:32,825 main ERROR RollingFileManager (/var/log/logstash/logstash-slowlog-plain.log) java.io.FileNotFoundException: /var/log/logstash/logstash-slowlog-plain.log (Permission denied) java.io.FileNotFoundException: /var/log/logstash/logstash-slowlog-plain.log (Permission denied)

//Wrong 2:
Mar  3 00:34:36 iZj6c7bp1a289r04izstw4Z logstash: [2019-03-03T00:34:36,440][FATAL][logstash.runner          ] An unexpected error occurred! {:error=>#<ArgumentError: Path "/var/lib/logstash/queue" must be a writable directory. It is not writable.>, :backtrace=>["/usr/share/logstash/logstash-core/lib/logstash/settings.rb:447:in `validate'", "/usr/share/logstash/logstash-core/lib/logstash/settings.rb:229:in `validate_value'", "/usr/share/logstash/logstash-core/lib/logstash/settings.rb:140:in `block in validate_all'", "org/jruby/RubyHash.java:1343:in `each'", "/usr/share/logstash/logstash-core/lib/logstash/settings.rb:139:in `validate_all'", "/usr/share/logstash/logstash-core/lib/logstash/runner.rb:278:in `execute'", "/usr/share/logstash/vendor/bundle/jruby/2.3.0/gems/clamp-0.6.5/lib/clamp/command.rb:67:in `run'", "/usr/share/logstash/logstash-core/lib/logstash/runner.rb:237:in `run'", "/usr/share/logstash/vendor/bundle/jruby/2.3.0/gems/clamp-0.6.5/lib/clamp/command.rb:132:in `run'", "/usr/share/logstash/lib/bootstrap/environment.rb:73:in `<main>'"]}
Mar  3 00:34:36 iZj6c7bp1a289r04izstw4Z logstash: [2019-03-03T00:34:36,462][ERROR][org.logstash.Logstash    ] java.lang.IllegalStateException: Logstash stopped processing because of an error: (SystemExit) exit
Mar  3 00:34:36 iZj6c7bp1a289r04izstw4Z systemd: logstash.service: main process exited, code=exited, status=1/FAILURE

//Solution:
[root@iZj6c7bp1a289r04izstw4Z ~]# ll /var/log/logstash/
total 8
-rw-r--r-- 1 root     root 1756 Mar  3 00:19 logstash-plain-2019-03-02-1.log.gz
-rw-r--r-- 1 root root 1706 Mar  3 00:31 logstash-plain.log
-rw-r--r-- 1 root root    0 Mar  2 23:36 logstash-slowlog-plain.log

[root@iZj6c7bp1a289r04izstw4Z ~]# chown logstash /var/log/logstash/logstash-slowlog-plain.log
[root@iZj6c7bp1a289r04izstw4Z ~]# chown logstash /var/log/logstash/logstash-plain.log
[root@iZj6c7bp1a289r04izstw4Z ~]# ll /var/log/logstash/
total 8
-rw-r--r-- 1 root     root 1756 Mar  3 00:19 logstash-plain-2019-03-02-1.log.gz
-rw-r--r-- 1 logstash root 1706 Mar  3 00:31 logstash-plain.log
-rw-r--r-- 1 logstash root    0 Mar  2 23:36 logstash-slowlog-plain.log

[root@iZj6c7bp1a289r04izstw4Z ~]# ll /var/lib/logstash/
total 16
drwxr-xr-x 2 root root 4096 Mar  2 23:36 dead_letter_queue
drwxr-xr-x 3 root root 4096 Mar  2 23:41 plugins
drwxr-xr-x 2 root root 4096 Mar  2 23:36 queue
-rw-r--r-- 1 root root   36 Mar  2 23:40 uuid

[root@iZj6c7bp1a289r04izstw4Z ~]# chown -R logstash /var/lib/logstash/
[root@iZj6c7bp1a289r04izstw4Z ~]# ll /var/lib/logstash/
total 16
drwxr-xr-x 2 logstash root 4096 Mar  2 23:36 dead_letter_queue
drwxr-xr-x 3 logstash root 4096 Mar  2 23:41 plugins
drwxr-xr-x 2 logstash root 4096 Mar  2 23:36 queue
-rw-r--r-- 1 logstash root   36 Mar  2 23:40 uuid

//Port monitoring is normal:
[root@iZj6c7bp1a289r04izstw4Z ~]# systemctl restart logstash
[root@iZj6c7bp1a289r04izstw4Z ~]# netstat -lntp |grep 10514
tcp        0      0 0.0.0.0:10514           0.0.0.0:*               LISTEN      5945/java
[root@iZj6c7bp1a289r04izstw4Z ~]# netstat -lntp |grep 9600
tcp        0      0 127.0.0.1:9600          0.0.0.0:*               LISTEN      5945/java

[root@iZj6c7bp1a289r04izstw4Z ~]# vim /etc/logstash/logstash.yml
http.host: "172.31.116.244"
[root@iZj6c7bp1a289r04izstw4Z ~]# systemctl restart logstash
[root@iZj6c7bp1a289r04izstw4Z ~]# netstat -lntp |grep 9600
tcp        0      0 172.31.116.244:9600     0.0.0.0:*               LISTEN      6132/java

#yellow status resolution (not recommended to follow the following methods, esastic search is recommended to do clustering)
[root@iZj6c7bp1a289r04izstw4Z ~]# curl 'localhost:9200/_cat/indices?v'
health status index                      uuid                   pri rep docs.count docs.deleted store.size pri.store.size
green  open   .kibana_1                  iWQ-ElLnRXaq0mJtsCXe-Q   1   0          2            0      8.6kb          8.6kb
yellow open   system-syslog-toes-2019.03 ZBfgIsFQRnuXIDU1PKYkkg   5   1        451            0    202.5kb        202.5kb

[root@iZj6c23v8zk8gxxvjdylt8Z ~]# curl 'http://localhost:9200/_cat/health?v'
epoch      timestamp cluster status node.total node.data shards pri relo init unassign pending_tasks max_task_wait_time active_shards_percent
1551578321 01:58:41  ELK     yellow          1         1      6   6    0    0        5             0                  -                 54.5%

#Normally, the health status of clusters ("empty clusters") can be divided into three categories:
green: The healthiest state, indicating that all fragments, including backups, are available
yellow: Basic fragmentation is available, but backup is unavailable (or there is no backup)
red: Partial fragmentation is available, indicating that some of the fragmentation is damaged. At this time, the execution of query part of the data can still be found, in this case, it is better to solve as soon as possible.

//Other information is included in the cluster status viewed above: ELK when the cluster name is used, the number of nodes in the cluster is 1, the number of fragments is 5, and the percentage of active fragments is 54.5%.
#The health status of index is also yellow. There are three health status of index. The health status of yellow, green and red is the same as that of cluster.
#One node deploys elastic search, and the default number of fragmented replicas is configured to be 1, while the same fragmentation cannot be on one node, so there is a problem that the fragmentation of replicas is not specified clearly.
//So yellow, we can solve the problem by adding a node to the elastic search cluster if you don't want to.
//You can delete duplicate fragments that are not specified clearly (which is not a good way of doing so), but as a test and solution, you can try it. Let's try to delete duplicate fragments.
[root@iZj6c7bp1a289r04izstw4Z ~]# curl -XGET http://localhost:9200/_cluster/health?pretty=true
{
  "cluster_name" : "elasticsearch",
  "status" : "yellow",
  "timed_out" : false,
  "number_of_nodes" : 1,
  "number_of_data_nodes" : 1,
  "active_primary_shards" : 6,
  "active_shards" : 6,
  "relocating_shards" : 0,
  "initializing_shards" : 0,
  "unassigned_shards" : 5,
  "delayed_unassigned_shards" : 0,
  "number_of_pending_tasks" : 0,
  "number_of_in_flight_fetch" : 0,
  "task_max_waiting_in_queue_millis" : 0,
  "active_shards_percent_as_number" : 54.54545454545454
}

[root@iZj6c23v8zk8gxxvjdylt8Z ~]# curl -H "Content-Type: application/json" -XPUT 'http://localhost:9200/_settings' -d '
> {
>     "index" : {
>         "number_of_replicas" : 0
>     }
> }'

[root@iZj6c23v8zk8gxxvjdylt8Z ~]# curl -XGET http://localhost:9200/_cluster/health?pretty=true
{
  "cluster_name" : "elasticsearch",
  "status" : "green",
  "timed_out" : false,
  "number_of_nodes" : 1,
  "number_of_data_nodes" : 1,
  "active_primary_shards" : 6,
  "active_shards" : 6,
  "relocating_shards" : 0,
  "initializing_shards" : 0,
  "unassigned_shards" : 0,
  "delayed_unassigned_shards" : 0,
  "number_of_pending_tasks" : 0,
  "number_of_in_flight_fetch" : 0,
  "task_max_waiting_in_queue_millis" : 0,
  "active_shards_percent_as_number" : 100.0
}

[root@iZj6c23v8zk8gxxvjdylt8Z ~]# curl 'localhost:9200/_cat/indices?v'
health status index                 uuid                   pri rep docs.count docs.deleted store.size pri.store.size
green  open   system-syslog-toes-2019.03 NMhafFEzT9-w6RWFCP0flw   5   0      13251            0      2.4mb          2.4mb
green  open   .kibana_1             iWQ-ElLnRXaq0mJtsCXe-Q   1   0          2            0      8.6kb          8.6kb
//As you can see above, the system-syslog index defined in the logstash configuration file has been successfully obtained, proving that the configuration is okay and that logstash and es communicate normally.
//Gets the specified index details, with data indicating normal:

[root@iZj6c7bp1a289r04izstw4Z ~]# curl -XGET 'localhost:9200/system-syslog-toes-2019.03?pretty'
//If you need to delete the index later, you can delete the specified index by using the following command:

[root@iZj6c7bp1a289r04izstw4Z ~]# curl -XDELETE 'localhost:9200/.kibana_1'
6. Test logstash scenario 3 (nginx log file as input, filtered, output to es server)
#Install nginx
[root@iZj6c23v8zk8gxxvjdylt8Z ~]# rpm -Uvh http://nginx.org/packages/centos/7/noarch/RPMS/nginx-release-centos-7-0.el7.ngx.noarch.rpm
[root@iZj6c23v8zk8gxxvjdylt8Z ~]# yum install -y nginx
[root@iZj6c23v8zk8gxxvjdylt8Z ~]# systemctl start nginx
[root@iZj6c23v8zk8gxxvjdylt8Z ~]# curl http://127.0.0.1
[root@iZj6c23v8zk8gxxvjdylt8Z ~]# tail -f /var/log/nginx/access.log
#The nginx log has two types: main and log_json, which default to main plain text format.
ELK Store as json Format, text format, splitting out ip Address, Access agent And so on, easy to follow-up use
[root@iZj6c23v8zk8gxxvjdylt8Z ~]# vim /etc/nginx/nginx.conf
    log_format  main  '$remote_addr - $remote_user [$time_local] "$request" '
                      '$status $body_bytes_sent "$http_referer" '
                      '"$http_user_agent" "$http_x_forwarded_for"';
    access_log  /var/log/nginx/access.log  main;

[root@iZj6c23v8zk8gxxvjdylt8Z ~]# tail -f /var/log/nginx/access.log
127.0.0.1 - - [03/Mar/2019:10:22:10 +0800] "GET / HTTP/1.1" 200 612 "-" "curl/7.29.0" "-"
#logstash configuration
#Create a nginx regular expression, referring to the grok rule
[root@iZj6c23v8zk8gxxvjdylt8Z ~]# vim /etc/logstash/conf.d/nginx-access
#nginx-access
WZ ([^ ]*)
NGINXACCESS %{IP:remote_ip} \- \- \[%{HTTPDATE:timestamp}\] "%{WORD:method} %{WZ:request} HTTP/%{NUMBER:httpversion}" %{NUMBER:status} %{NUMBER:bytes} %{QS:referer} %{QS:agent} %{QS:xforward}

//Note: The regular expressions used by grok are in the grok-patterns file
[root@iZj6c23v8zk8gxxvjdylt8Z ~]# find / -name grok-patterns
/usr/share/logstash/vendor/bundle/jruby/2.3.0/gems/logstash-patterns-core-4.1.2/patterns/grok-patterns
[root@iZj6c23v8zk8gxxvjdylt8Z ~]# cat /usr/share/logstash/vendor/bundle/jruby/2.3.0/gems/logstash-patterns-core-4.1.2/patterns/grok-patterns
[root@iZj6c23v8zk8gxxvjdylt8Z ~]# vim /etc/logstash/conf.d/nginx.conf
input {
file { #Specify a file as the input source
path => "/var/log/nginx/access.log" #Specify the path of the file
start_position => "beginning" #Specify when to start collecting
type => "nginx" #Define log types that can be customized
}
}
# #screen
filter {
#If it's nginx access log
if ( [type] == "nginx" ) {
#Cut by field
grok {
patterns_dir=>"/etc/logstash/conf.d/nginx-access"
match => { "message" => "%{NGINXACCESS}" }
}
#Time format conversion
date {
match => [ "timestamp", "dd/MMM/YYYY:HH:mm:ss Z" ]
}
#Delete unnecessary fields
mutate {
remove_field => [ "offset", "@version", "beat", "input_type", "tags","id"]
}
}
}
output {
#Standard output, debugging and use#
stdout {
codec => rubydebug { }
}
# Output to es#
elasticsearch {
hosts => ["localhost:9200"]
index => "%{type}-%{+YYYY.MM.dd}"
}
}[root@iZj6c23v8zk8gxxvjdylt8Z ~]# /usr/share/logstash/bin/logstash --path.settings /etc/logstash/ -f /etc/logstash/conf.d/nginx.conf --config.test_and_exit
Sending Logstash logs to /var/log/logstash which is now configured via log4j2.properties
[2019-03-03T10:27:56,895][WARN ][logstash.config.source.multilocal] Ignoring the 'pipelines.yml' file because modules or command line options are specified
Configuration OK
[2019-03-03T10:28:04,969][INFO ][logstash.runner ] Using config.test_and_exit mode. Config Validation Result: OK. Exiting Logstash
[root@iZj6c23v8zk8gxxvjdylt8Z ~]# systemctl stop logstash
[root@iZj6c23v8zk8gxxvjdylt8Z ~]# /usr/share/logstash/bin/logstash --path.settings /etc/logstash/ -f /etc/logstash/conf.d/nginx.conf
//Then visit the nginx website, which is successful as follows.
{
"xforward" => "\"-\"",
"message" => "127.0.0.1 - - [03/Mar/2019:10:50:55 +0800] \"GET / HTTP/1.1\" 200 612 \"-\" \"curl/7.29.0\" \"-\"",
"host" => "iZj6c23v8zk8gxxvjdylt8Z",
"type" => "nginx",
"agent" => "\"curl/7.29.0\"",
"timestamp" => "03/Mar/2019:10:50:55 +0800",
"httpversion" => "1.1",
"remote_ip" => "127.0.0.1",
"referer" => "\"-\"",
"path" => "/var/log/nginx/access.log",
"method" => "GET",
"request" => "/",
"status" => "200",
"bytes" => "612",
"@timestamp" => 2019-03-03T02:50:55.000Z
}
{
"xforward" => "\"-\"",
"message" => "127.0.0.1 - - [03/Mar/2019:10:22:10 +0800] \"GET / HTTP/1.1\" 200 612 \"-\" \"curl/7.29.0\" \"-\"",
"host" => "iZj6c23v8zk8gxxvjdylt8Z",
"type" => "nginx",
"agent" => "\"curl/7.29.0\"",
"timestamp" => "03/Mar/2019:10:22:10 +0800",
"httpversion" => "1.1",
"remote_ip" => "127.0.0.1",
"referer" => "\"-\"",
"path" => "/var/log/nginx/access.log",
"method" => "GET",
"request" => "/",
"status" => "200",
"bytes" => "612",
"@timestamp" => 2019-03-03T02:22:10.000Z
}
[root@iZj6c23v8zk8gxxvjdylt8Z ~]# systemctl start logstash
[root@iZj6c23v8zk8gxxvjdylt8Z ~]# curl 'localhost:9200/_cat/indices?v'
health status index uuid pri rep docs.count docs.deleted store.size pri.store.size
green open .kibana_1 iWQ-ElLnRXaq0mJtsCXe-Q 1 0 2 0 8.6kb 8.6kb
yellow open system-syslog-toes-2019.03 ZBfgIsFQRnuXIDU1PKYkkg 5 1 68178 0 5.6mb 5.6mb
yellow open nginx-2019.03.03 lQdtD7pqRFyerEWHfMapvQ 5 1 2 0 24.3kb 24.3kb7. Test logstash scenario 4 (filebeat collects nginx logs as input and filters them out to es servers)
#filebeat collects nginx logs and passes them to logstash, which is filtered and exported to the es server. filebeat takes less resources than logstash charging directly.
#Install nginx
[root@iZj6c23v8zk8gxxvjdylt8Z ~]# rpm -Uvh http://nginx.org/packages/centos/7/noarch/RPMS/nginx-release-centos-7-0.el7.ngx.noarch.rpm
[root@iZj6c23v8zk8gxxvjdylt8Z ~]# yum install -y nginx
[root@iZj6c23v8zk8gxxvjdylt8Z ~]# systemctl start nginx
[root@iZj6c23v8zk8gxxvjdylt8Z ~]# curl http://127.0.0.1
[root@iZj6c23v8zk8gxxvjdylt8Z ~]# tail -f /var/log/nginx/access.log
#The nginx log has two types: main and log_json, which default to main plain text format.
ELK Store as json Format, text format, splitting out ip Address, Access agent And so on, easy to follow-up use
[root@iZj6c23v8zk8gxxvjdylt8Z ~]# vim /etc/nginx/nginx.conf
    log_format  main  '$remote_addr - $remote_user [$time_local] "$request" '
                      '$status $body_bytes_sent "$http_referer" '
                      '"$http_user_agent" "$http_x_forwarded_for"';
    access_log  /var/log/nginx/access.log  main;

[root@iZj6c23v8zk8gxxvjdylt8Z ~]# tail -f /var/log/nginx/access.log
127.0.0.1 - - [03/Mar/2019:10:22:10 +0800] "GET / HTTP/1.1" 200 612 "-" "curl/7.29.0" "-"
filebeat To configure:
[root@iZj6c23v8zk8gxxvjdylt8Z ~]# vim /etc/filebeat/filebeat.yml
- input_type: log
  enable: yes
  #tags: nginx-access
  paths:
    - /var/log/nginx/access.log
  exclude_lines: ["^$"]
#output.elasticsearch:
  # Array of hosts to connect to.
#  hosts: ["localhost:9200"]
output.logstash:
  hosts: ["localhost:5044"]
  #hosts: ["172.16.50.32:5044"]
  #index: filebeat

[root@iZj6c23v8zk8gxxvjdylt8Z ~]# systemctl enable  filebeat
[root@iZj6c23v8zk8gxxvjdylt8Z ~]# systemctl restart filebeat
[root@iZj6c23v8zk8gxxvjdylt8Z ~]# systemctl status  filebeat
#logstash configuration
#Create a nginx regular expression, referring to the grok rule
[root@iZj6c23v8zk8gxxvjdylt8Z ~]# vim /etc/logstash/conf.d/nginx-access
#nginx-access
WZ ([^ ]*)
NGINXACCESS %{IP:remote_ip} \- \- \[%{HTTPDATE:timestamp}\] "%{WORD:method} %{WZ:request} HTTP/%{NUMBER:httpversion}" %{NUMBER:status} %{NUMBER:bytes} %{QS:referer} %{QS:agent} %{QS:xforward}
//Note: The regular expressions used by grok are in the grok-patterns file

[root@iZj6c23v8zk8gxxvjdylt8Z ~]# find / -name grok-patterns
/usr/share/logstash/vendor/bundle/jruby/2.3.0/gems/logstash-patterns-core-4.1.2/patterns/grok-patterns
[root@iZj6c23v8zk8gxxvjdylt8Z ~]# cat /usr/share/logstash/vendor/bundle/jruby/2.3.0/gems/logstash-patterns-core-4.1.2/patterns/grok-patterns
[root@iZj6c23v8zk8gxxvjdylt8Z ~]# vim /etc/logstash/conf.d/nginx-filebeat.conf
input {
#filebeat Client#
beats {
port => 5044
}
}
# #screen
filter {
#If it's nginx access log
if ( [type] == "nginx-access-test" ) {
#Cut by field
grok {
patterns_dir=>"/etc/logstash/conf.d/nginx-access"
match => { "message" => "%{NGINXACCESS}" }
}
#Time format conversion
date {
match => [ "timestamp", "dd/MMM/YYYY:HH:mm:ss Z" ]
}
#Delete unnecessary fields
mutate {
remove_field => [ "offset", "@version", "beat", "input_type", "tags","id"]
}
}
}
output {
#Standard output, debugging and use#
stdout {
codec => rubydebug { }
}
# Output to es#
elasticsearch {
hosts => ["localhost:9200"]
index => "%{type}-%{+YYYY.MM.dd}"
}
}[root@iZj6c23v8zk8gxxvjdylt8Z ~]# /usr/share/logstash/bin/logstash --path.settings /etc/logstash/ -f /etc/logstash/conf.d/nginx-filebeat.conf --config.test_and_exit
Sending Logstash logs to /var/log/logstash which is now configured via log4j2.properties
[2019-03-03T10:27:56,895][WARN ][logstash.config.source.multilocal] Ignoring the 'pipelines.yml' file because modules or command line options are specified
Configuration OK
[2019-03-03T10:28:04,969][INFO ][logstash.runner ] Using config.test_and_exit mode. Config Validation Result: OK. Exiting Logstash
[root@iZj6c23v8zk8gxxvjdylt8Z ~]# systemctl stop logstash
[root@iZj6c23v8zk8gxxvjdylt8Z ~]# /usr/share/logstash/bin/logstash --path.settings /etc/logstash/ -f /etc/logstash/conf.d/nginx-filebeat.conf
//Then visit the nginx website, which is successful as follows.
{
"source" => "/var/log/nginx/access.log",
"remote_ip" => "127.0.0.1",
"httpversion" => "1.1",
"bytes" => "612",
"meta" => {
"cloud" => {
"instance_id" => "i-j6c23v8zk8gxxvjdylt8",
"availability_zone" => "cn-hongkong-b",
"provider" => "ecs",
"region" => "cn-hongkong"
}
},
"method" => "GET",
"xforward" => "\"-\"",
"agent" => "\"curl/7.29.0\"",
"referer" => "\"-\"",
"timestamp" => "03/Mar/2019:11:11:03 +0800",
"message" => "127.0.0.1 - - [03/Mar/2019:11:11:03 +0800] \"GET / HTTP/1.1\" 200 612 \"-\" \"curl/7.29.0\" \"-\"",
"prospector" => {
"type" => "log"
},
"type" => "nginx-access-test",
"status" => "200",
"input" => {
"type" => "log"
},
"host" => {
"os" => {
"platform" => "centos",
"version" => "7 (Core)",
"family" => "redhat",
"codename" => "Core",
"name" => "CentOS Linux"
},
"id" => "20181129113200424400422638950048",
"name" => "iZj6c23v8zk8gxxvjdylt8Z",
"architecture" => "x86_64",
"containerized" => true
},
"request" => "/",
"@timestamp" => 2019-03-03T03:11:03.000Z,
"log" => {
"file" => {
"path" => "/var/log/nginx/access.log"
}
}
}[root@iZj6c23v8zk8gxxvjdylt8Z ~]# systemctl start logstash [root@iZj6c23v8zk8gxxvjdylt8Z ~]# curl 'localhost:9200/_cat/indices?v' health status index uuid pri rep docs.count docs.deleted store.size pri.store.size green open .kibana_1 iWQ-ElLnRXaq0mJtsCXe-Q 1 0 2 0 8.6kb 8.6kb yellow open system-syslog-toes-2019.03 ZBfgIsFQRnuXIDU1PKYkkg 5 1 68178 0 5.6mb 5.6mb yellow open nginx-access-test-2019.03.03 YCOqQhpjSMKkqHmvDzxfOA 5 1 8 0 87.4kb 87.4kb yellow open nginx-2019.03.03 lQdtD7pqRFyerEWHfMapvQ 5 1 2 0 24.6kb 24.6kb //Note: The debugging output in the logstash configuration above needs to be turned off after debugging. Logstash can design sub-files according to input, filter, output and priority.
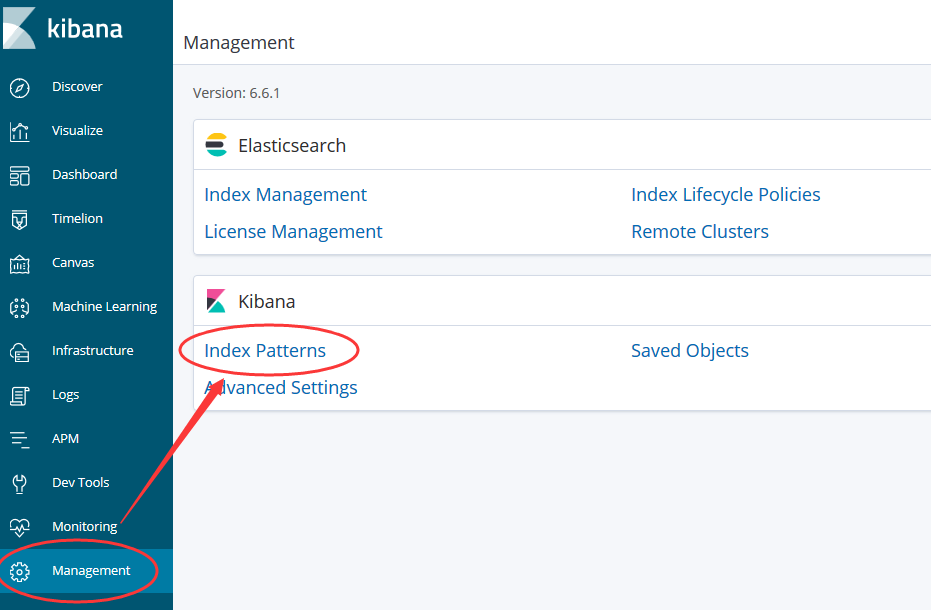
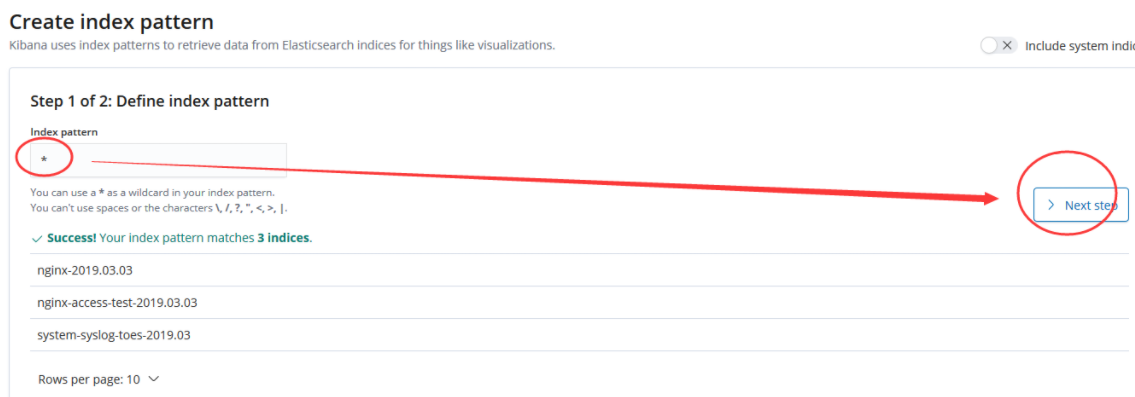
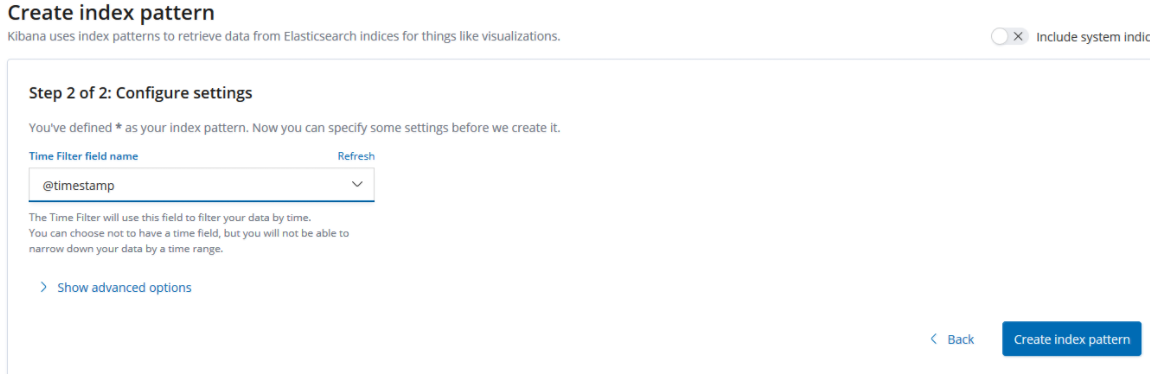
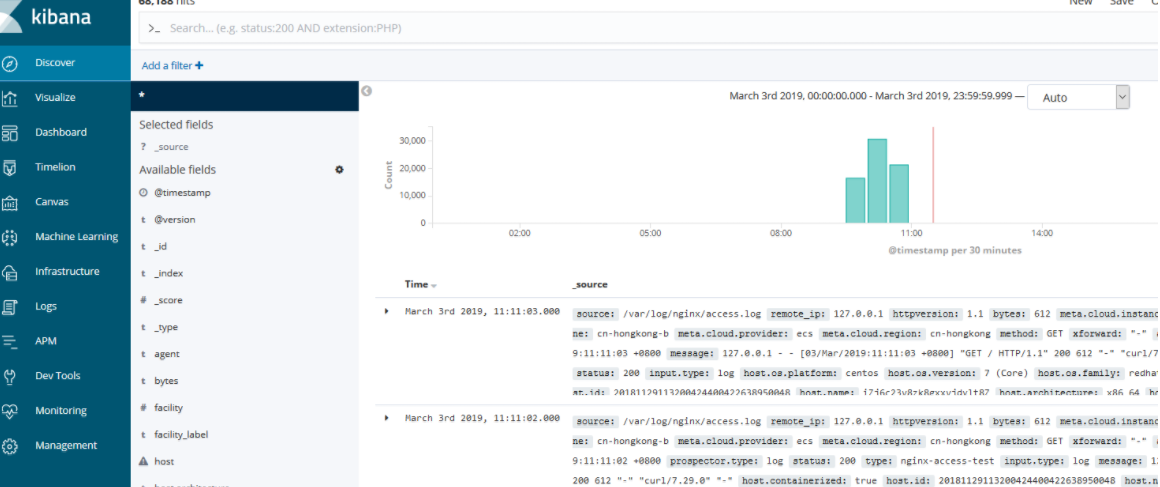
8. Configure kibana
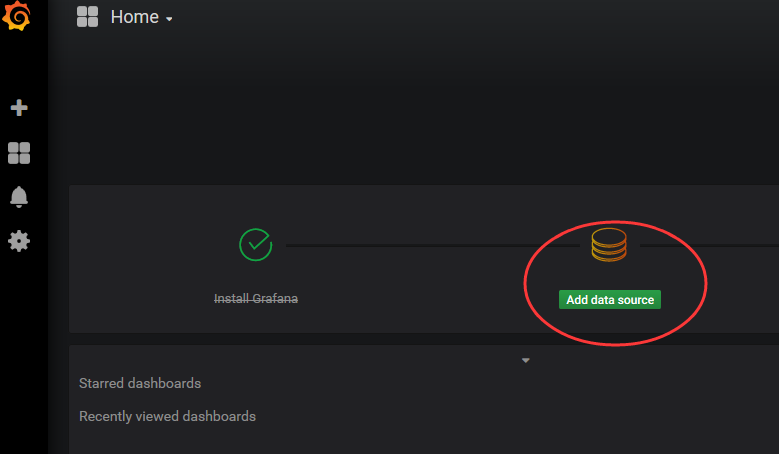
9. Collect Tencent cloud CDN logs and install grafana 5.3 visual logs
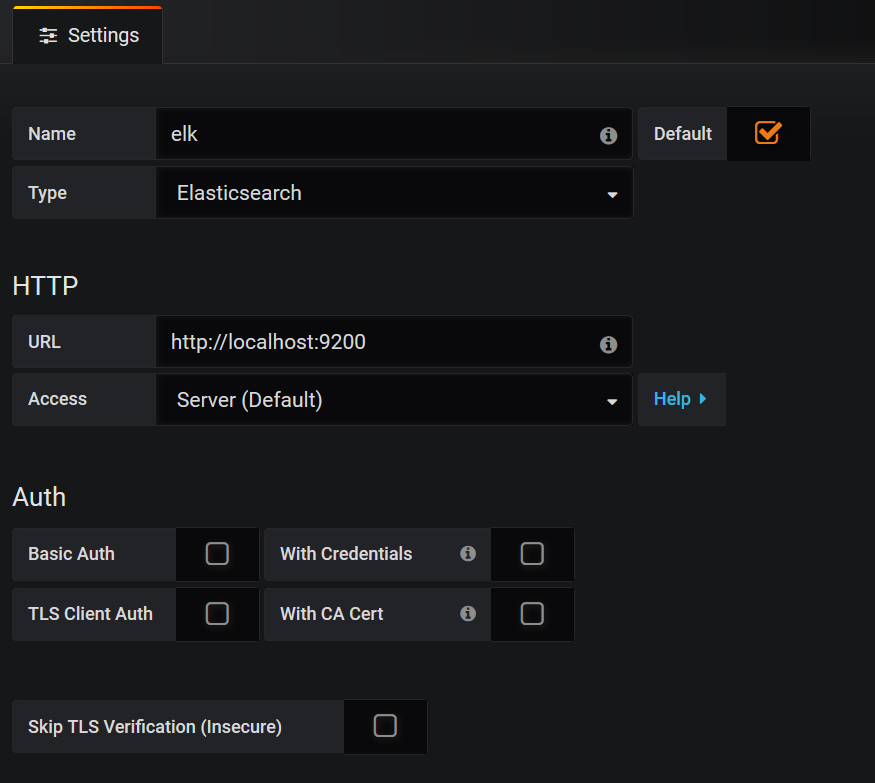
[root@iZj6c23v8zk8gxxvjdylt8Z ~]# yum install https://s3-us-west-2.amazonaws.com/grafana-releases/release/grafana-5.3.2-1.x86_64.rpm
[root@iZj6c23v8zk8gxxvjdylt8Z ~]# yum install fontconfig freetype* urw-fonts -y
[root@iZj6c23v8zk8gxxvjdylt8Z ~]# systemctl enable grafana-server
[root@iZj6c23v8zk8gxxvjdylt8Z ~]# systemctl start grafana-server
[root@iZj6c23v8zk8gxxvjdylt8Z ~]# systemctl status grafana-server
[root@iZj6c23v8zk8gxxvjdylt8Z ~]# grafana-cli plugins install grafana-piechart-panel
[root@iZj6c23v8zk8gxxvjdylt8Z ~]# grafana-cli plugins install grafana-clock-panel
[root@iZj6c23v8zk8gxxvjdylt8Z ~]# grafana-cli plugins uninstall blackmirror1-singlestat-math-panel
[root@iZj6c23v8zk8gxxvjdylt8Z ~]# service grafana-server restart
[root@iZj6c23v8zk8gxxvjdylt8Z ~]# rpm -qc grafana
/etc/init.d/grafana-server
/etc/sysconfig/grafana-server
/usr/lib/systemd/system/grafana-server.service
//Note: Installation of other plug-ins is introduced here, which is not needed in this tutorial.

#List Installable Views
[root@iZj6c23v8zk8gxxvjdylt8Z ~]# grafana-cli plugins list-remote

#Installation Completion Restart Service
[root@iZj6c23v8zk8gxxvjdylt8Z ~]# service grafana-server restart

#Default Plug-in Installation Directory
[root@iZj6c23v8zk8gxxvjdylt8Z ~]# ll /var/lib/grafana/plugins/
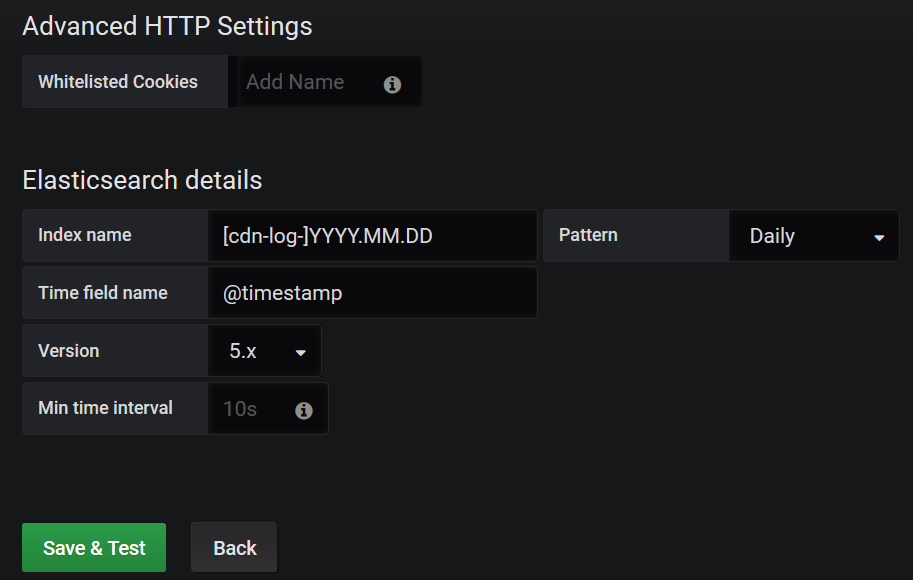
Add the following two lines:
[root@iZj6cdt6ht4gae9swlcd87Z cdn]# vim /etc/elasticsearch/elasticsearch.yml
http.cors.enabled: true
http.cors.allow-origin: "*"

[root@iZj6c23v8zk8gxxvjdylt8Z ~]# mkdir -p /data/logs/cdn/
[root@iZj6c23v8zk8gxxvjdylt8Z ~]# vim /etc/filebeat/filebeat.yml
filebeat.inputs:
- type: log
  enabled: true
  paths:
    - /data/logs/cdn/*.com
  exclude_lines: ["^$"]
  fields:
    type: "cdn-log"
  fields_under_root: true
#output.elasticsearch:
  # Array of hosts to connect to.
#  hosts: ["localhost:9200"]
output.logstash:
  # The Logstash hosts
  hosts: ["localhost:5044"]

[root@iZj6c23v8zk8gxxvjdylt8Z ~]# systemctl enable  filebeat
[root@iZj6c23v8zk8gxxvjdylt8Z ~]# systemctl restart filebeat
[root@iZj6c23v8zk8gxxvjdylt8Z ~]# systemctl status  filebeat

#The alter plug-in logstash6 version in filter is not installed by default. If installed, follow the following method:
#We need to use the alter plug-in.
//Reference link: https://www.elastic.co/guide/en/logstash/current/plugins-filters-alter.html
[root@iZj6c23v8zk8gxxvjdylt8Z cdn]# cd /usr/share/logstash/bin/
[root@iZj6c23v8zk8gxxvjdylt8Z bin]# ./logstash-plugin install logstash-filter-alter
Validating logstash-filter-alter
Installing logstash-filter-alter
Installation successful
[root@iZj6c23v8zk8gxxvjdylt8Z Kibana_Hanization]# vim /etc/logstash/conf.d/cdn.conf
input {
    beats {
        port => 5044
    }
}
filter {
    if [type] == "cdn-log" {
        grok {
            patterns_dir => ["./patterns"]
            match => { "message" => "%{DATESTAMP_EVENTLOG:timestamp} %{IPORHOST:client_ip} %{IPORHOST:server_name} %{NOTSPACE:request} %{NUMBER:bytes} %{NUMBER:province} %{NUMBER:operator} %{NUMBER:status} (?:%{URI:referrer}|%{WORD:referrer}) %{NUMBER:request_time} %{QS:agent} \"\(%{WORD:range}\)\" %{WORD:method} (?:HTTP/%{NUMBER:protocol}|HTTPS) %{WORD:cache}" }
        }
        date {
            match => [ "timestamp", "yyyyMMddHHmmss"]
            target => "@timestamp"
        }
        alter {
            condrewrite => [
                "province", "22", "Beijing",
                "province", "86", "Inner Mongolia",
                "province", "146", "Shanxi",
                "province", "1069", "Hebei",
                "province", "1177", "Tianjin",
                "province", "119", "Ningxia",
                "province", "152", "Shaanxi",
                "province", "1208", "Gansu",
                "province", "1467", "Qinghai",
                "province", "1468", "Xinjiang",
                "province", "145", "Heilongjiang",
                "province", "1445", "Jilin",
                "province", "1464", "Liaoning",
                "province", "2", "Fujian",
                "province", "120", "Jiangsu",
                "province", "121", "Anhui",
                "province", "122", "Shandong",
                "province", "1050", "Shanghai",
                "province", "1442", "Zhejiang",
                "province", "182", "Henan",
                "province", "1135", "Hubei",
                "province", "1465", "Jiangxi",
                "province", "1466", "Hunan",
                "province", "118", "Guizhou",
                "province", "153", "Yunnan",
                "province", "1051", "Chongqing",
                "province", "1068", "Sichuan",
                "province", "1155", "Tibet",
                "province", "4", "Guangdong",
                "province", "173", "Guangxi",
                "province", "1441", "Hainan",
                "province", "0", "Other",
                "province", "1", "Hong Kong, Macao and Taiwan",
                "province", "-1", "Abroad",
                "operator", "2", "China Telecom",
                "operator", "26", "China Unicom",
                "operator", "38", "Education Network",
                "operator", "43", "The Great Wall broadband",
                "operator", "1046", "China Mobile",
                "operator", "3947", "China Railway Corporation",
                "operator", "-1", "Overseas Operators",
                "operator", "0", "Other operators"
            ]
        }
    }
}
output {

    stdout {
        codec => rubydebug { }
    }

    elasticsearch {
       hosts => ["localhost:9200"]
       index => "%{[type]}-%{+YYYY.MM.dd}"
    }
}
[root@iZj6c23v8zk8gxxvjdylt8Z ~]# /usr/share/logstash/bin/logstash --path.settings /etc/logstash/ -f /etc/logstash/conf.d/cdn.conf --config.test_and_exit Sending Logstash logs to /var/log/logstash which is now configured via log4j2.properties [2019-03-03T10:27:56,895][WARN ][logstash.config.source.multilocal] Ignoring the 'pipelines.yml' file because modules or command line options are specified Configuration OK [2019-03-03T10:28:04,969][INFO ][logstash.runner ] Using config.test_and_exit mode. Config Validation Result: OK. Exiting Logstash [root@iZj6c7bp1a289r04izstw4Z ~]# chown logstash /var/log/logstash/logstash-slowlog-plain.log [root@iZj6c7bp1a289r04izstw4Z ~]# chown logstash /var/log/logstash/logstash-plain.log [root@iZj6c7bp1a289r04izstw4Z ~]# chown -R logstash /var/lib/logstash/ [root@iZj6c7bp1a289r04izstw4Z ~]# vim /etc/logstash/logstash.yml http.host: "172.31.116.244" [root@iZj6c7bp1a289r04izstw4Z ~]# systemctl restart logstash [root@iZj6c7bp1a289r04izstw4Z ~]# systemctl enable logstash [root@iZj6c7bp1a289r04izstw4Z ~]# netstat -lntp |grep 5044 tcp 0 0 0.0.0.0:10514 0.0.0.0:* LISTEN 5945/java [root@iZj6c7bp1a289r04izstw4Z ~]# netstat -lntp |grep 9600 tcp 0 0 172.31.116.244:9600 0.0.0.0:* LISTEN 6132/java [root@iZj6cdt6ht4gae9swlcd87Z ~]# curl 'localhost:9200/_cat/indices?v' health status index uuid pri rep docs.count docs.deleted store.size pri.store.size yellow open cdn-log-2019.03.02 VGN_ljUjRIyerCZu8HHilA 5 1 584 0 1.4mb 1.4mb yellow open cdn-log-2019.03.03 BokIxrVKQpOsDnlgilS8XQ 5 1 1052 0 1.4mb 1.4mb green open .kibana_1 TiwdgoXhSsK6mcUZEJVmMw 1 0 2 0 8.6kb 8.6kb #After the new log is in the directory, index is updated here, and docs.count data and log rows are correct. [root@iZj6cdt6ht4gae9swlcd87Z cdn]# curl 'localhost:9200/_cat/indices?v' health status index uuid pri rep docs.count docs.deleted store.size pri.store.size yellow open cdn-log-2019.03.02 VGN_ljUjRIyerCZu8HHilA 5 1 1720 0 2mb 2mb green open .kibana_1 TiwdgoXhSsK6mcUZEJVmMw 1 0 2 0 8.6kb 8.6kb yellow open cdn-log-2019.03.03 BokIxrVKQpOsDnlgilS8XQ 5 1 8534 0 6.4mb 6.4mb
Visit grafana:

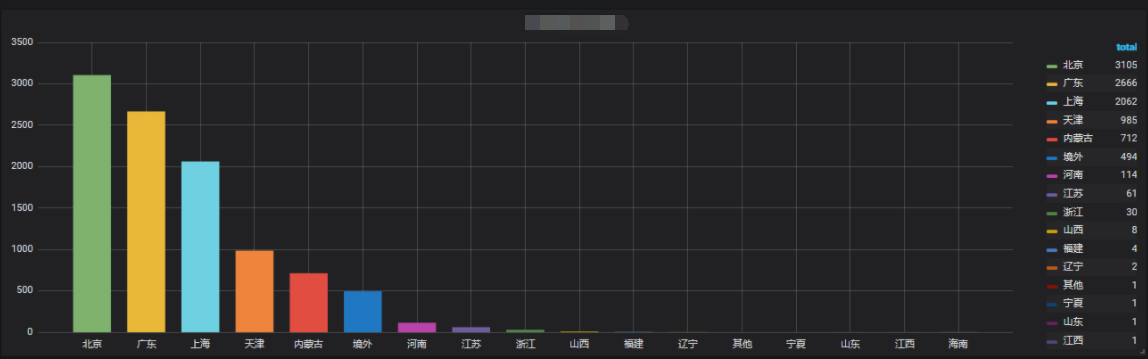
Note: Pay attention to the correct choice of time, or there is no data.