Pay attention to the versions of different software you use. It's best to match them. If they don't match, I haven't tried, and there may be errors
The memory of a single machine should be more than 2G, and 3G is the best. It should be for all the memory consumption compared on one machine. The memory service can not be started if it is too low
1. Installation of elasticsearch
Download address
https://www.elastic.co/cn/downloads/elasticsearch
Installation steps
1.Install software
yum install -y java-1.8.0-openjdk.x86_64
rpm -ivh elasticsearch-6.6.0.rpm

2.Modify profile

cat /etc/elasticsearch/elasticsearch.yml
node.name: node-1
path.data: /data/elasticsearch
path.logs: /var/log/elasticsearch
bootstrap.memory_lock: true
network.host: 192.168.80.40,127.0.0.1
http.port: 9200


Lock memory changes
vim jvm.options
-Xms512m
-Xmx512m
 The default is 1 g Make changes according to your own memory size

3.Modify memory lock
systemctl edit elasticsearch
 add to
[Service]
LimitMEMLOCK=infinity

4.Create data directory and authorize
mkdir /data/elasticsearch
chown -R elasticsearch:elasticsearch /data/elasticsearch/

5.Restart service
systemctl daemon-reload
systemctl start elasticsearch

6.View logs and ports
tail -f /var/log/elasticsearch/Linux.log
netstat -lntup:grep 9200
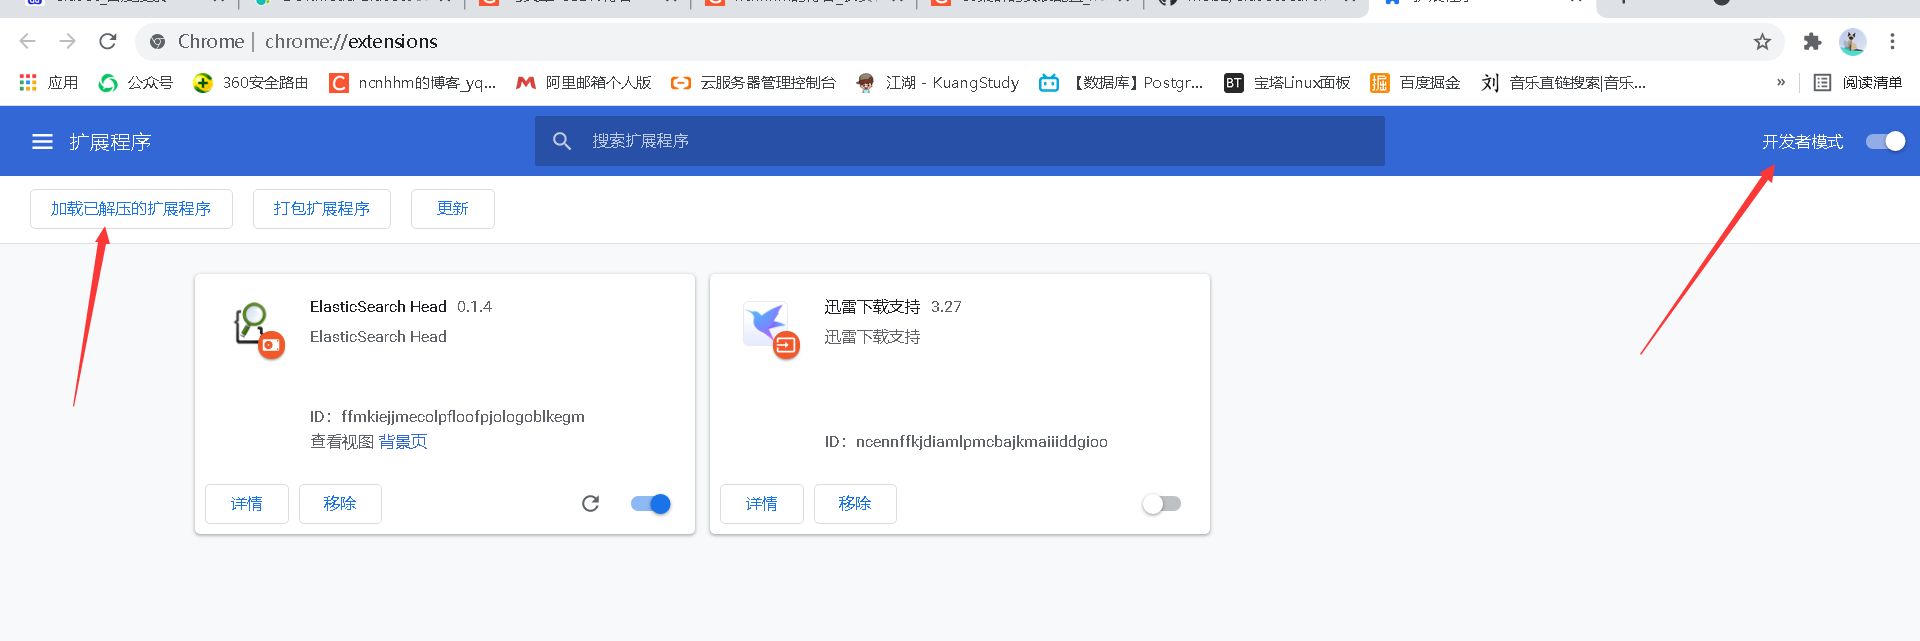
2. Installation of ES head
website:
https://github.com/mobz/elasticsearch-head
Unzip the file, add Google's extension program, and add the unzipped folder
3. kibana installation
Download address:
https://www.elastic.co/cn/downloads/kibana
We download the rpm package for installation
Upload to virtual machine
wget can also be used
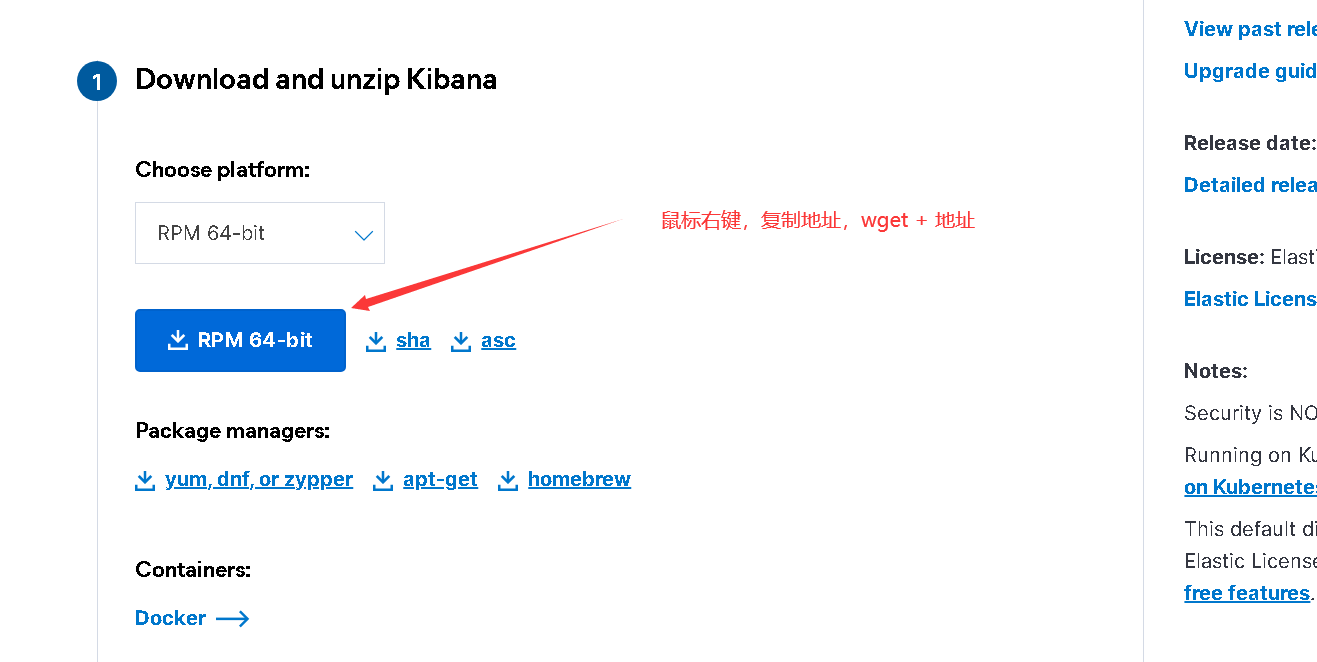
wget https://artifacts.elastic.co/downloads/kibana/kibana-7.15.2-x86_64.rpm
rpm -ivh kibana-6.6.0-x86_64.rpm
configuration file
vim /etc/kibana/kibana.yml
server.port: 5601
server.host: "192.168.80.40"
elasticsearch.hosts: ["http://localhost:9200"]
kibana.index: ".kibana
grep '^[a-z]' /etc/kibana/kibana.yml
server.port: 5601
server.host: "192.168.80.40"
elasticsearch.hosts: ["http://localhost:9200"]
kibana.index: ".kibana"
Start:
systemctl start kibana
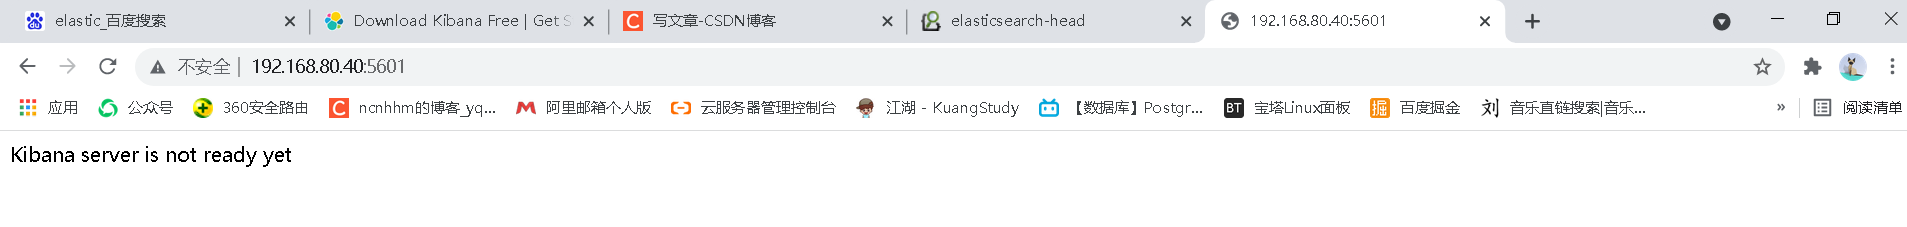
This is just not up yet
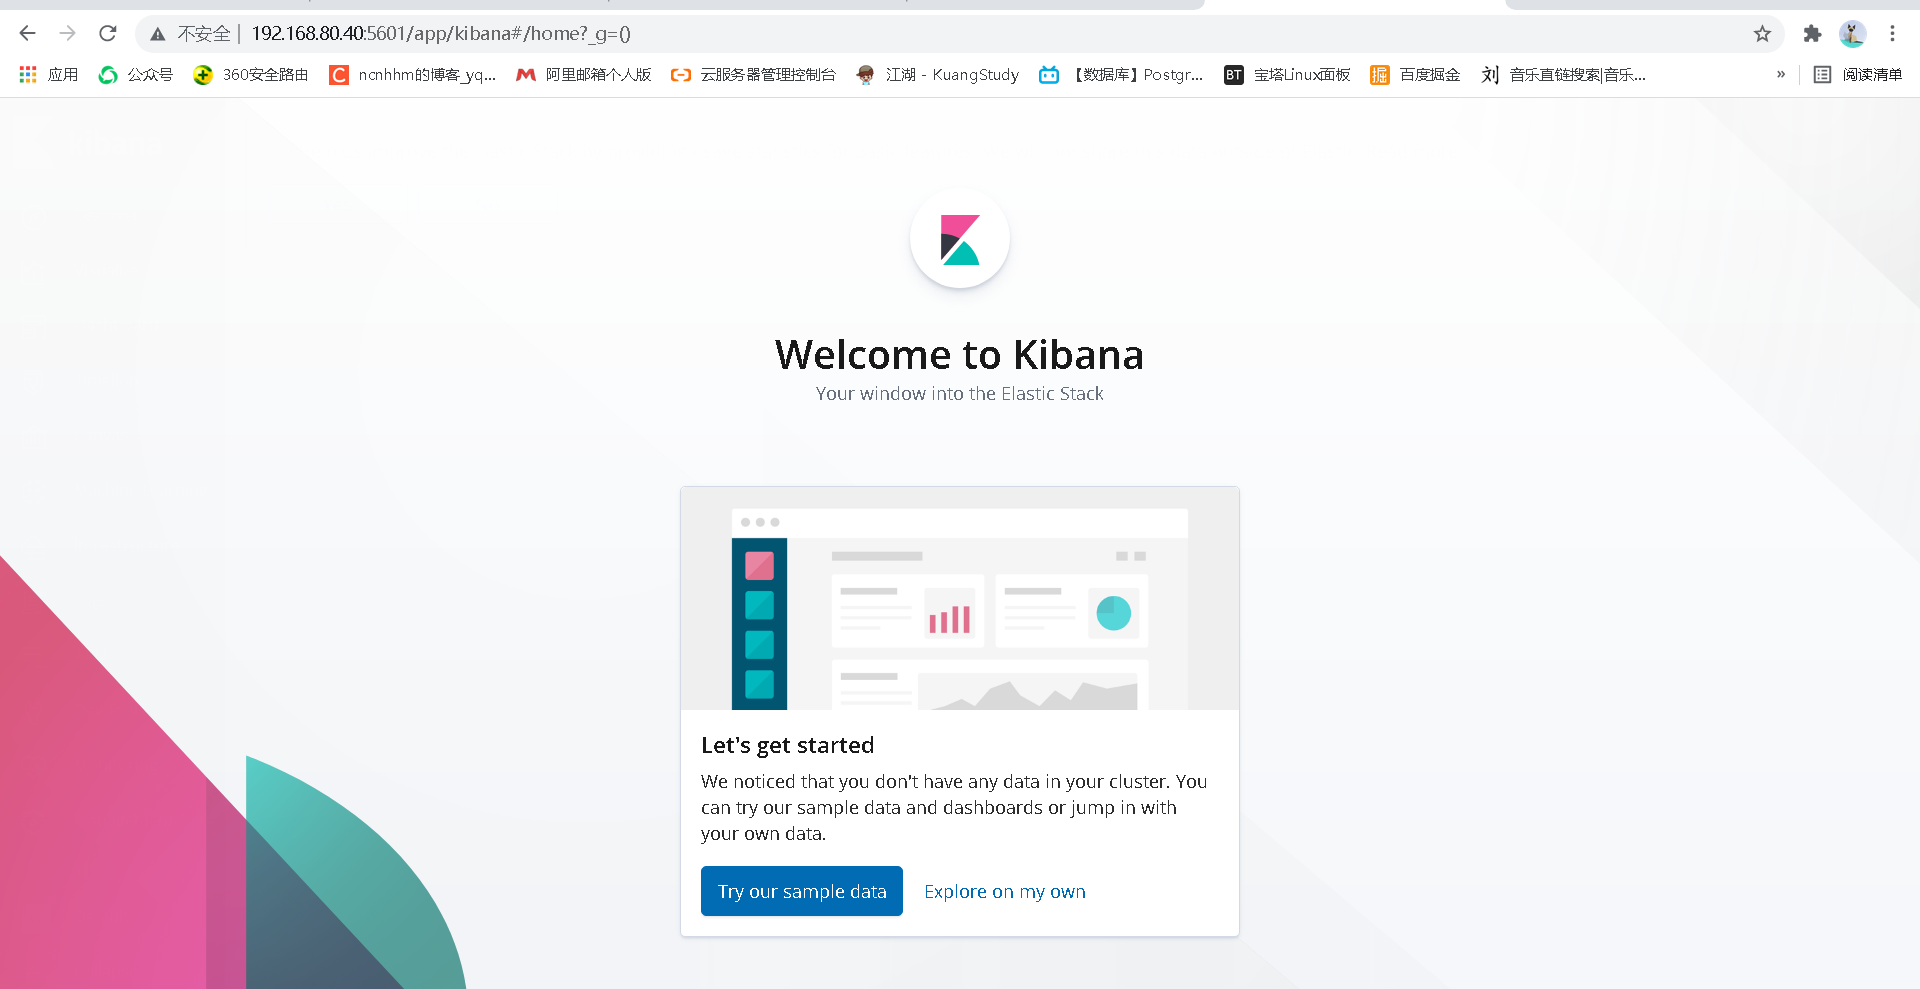
Start successful
4. Installation of filebeat
Download address
https://www.elastic.co/cn/downloads/beats/filebeat
4.1 installation:
rpm -ivh filebeat-6.6.0-x86_64.rpm
4.2 using filebeat to collect nginx logs
Installation of nginx
add to yum source
vim /etc/yum.repos.d/nginx.repo
[nginx-stable]
name=nginx stable repo
baseurl=http://nginx.org/packages/centos/$releasever/$basearch/
gpgcheck=1
enabled=1
gpgkey=https://nginx.org/keys/nginx_signing.key
module_hotfixes=true

[nginx-mainline]
name=nginx mainline repo
baseurl=http://nginx.org/packages/mainline/centos/$releasever/$basearch/
gpgcheck=1
enabled=0
gpgkey=https://nginx.org/keys/nginx_signing.key
module_hotfixes=true

yum -y install nginx

start-up
systemctl start nginx
visit
192.168.80.40
yum -y install httpd-tools
Access test
ab -c 10 -n 100 192.168.80.40/
ab -c 10 -n 100 192.168.80.40/test.html

view log
tail -f /var/log/nginx/access.log
4.3 configuration of filebeat configuration file
Simple basic configuration
vim /etc/filebeat/filebeat.yml

filebeat.inputs:
- type: log
  enabled: true
  paths:
    - /var/log/nginx/access.log
output.elasticsearch:
  hosts: ["localhost:9200"]
Here configuration files and ansible script books have this strict requirement
input log
Output is similar to output
Let's start and have a look
systemctl start filebeat
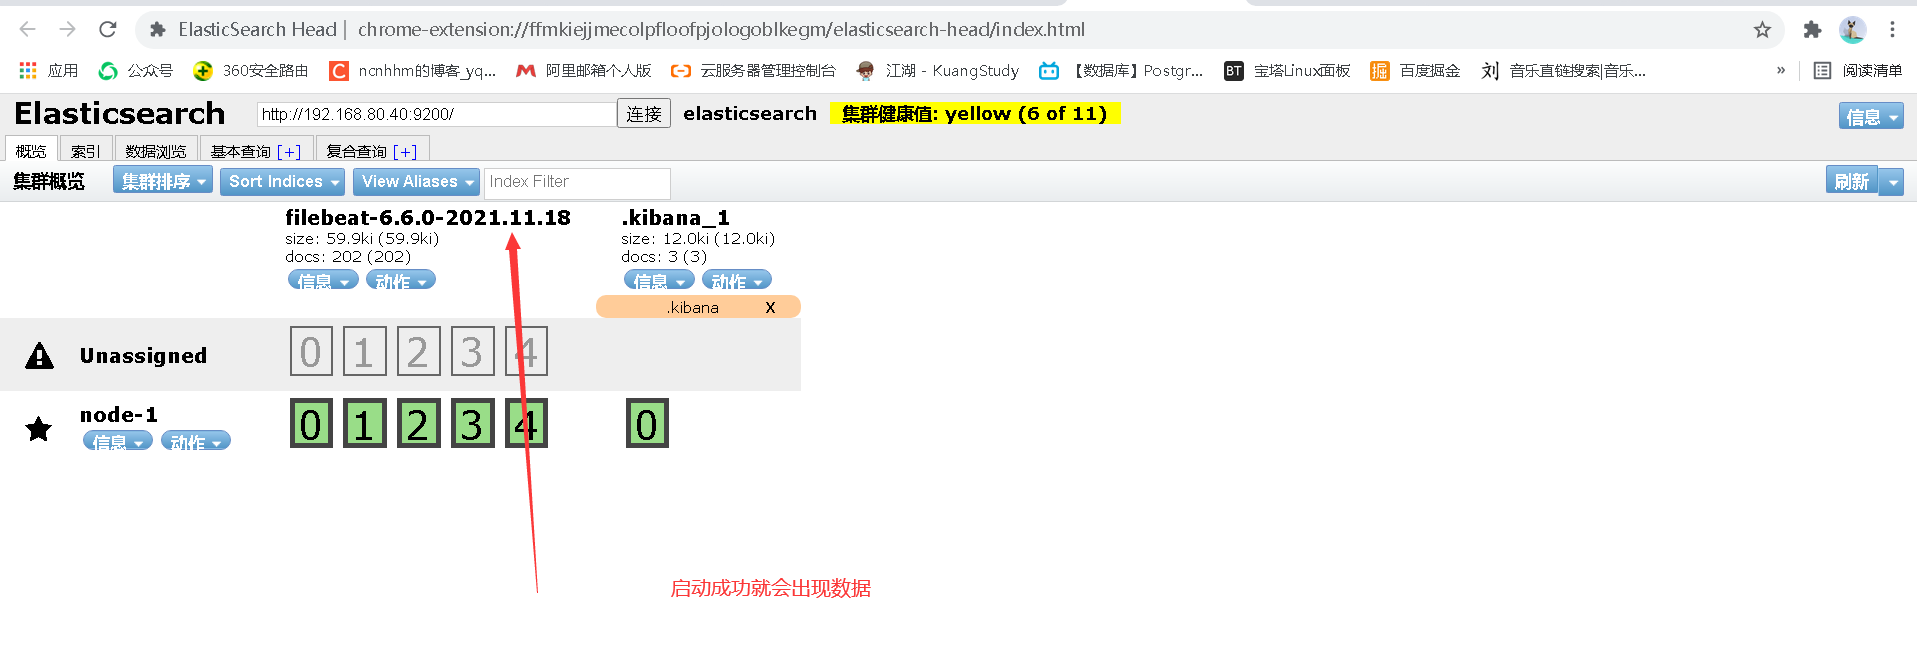
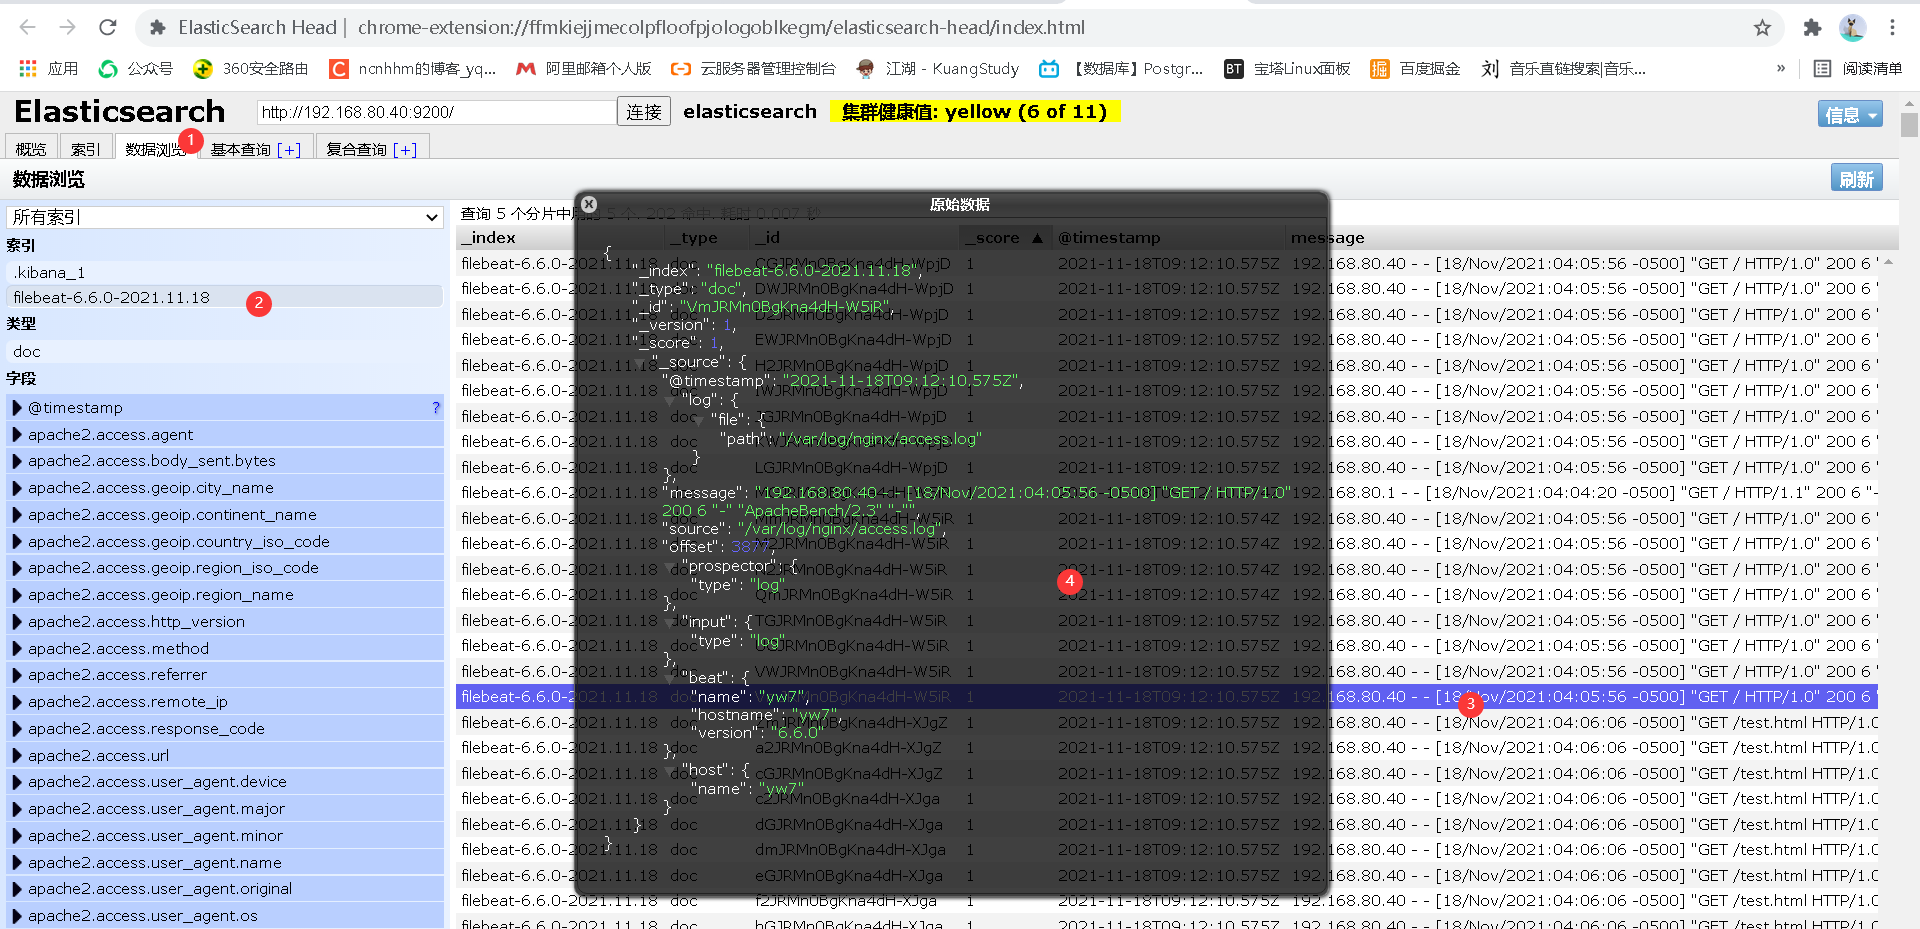
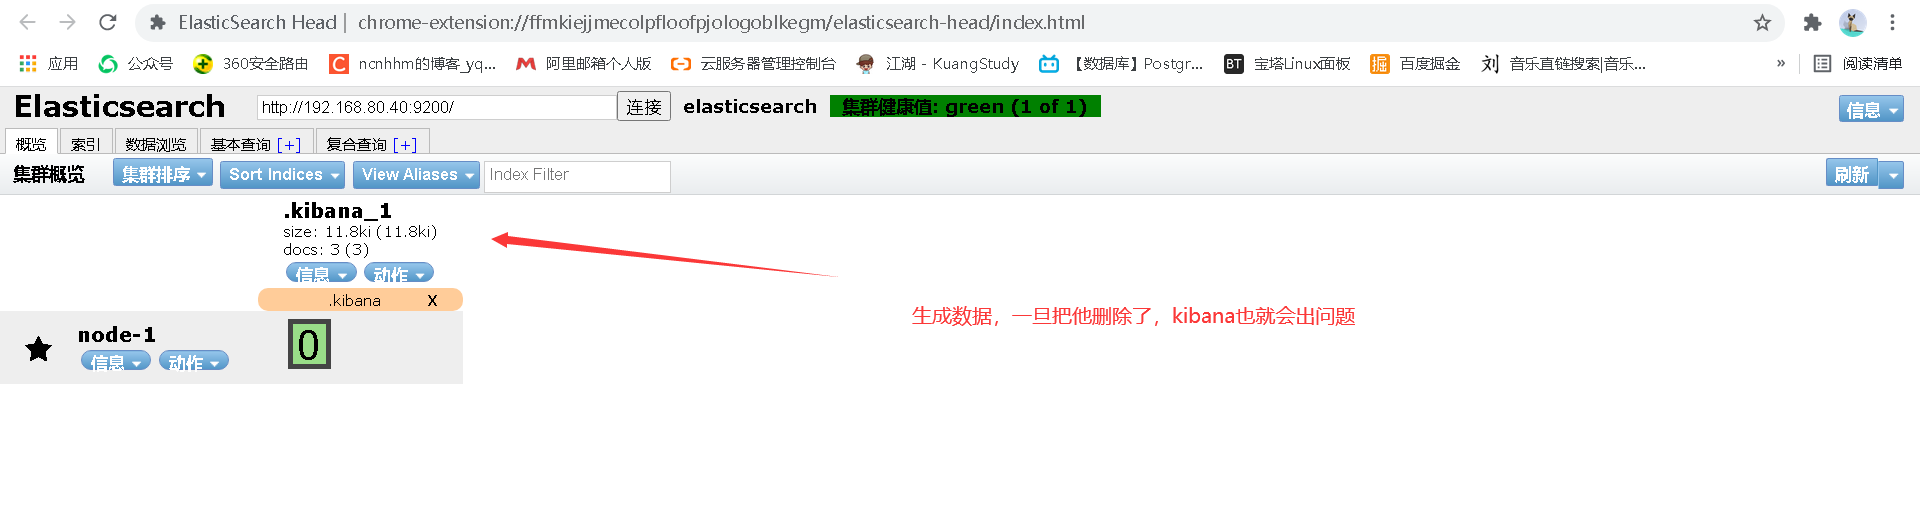
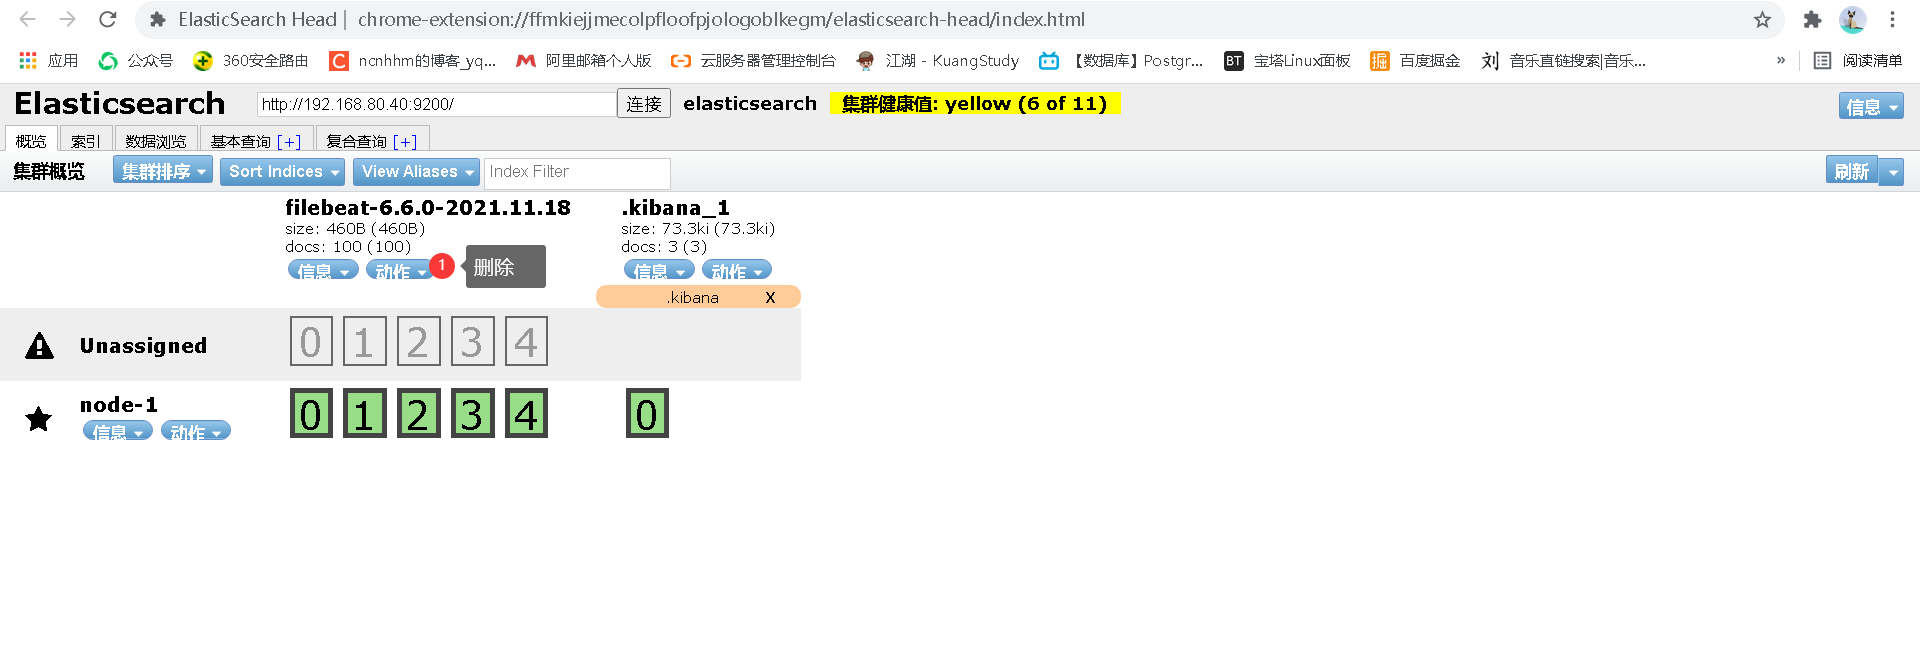
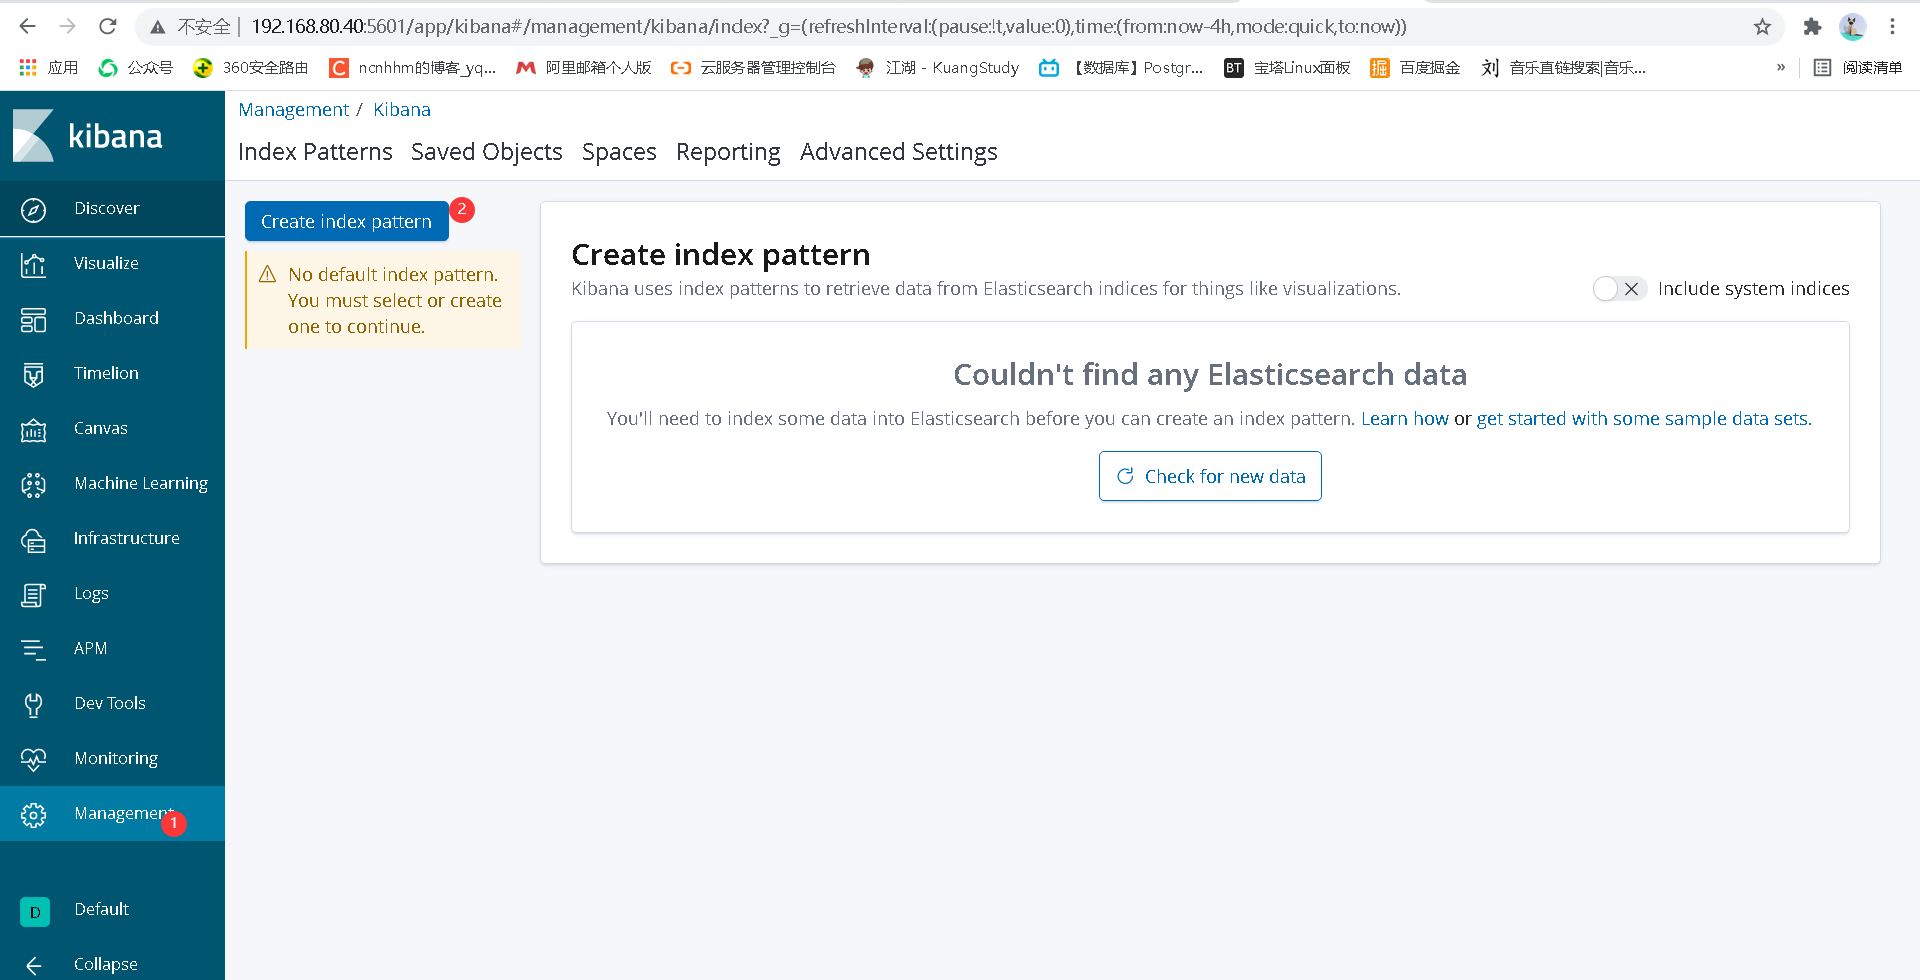
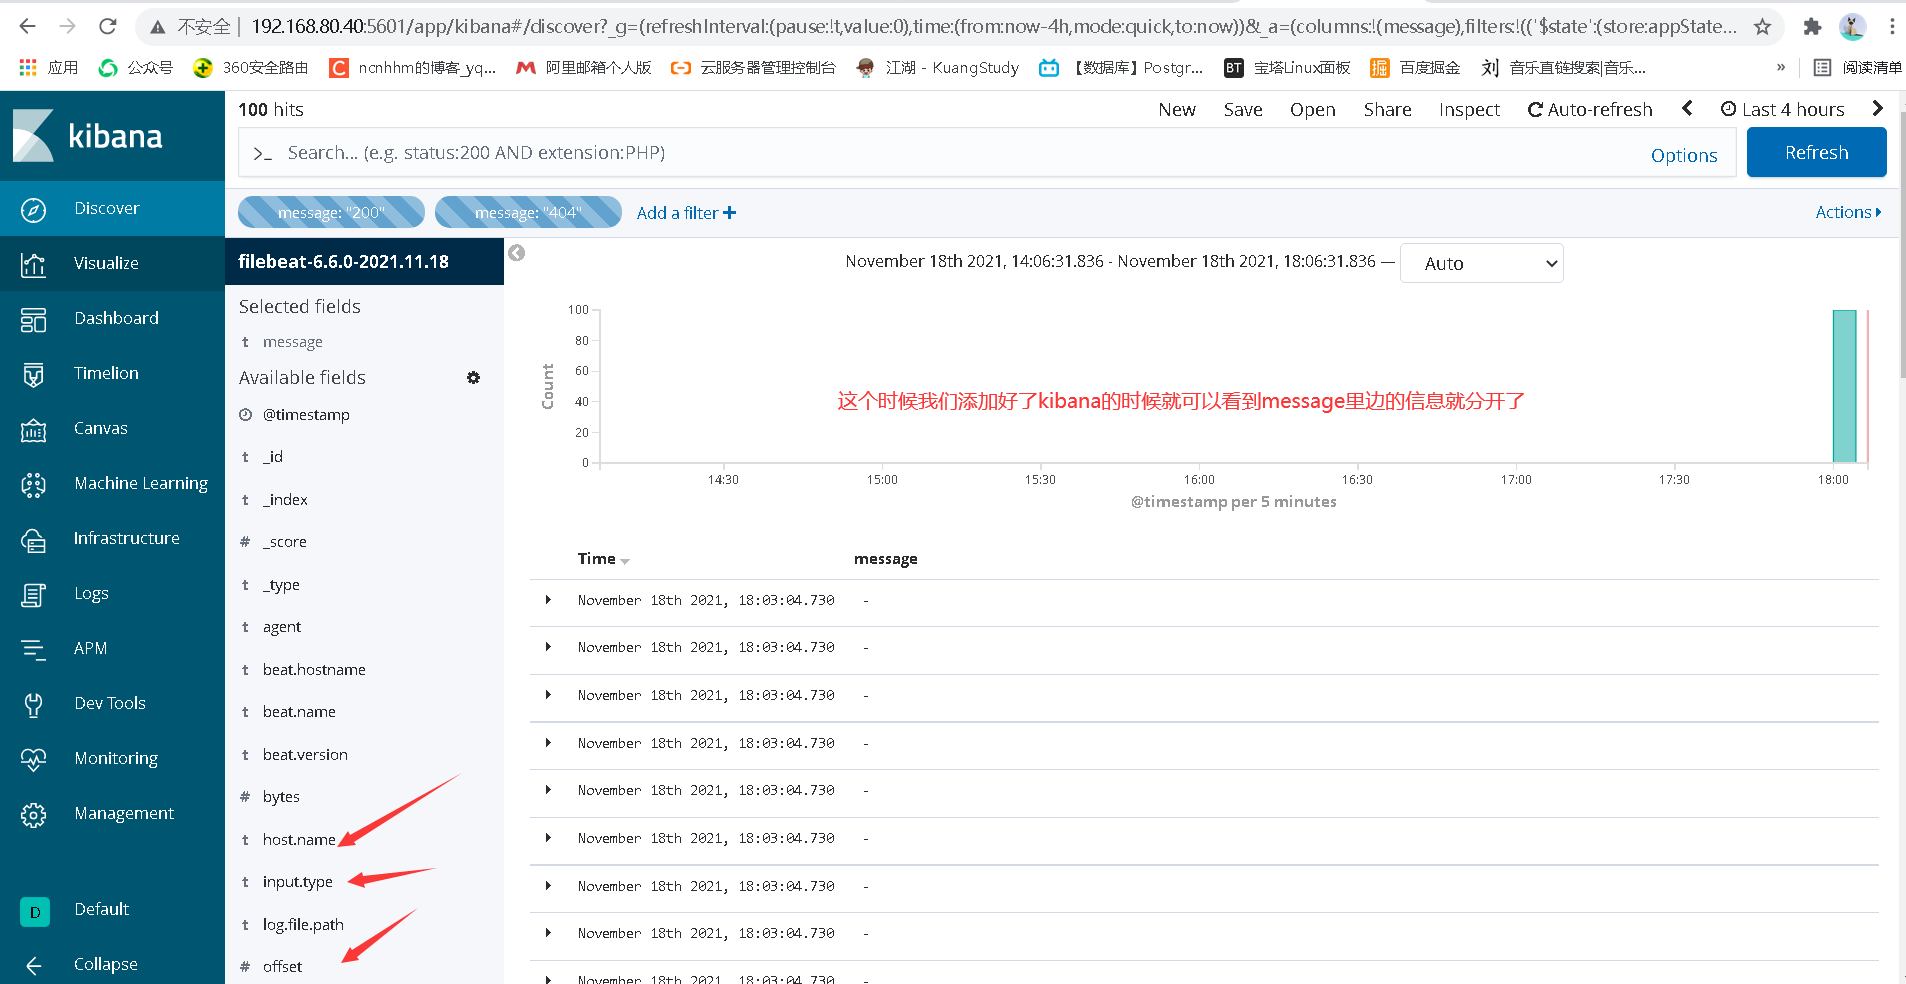
4.4 at this time, we can add the data obtained by filebeat in kibana
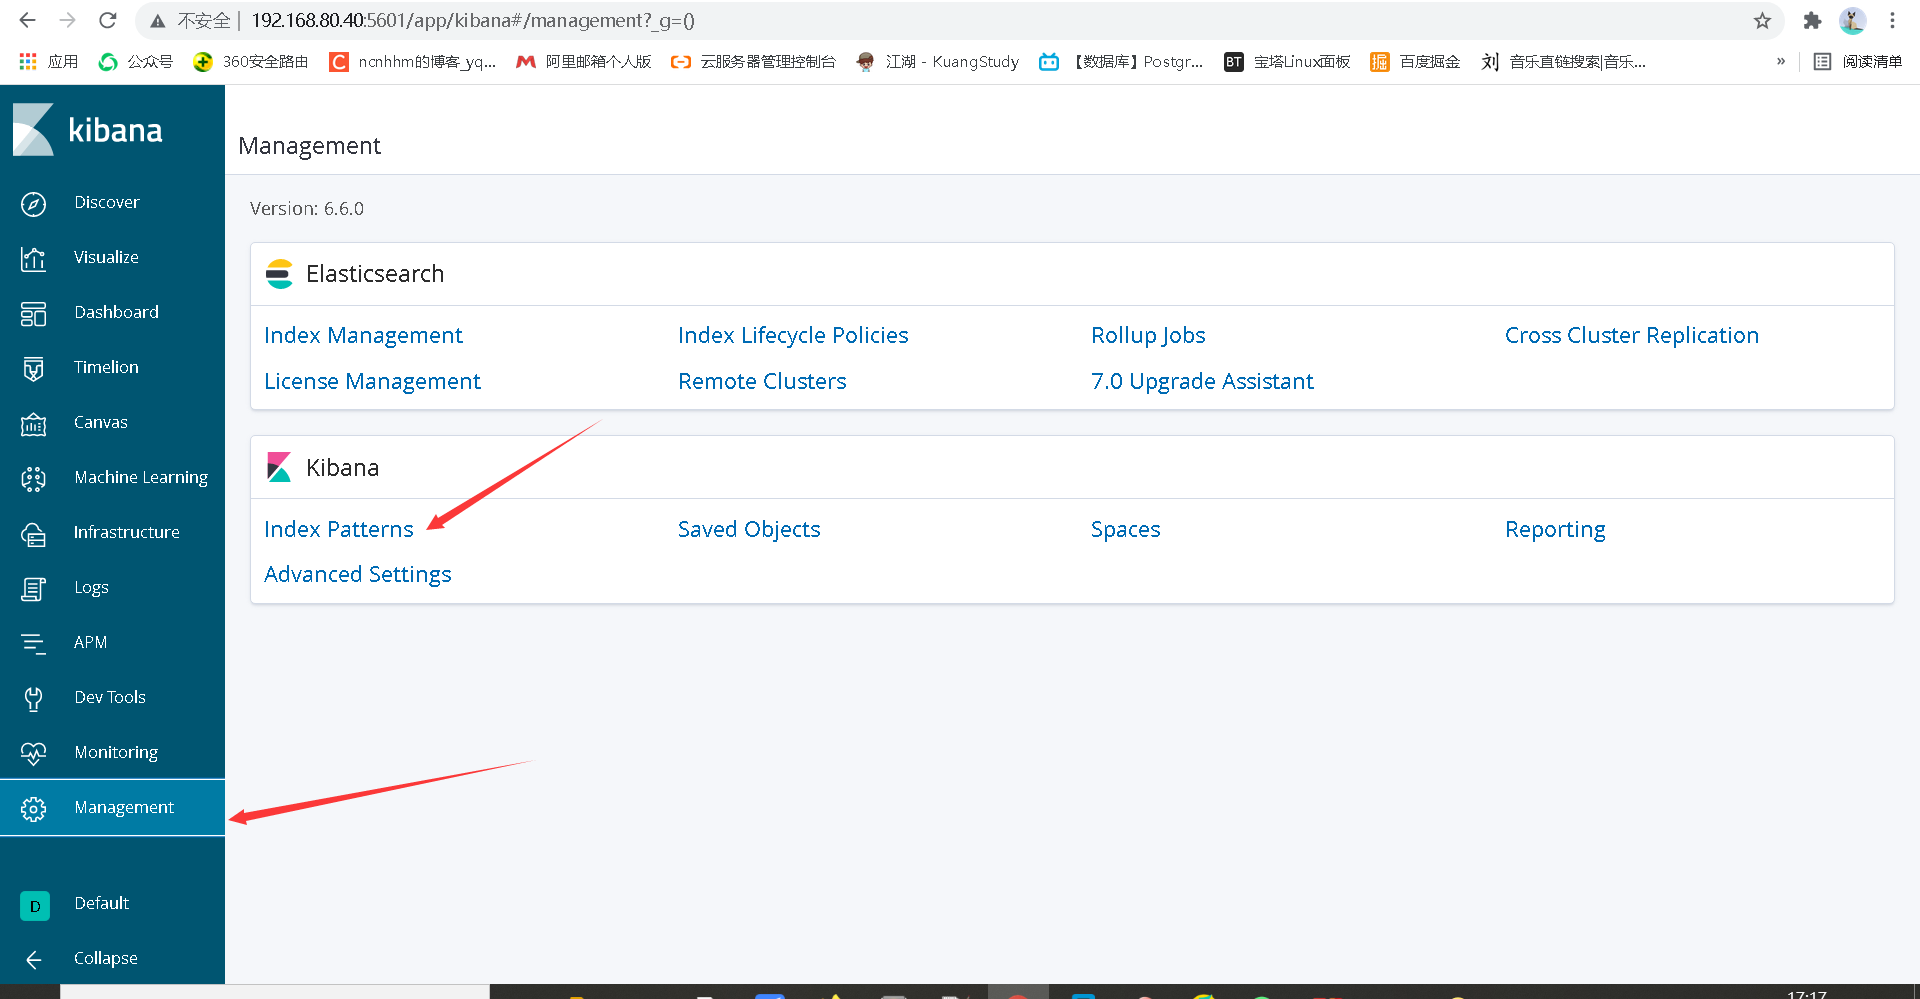
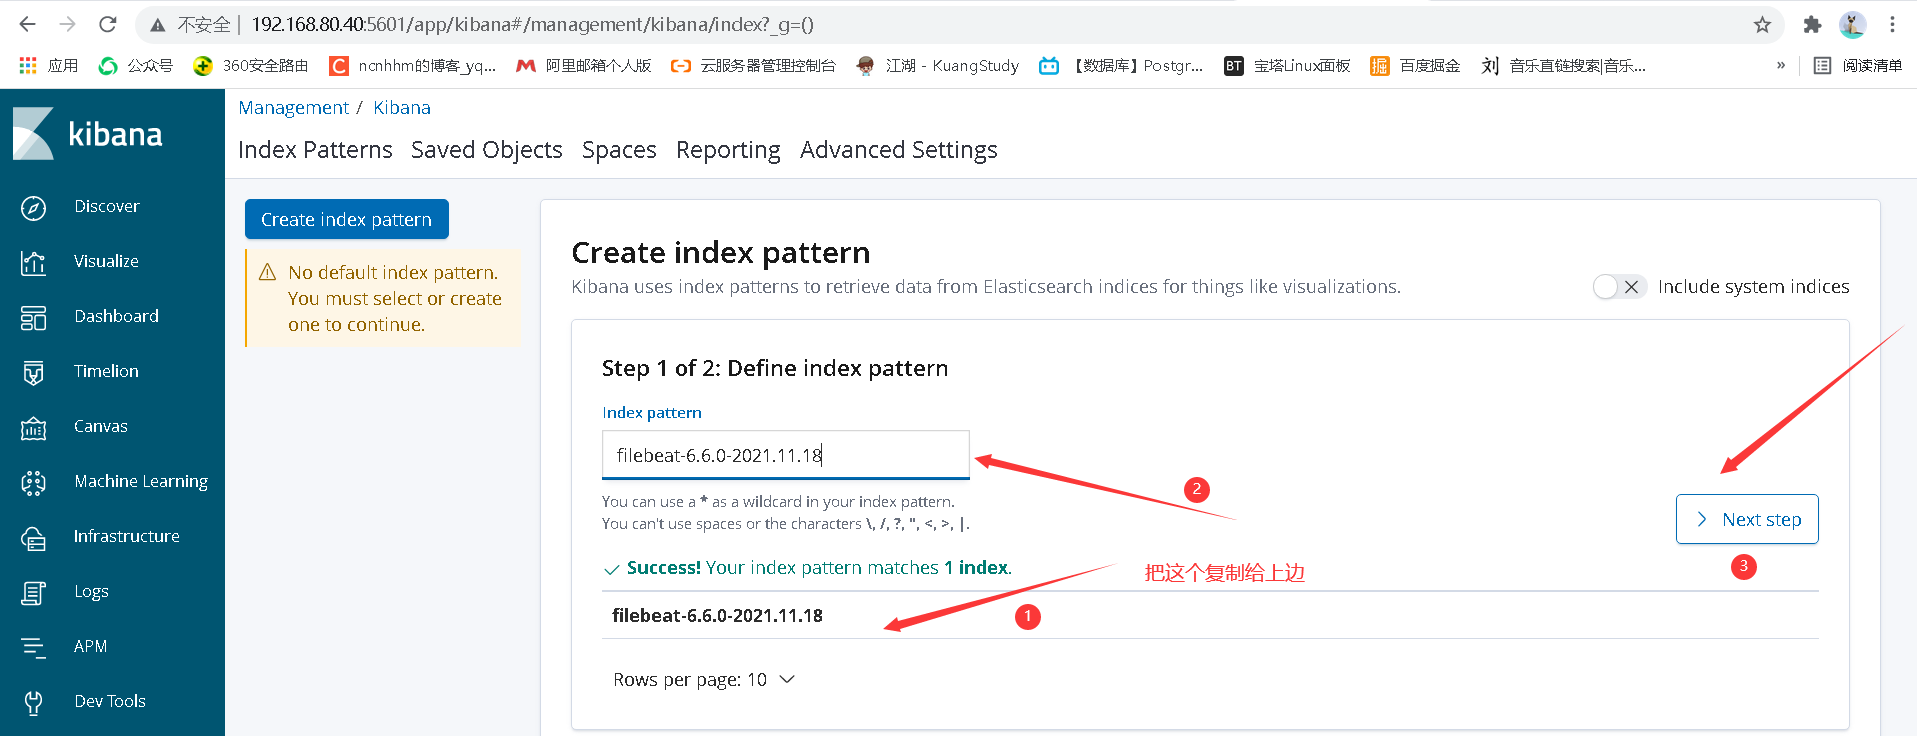
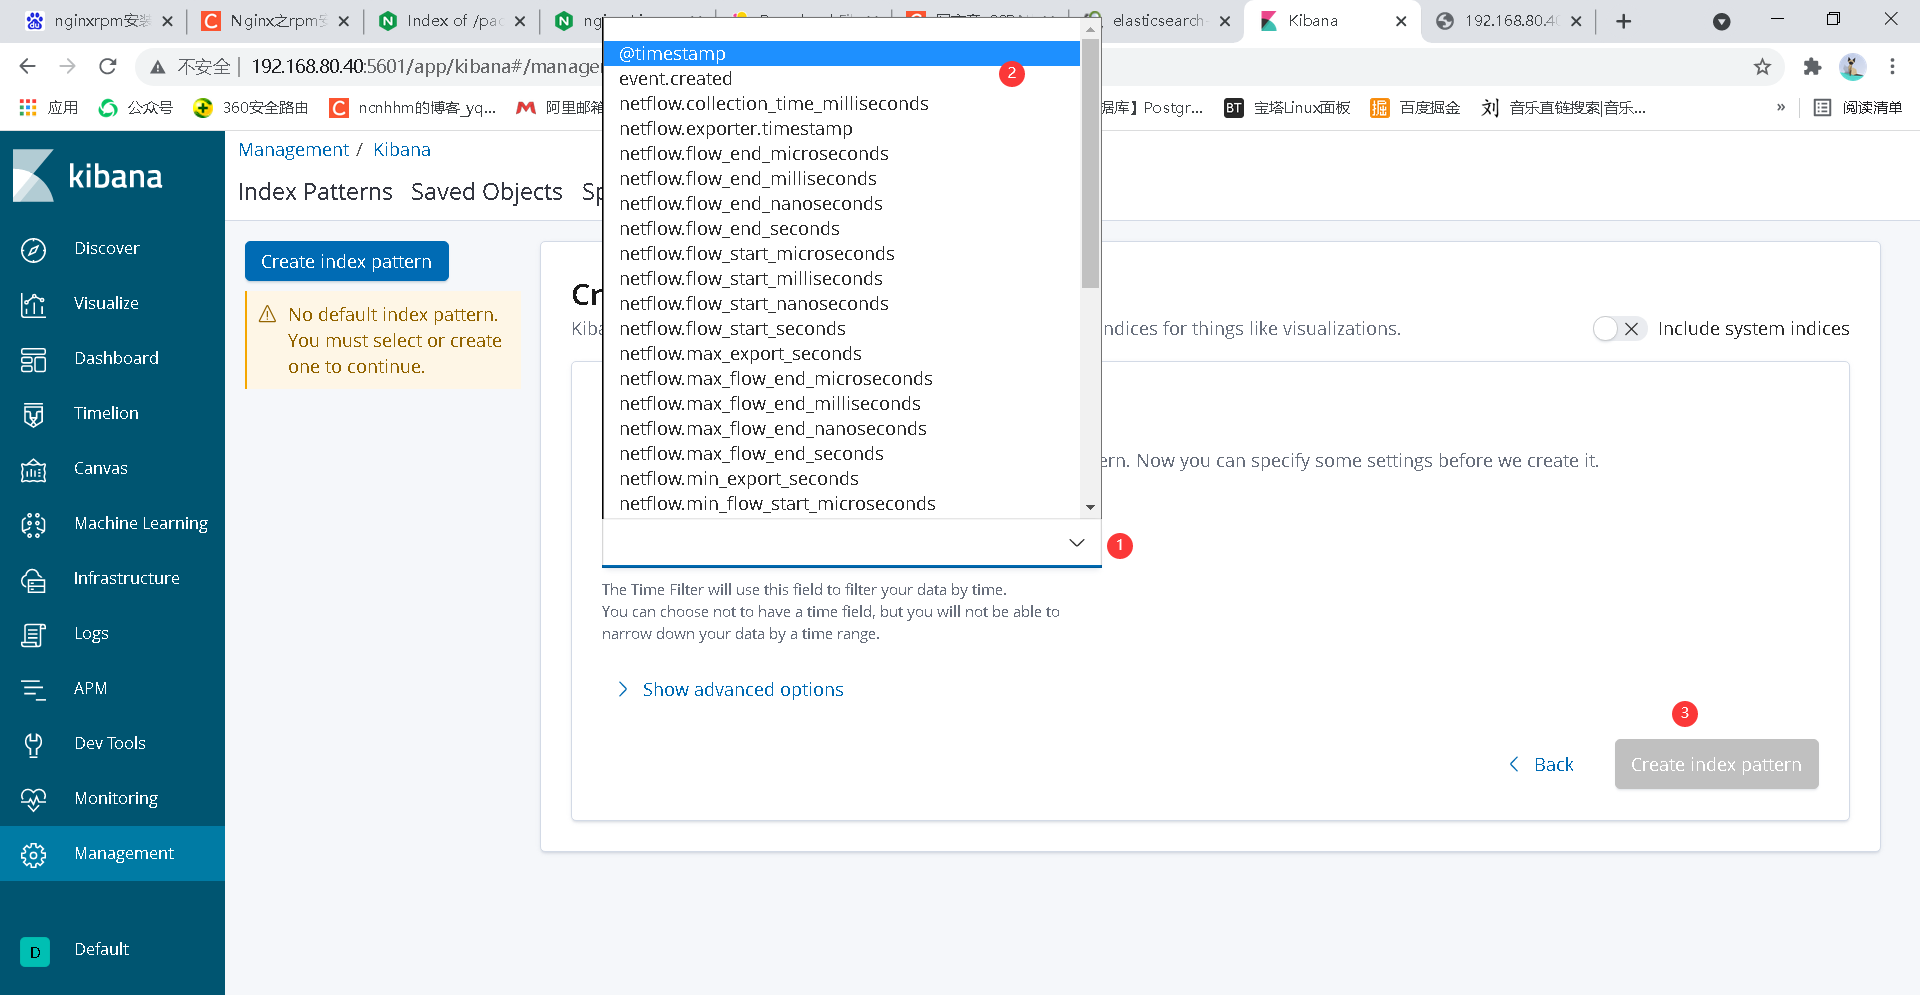
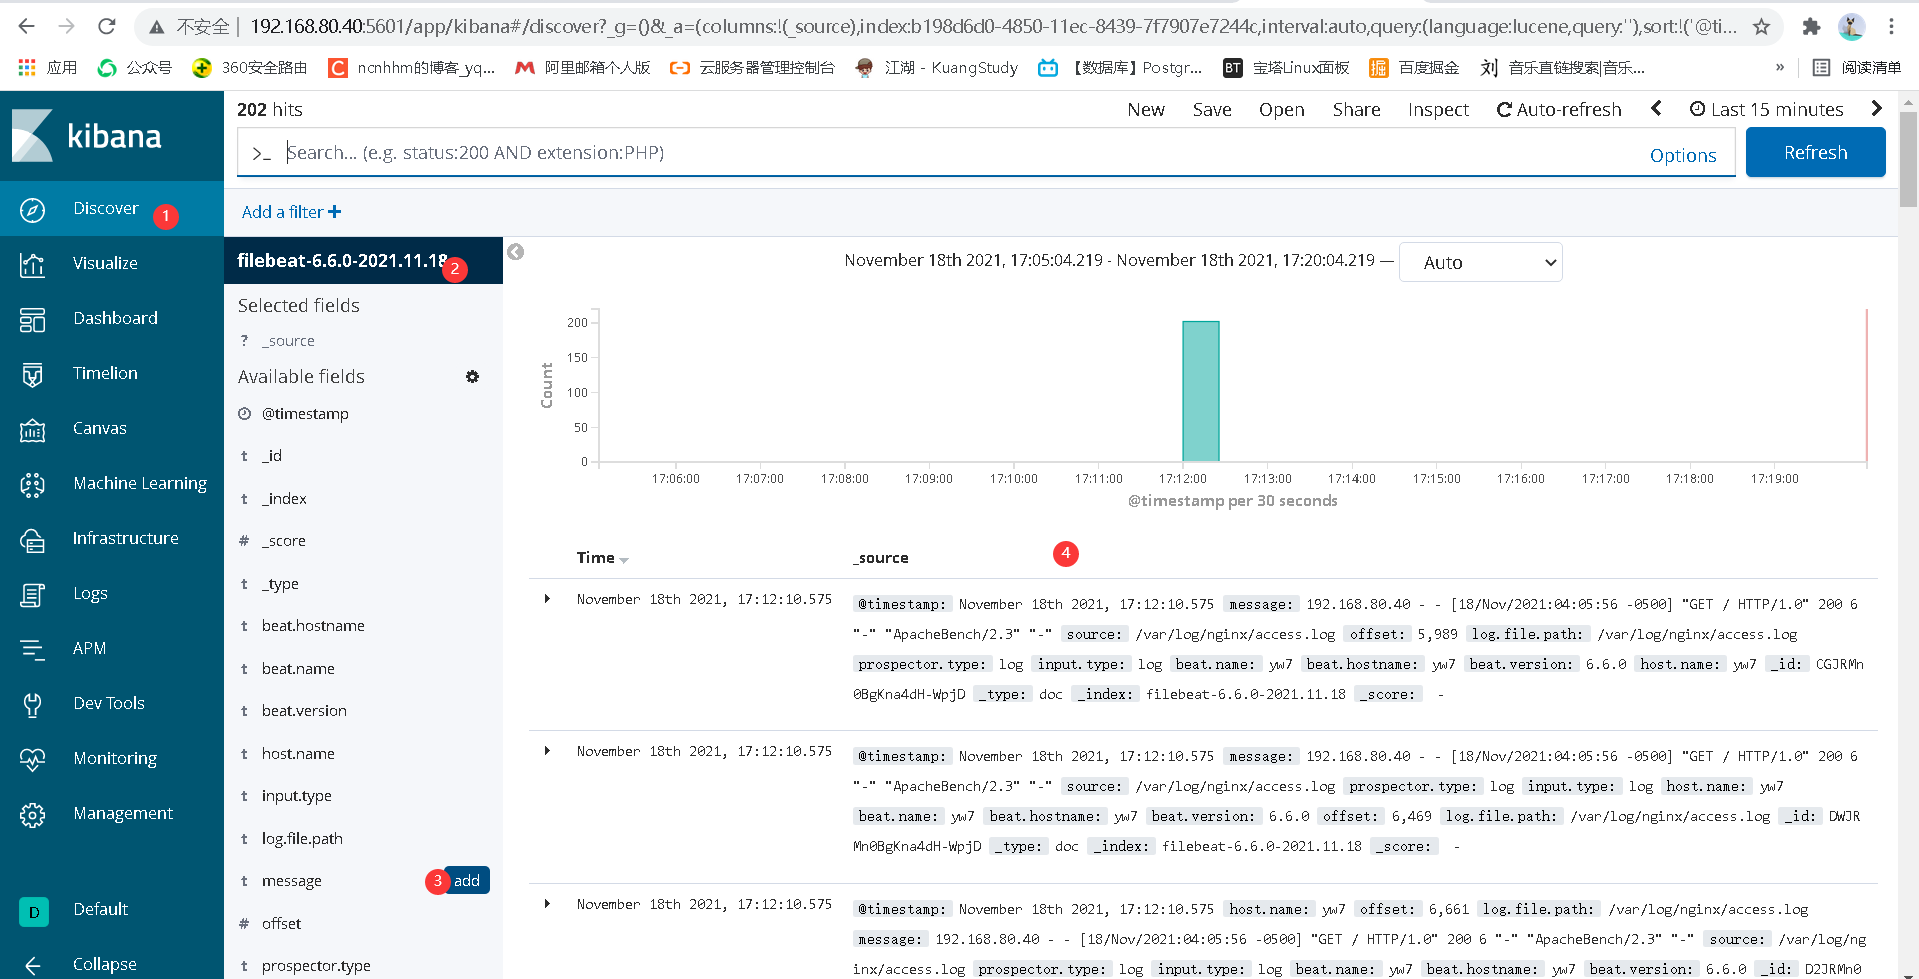
You can see our log information
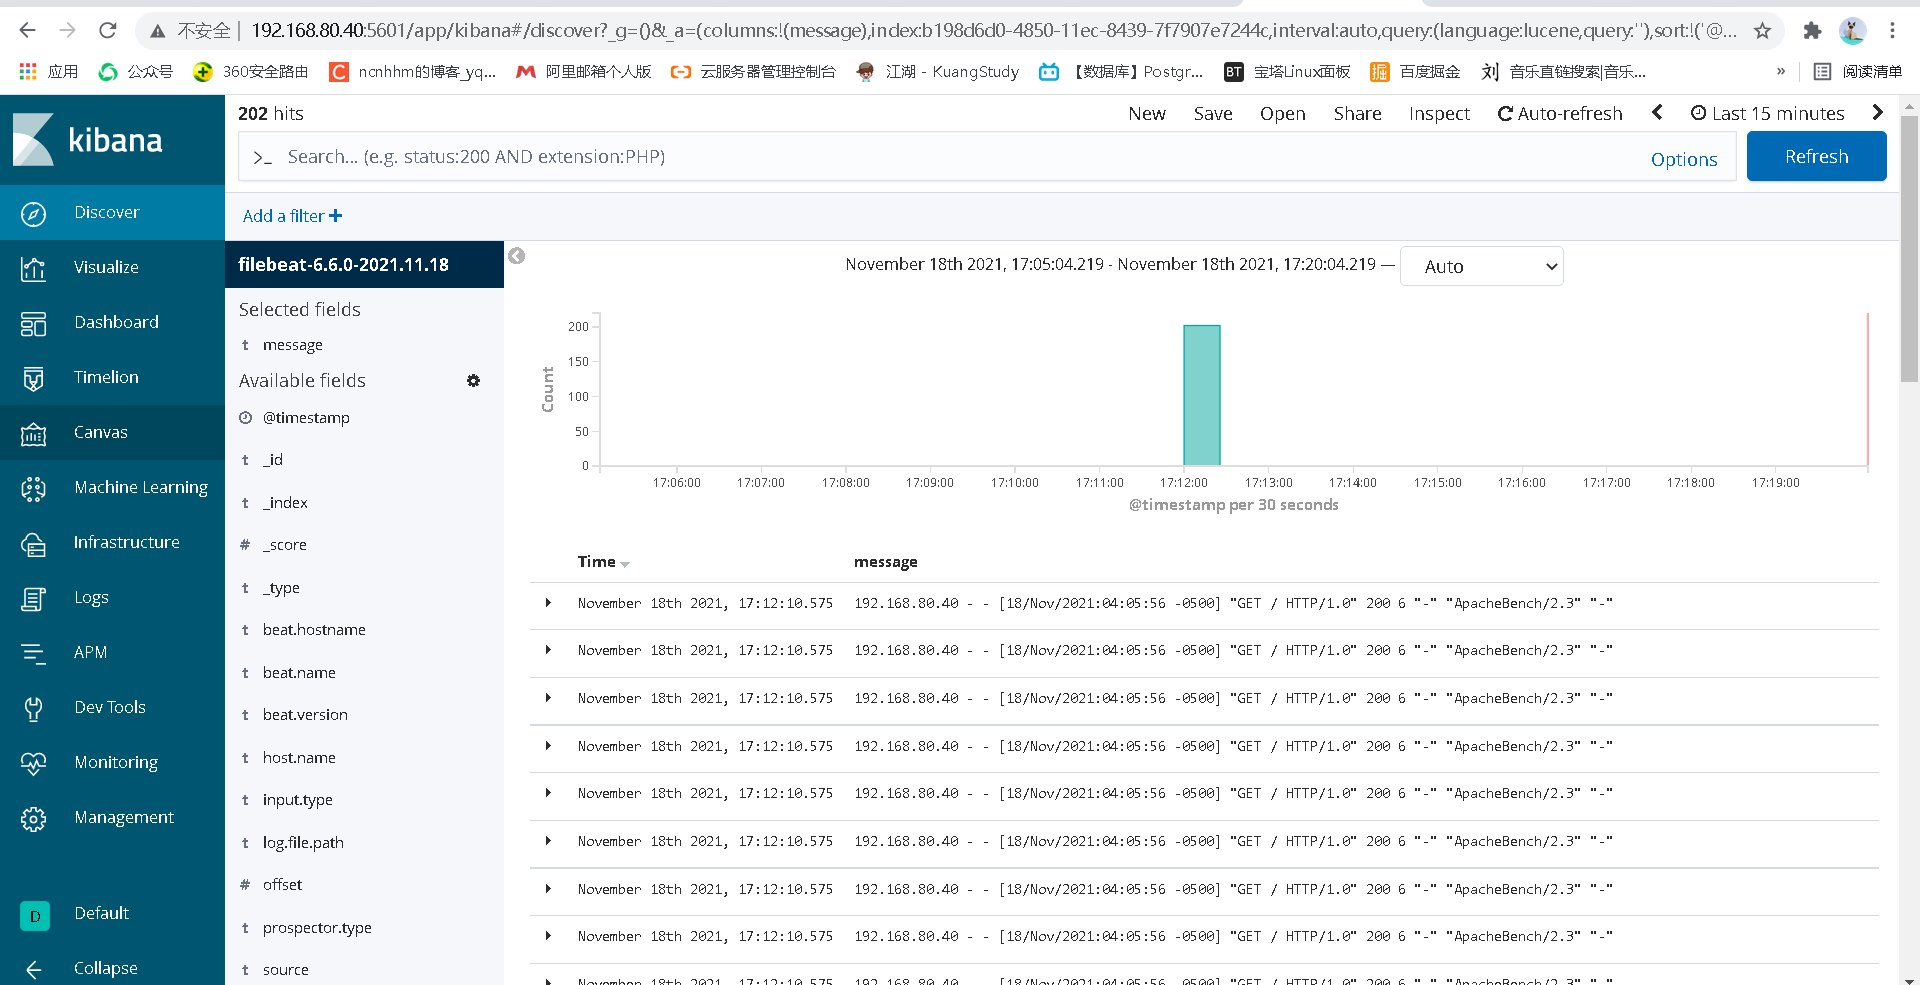
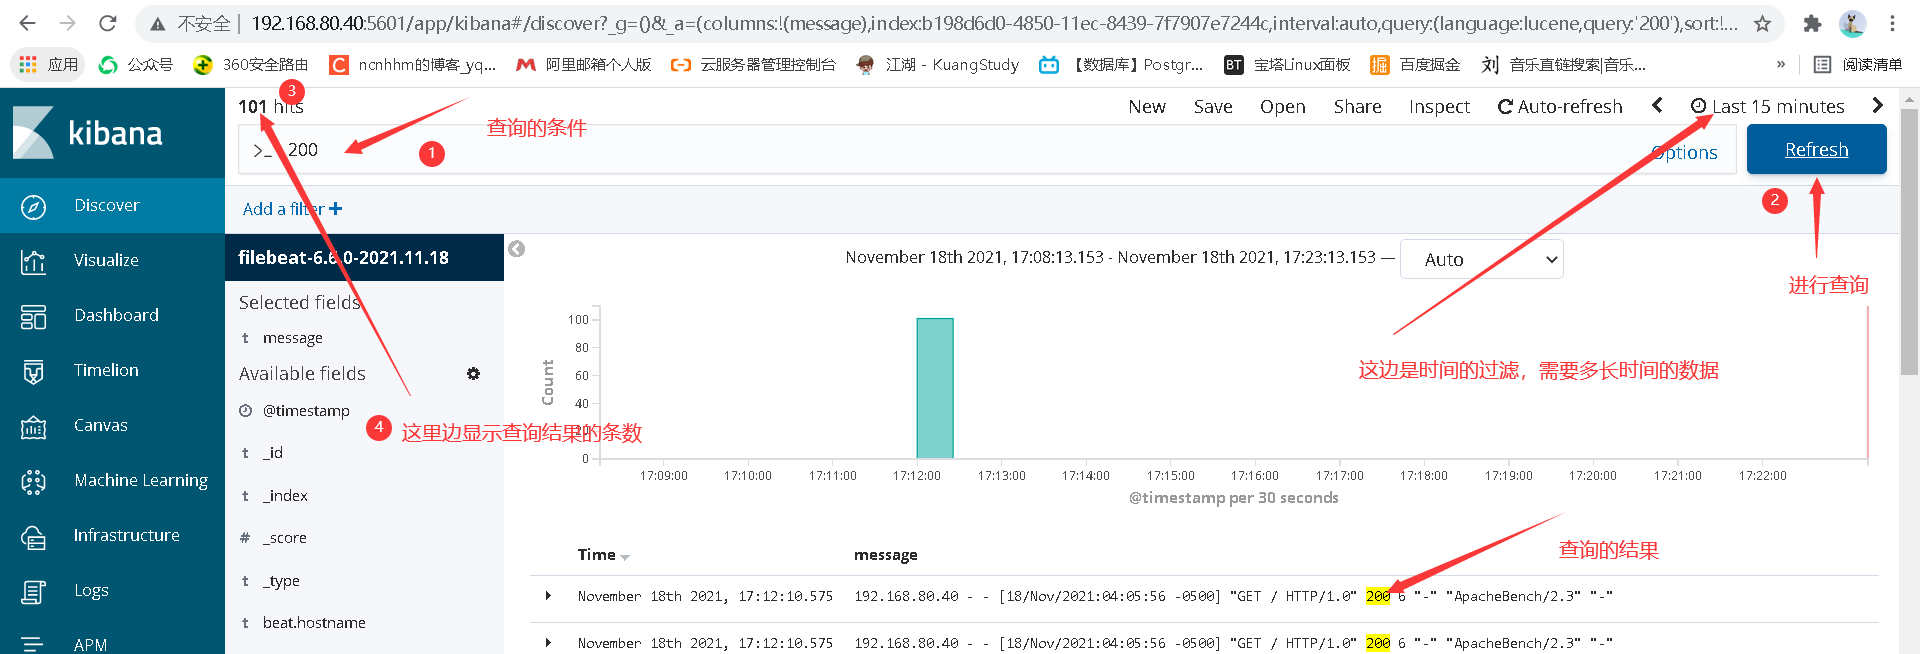
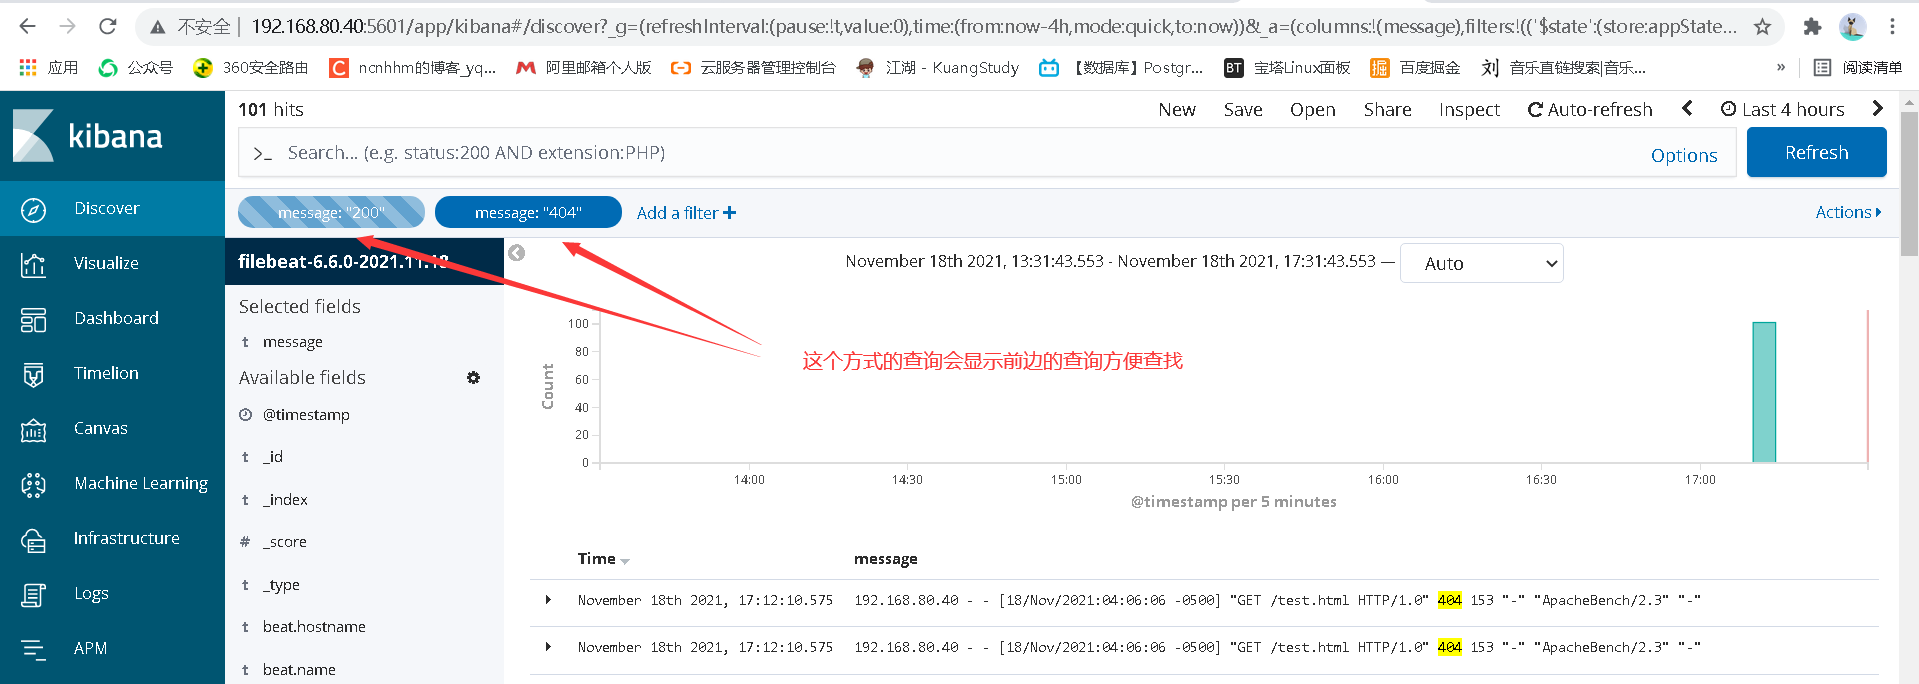
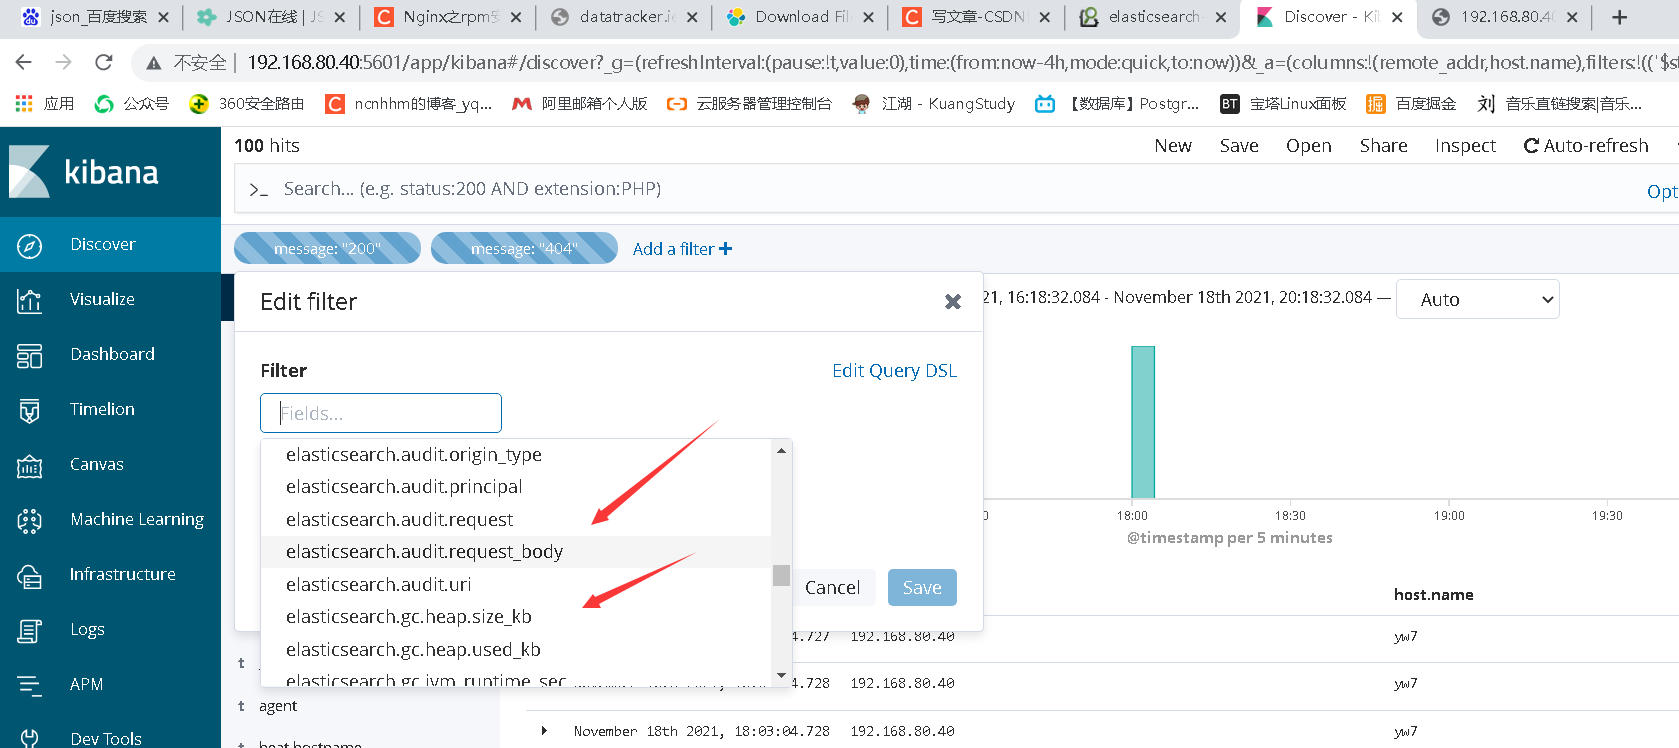
5. kibana filters log information
5.1 mode I
5.2 mode II
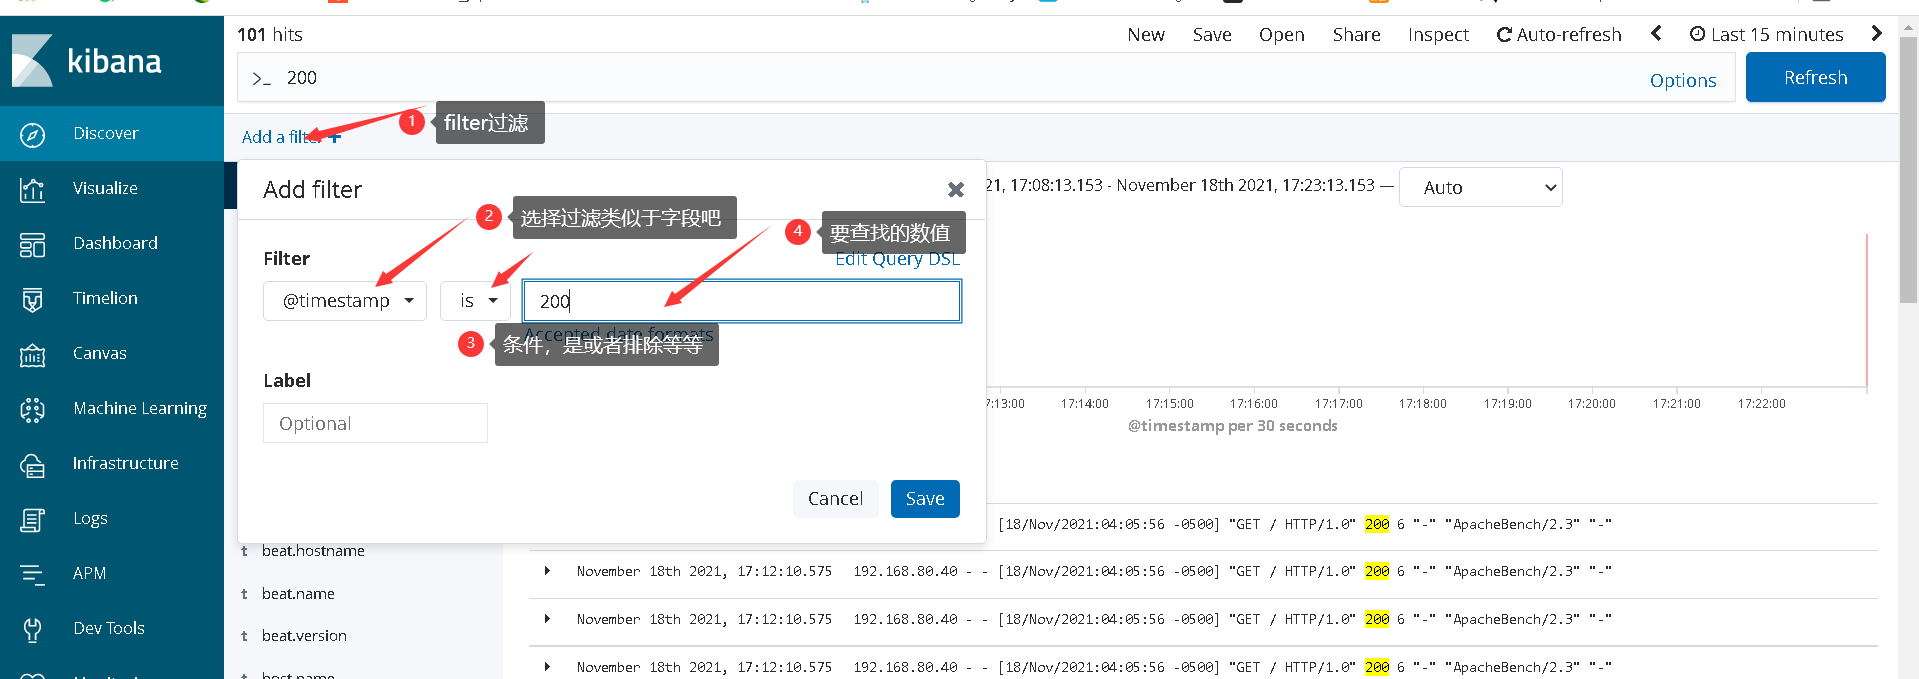
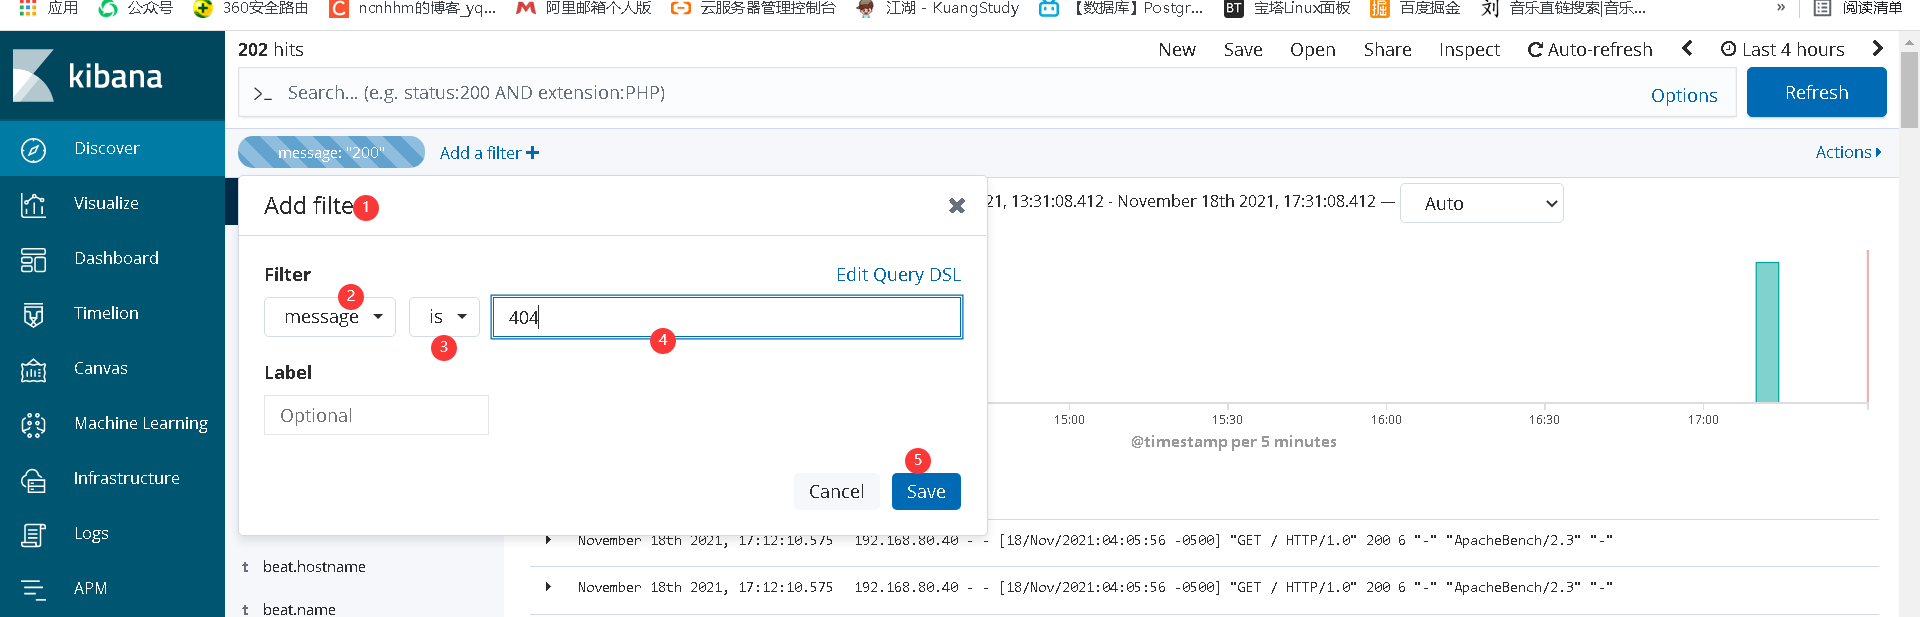
Benefits: easy to view the front
6. Optimization after construction
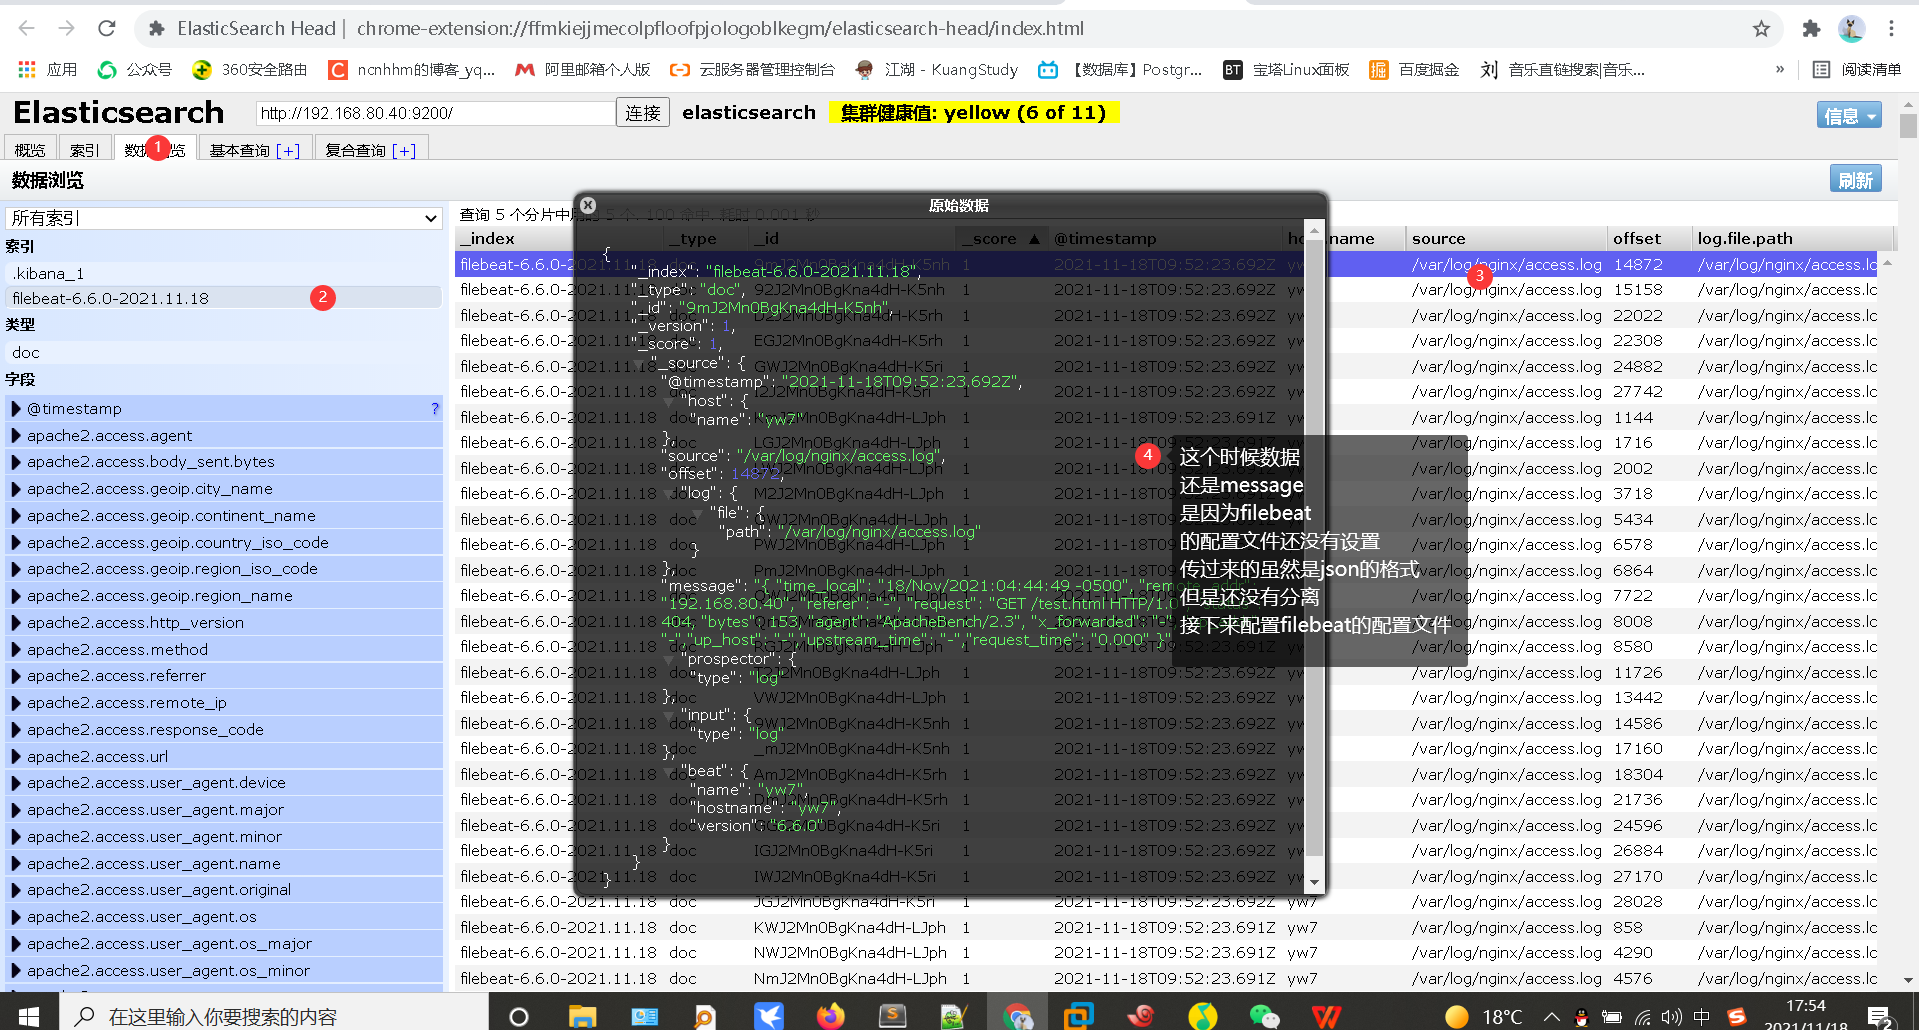
6.1 question 1: the log data is a complete message
"message": "192.168.80.40 - - [18/Nov/2021:04:05:56 -0500]
 "GET / HTTP/1.0" 200 6 "-" "ApacheBench/2.3" "-"",
It is not conducive to viewing, nor is it conducive to viewing on kibana
First, we change the log format of nginx. Because the data format of es is json, we first configure the log format of nginx
vim /etc/nginx/nginx.conf

 log_format json  '{ "time_local": "$time_local", '
                           '"remote_addr": "$remote_addr", '
                           '"referer": "$http_referer", '
                           '"request": "$request", '
                           '"status": $status, '
                           '"bytes": $body_bytes_sent, '
                           '"agent": "$http_user_agent", '
                           '"x_forwarded": "$http_x_forwarded_for", '
                           '"up_addr": "$upstream_addr",'
                           '"up_host": "$upstream_http_host",'
                           '"upstream_time": "$upstream_response_time",'
                           '"request_time": "$request_time"'
    ' }';

    access_log  /var/log/nginx/access.log  json;
Clear log
> /var/log/nginx/access.log
systemctl  restart nginx
visit:
ab -c 10 -n 100 192.168.80.40/
ab -c 10 -n 100 192.168.80.40/test.html
At this time, the format of the log changes
{ "time_local": "18/Nov/2021:04:44:49 -0500", "remote_addr": "192.168.80.40", "referer": "-", "request": "GET /test.html HTTP/1.0", "status": 404, "bytes": 153, "agent": "ApacheBench/2.3", "x_forwarded": "-", "up_addr": "-","up_host": "-","upstream_time": "-","request_time": "0.000" }
Using json parser
https://www.sojson.com/
{
	"time_local": "18/Nov/2021:04:44:49 -0500",
	"remote_addr": "192.168.80.40",
	"referer": "-",
	"request": "GET /test.html HTTP/1.0",
	"status": 404,
	"bytes": 153,
	"agent": "ApacheBench/2.3",
	"x_forwarded": "-",
	"up_addr": "-",
	"up_host": "-",
	"upstream_time": "-",
	"request_time": "0.000"
}
Let's look at the data changes above es
First delete the original data
Empty data directory
systemctl stop filebeat
rm -f /var/lib/filebeat/*
systemctl start  filebeat
Viewing changes in data
File configuration for filebeat
cd /etc/filebeat
 be careful filebeat Configuration file yml Format writing

vim filebeat.yml

filebeat.inputs:
- type: log
  enabled: true
  paths:
    - /var/log/nginx/access.log
  json.keys_under_root: true
  json.overwrite_keys: true
output.elasticsearch:
  hosts: ["localhost:9200"]


==================================
Just add inputs
json.keys_under_root: true
json.overwrite_keys: true
Restart
1.delete es Data above es-head
2.delete filebeat The location where the accessed data log is recorded
3.restart
4.es-head View data
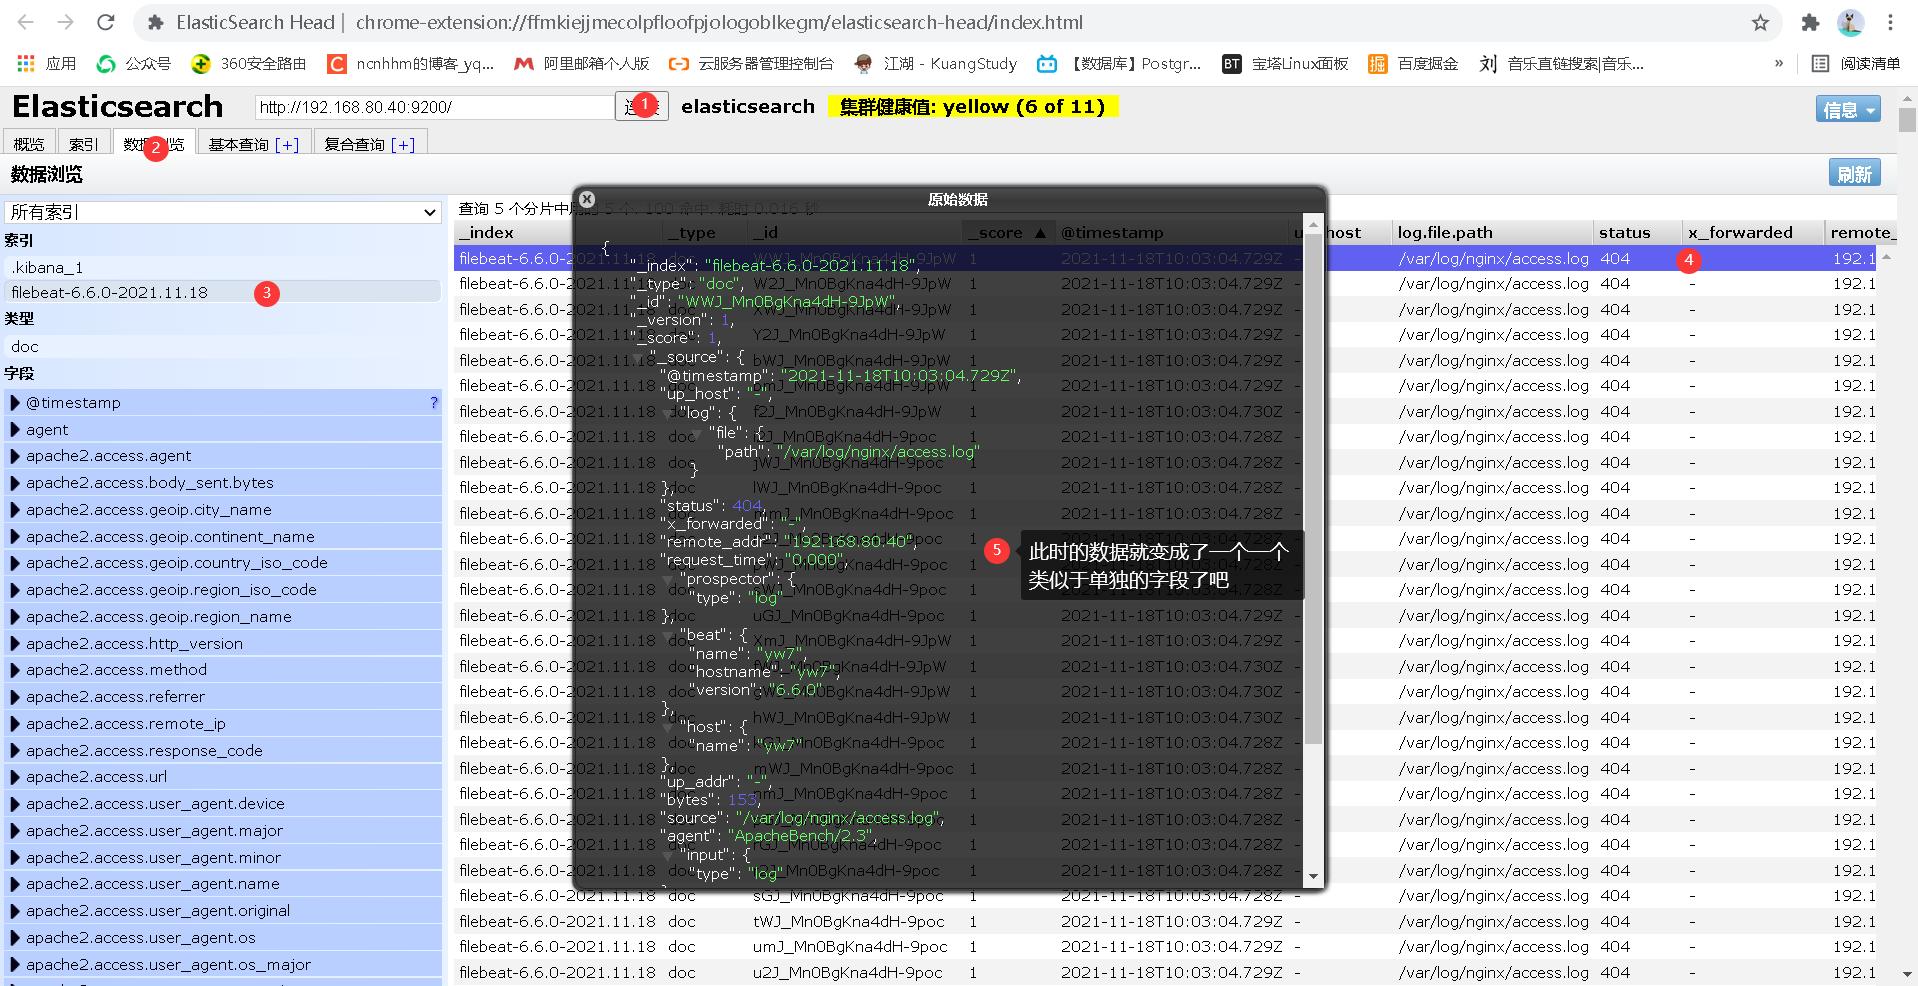
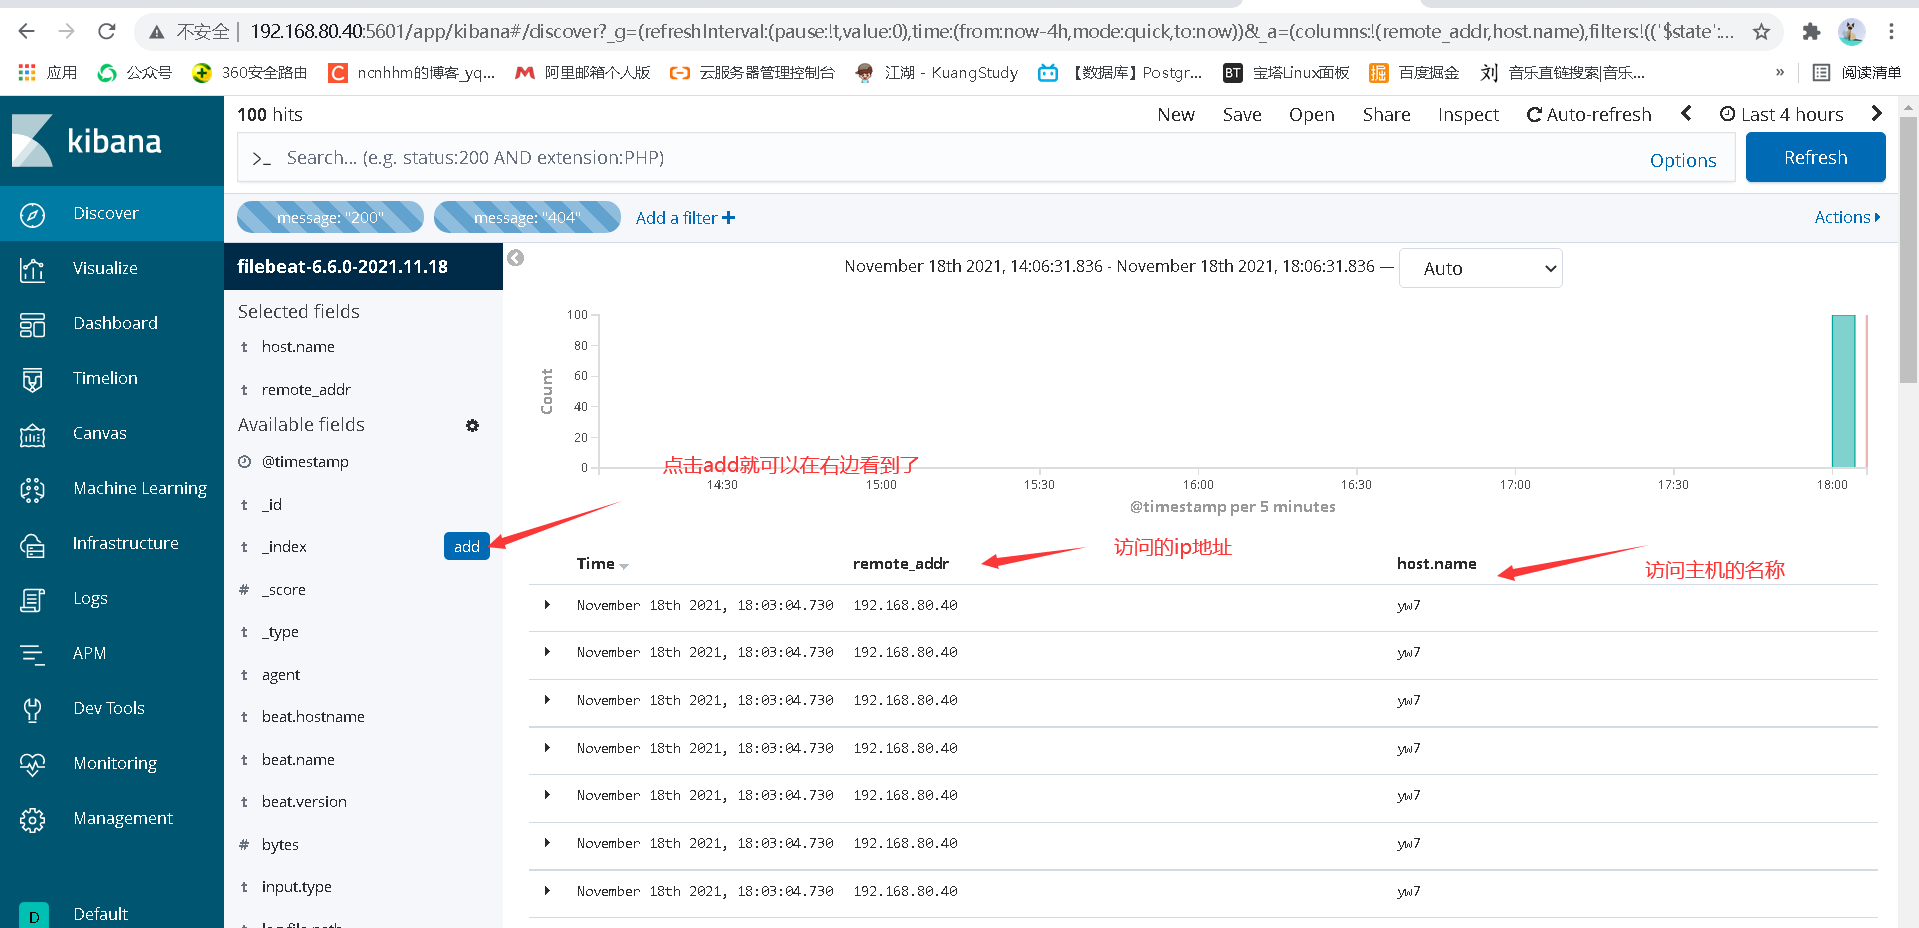
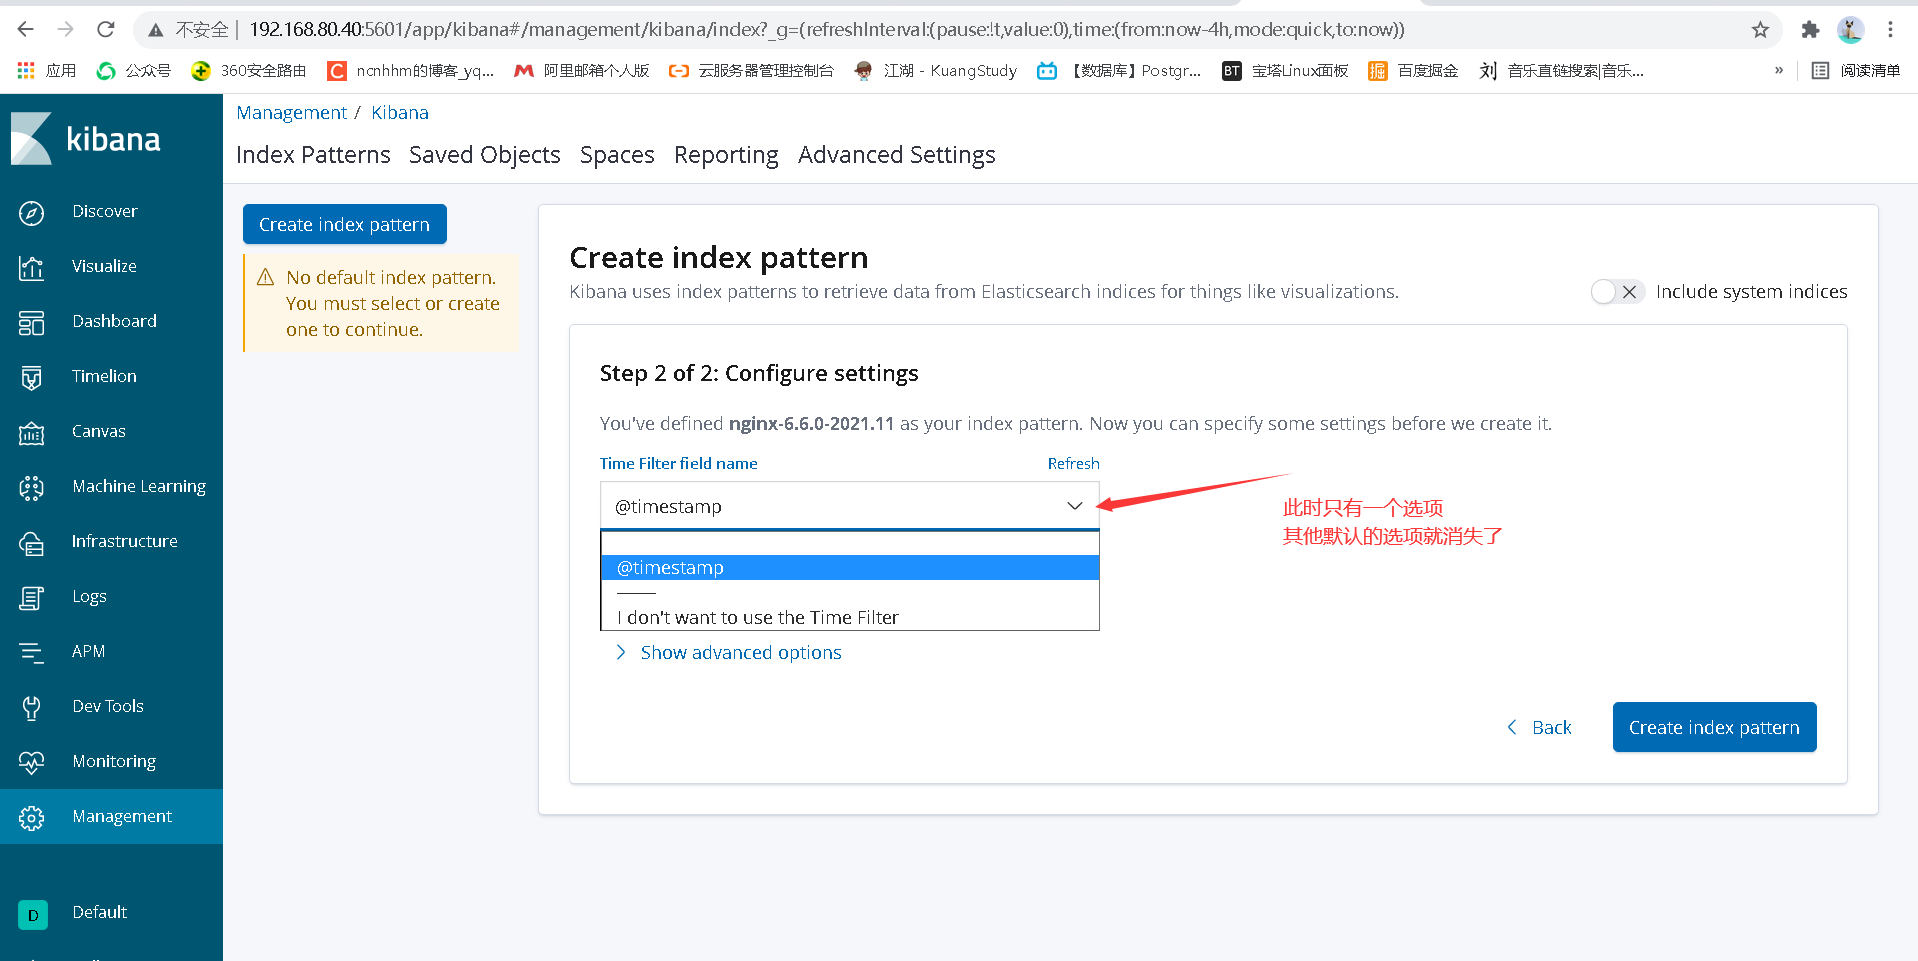
Then we reconfigure kibana
View ip only
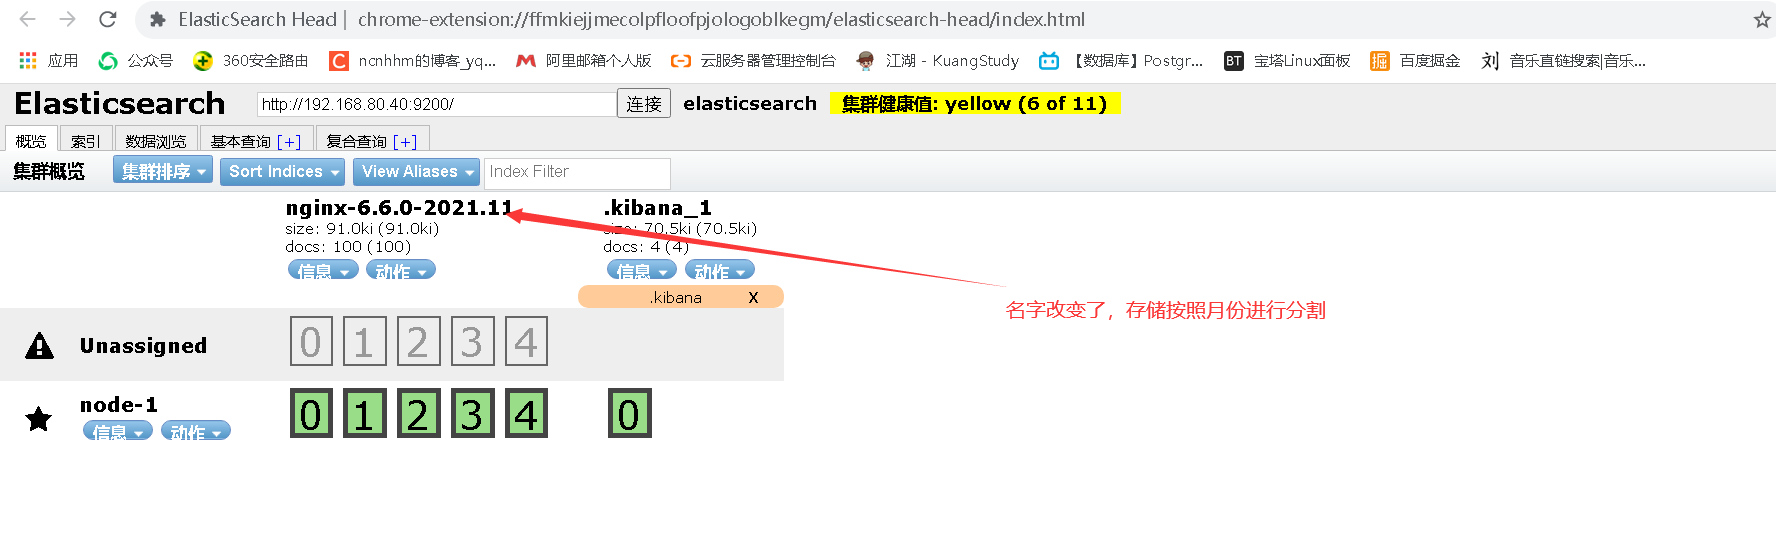
6.2 in addition to the above problems, many default configuration data will appear in kibana. The name of the data is default and we will change it
https://www.elastic.co/guide/en/beats/filebeat/6.6/elasticsearch-output.html
vim filebeat.yml

filebeat.inputs:
- type: log
  enabled: true
  paths:
    - /var/log/nginx/access.log
  json.keys_under_root: true
  json.overwrite_keys: true
setup.kibana:
  host: "192.168.80.40:5601"
output.elasticsearch:
  hosts: ["localhost:9200"]
  index: "nginx-%{[beat.version]}-%{+yyyy.MM}"
setup.template.name: "nginx"
setup.template.pattern: "nginx-*"
setup.template.enabled: false
setup.template.overwrite: true


kibana Host
setup.kibana:
  host: "192.168.80.40:5601"

Format of log
Split monthly     yyyy.MM.dd Every day
index: "nginx-%{[beat.version]}-%{+yyyy.MM}"
Name, the four below are indispensable
setup.template.name: "nginx"
setup.template.pattern: "nginx-*"
setup.template.enabled: false
setup.template.overwrite: true
Restart
1.delete es Data above es-head
2.delete filebeat The location where the accessed data log is recorded /var/lib/filebeat/*
3.restart
4.es-head View data
6.3 collect more complete data
vim filebeat.yml

filebeat.inputs:
- type: log
  enabled: true
  paths:
    - /var/log/nginx/access.log
  json.keys_under_root: true
  json.overwrite_keys: true
  tags: ["access"]
- type: log
  enabled: true
  paths:
    - /var/log/nginx/error.log
  tags: ["error"]
setup.template.settings:
  index.number_of_shards: 3
setup.kibana:
  host: "192.168.80.40:5601"
output.elasticsearch:
  hosts: ["localhost:9200"]
  indices:
    - index: "nginx_access-%{[beat.version]}-%{+yyyy.MM.dd}"
      when.contains:
        tags: "access"
    - index: "nginx_error-%{[beat.version]}-%{+yyyy.MM.dd}"
      when.contains:
        tags: "error"
setup.template.name: "nginx"
setup.template.pattern: "nginx_*"
setup.template.enabled: false
setup.template.overwrite: true