Principle and introduction of ELK
Why ELK is used:
In general, we need log analysis scenarios: grep, awk can get the information we want directly in the log file.However, in large-scale scenarios, this method is inefficient and faces issues such as how to archive logs when the volume is too large, how to search text too slowly, and how to query in multiple dimensions.Centralized log management is required, and logs on all servers are collected and summarized.The common solution is to set up a centralized log collection system to collect, manage and access logs on all nodes.
Generally, large-scale systems are a distributed deployment architecture. Different service modules are deployed on different servers. When problems occur, most situations need to locate specific servers and service modules according to the key information exposed by the problems, and build a centralized log system to improve the efficiency of locating problems.
A complete centralized logging system needs to include the following main features:
Collection - Ability to collect log data from multiple sources
2. Transport - Ability to transfer log data steadily to the central system
3. Storage - how to store log data
4. Analysis - UI analysis can be supported
5. Warning - Ability to provide error reports, monitoring mechanisms
ELK provides a complete set of solutions, and are open source software, which work together perfectly to meet many applications efficiently.A current mainstream logging system.
ELK Introduction:
ELK is the abbreviation of three open source software, namely Elasticsearch, Logstash, Kibana. They are all open source software.A new FileBeat is a lightweight Log Collection Processing Tool (Agent). Filebeat takes up less resources and is suitable for transferring to Logstash after searching for logs on various servers, which is also recommended by the authorities.
Elasticsearch is an open source distributed search engine that provides three main functions: collecting, analyzing and storing data.Its features are: distributed, zero configuration, automatic discovery, index auto-slicing, index copy mechanism, restful style interface, multiple data sources, automatic search load, etc.
Logstash is a tool for collecting, analyzing and filtering logs, which supports a large number of data acquisition methods.The client side is installed on the host that needs to collect logs. The server side is responsible for filtering, modifying and so on the logs received from each node and sending them to elastic search concurrently.
Kibana is also an open source and free tool that provides a log analysis friendly Web interface for Logstash and ElasticSearch to help summarize, analyze, and search important data logs.
Filebeat belongs to Beats.Currently Beats has four tools:
1.Packetbeat (collect network traffic data)
2.Topbeat (collects system, process, and file system level CPU and memory usage data, etc.)
3.Filebeat
4.Winlogbeat (Collect Windows Event Log Data)
Official documents:
Filebeat:
https://www.elastic.co/cn/products/beats/filebeat
https://www.elastic.co/guide/en/beats/filebeat/5.6/index.html
Logstash:
https://www.elastic.co/cn/products/logstash
https://www.elastic.co/guide/en/logstash/5.6/index.html
Kibana:
https://www.elastic.co/cn/products/kibana
https://www.elastic.co/guide/en/kibana/5.5/index.html
Elasticsearch:
https://www.elastic.co/cn/products/elasticsearch
https://www.elastic.co/guide/en/elasticsearch/reference/5.6/index.html
elasticsearch Chinese Community:
https://elasticsearch.cn/
Experimental environment:
|
operating system |
IP Address |
host name |
Package List |
|
CentOS6.5-x86_64 |
192.168.8.100 |
Nginx+Filebeat |
nginx-1.13.12.tar.gz filebeat-6.3.1-linux-x86_64.tar.gz |
|
CentOS6.5-x86_64 |
192.168.8.101 |
Apache+Filebeat |
httpd-2.4.33.tar.gz filebeat-6.3.1-linux-x86_64.tar.gz |
|
CentOS6.5-x86_64 |
192.168.8.102 |
Elasticserch |
elasticsearch-6.3.1.tar.gz |
|
CentOS6.5-x86_64 |
192.168.8.103 |
Logstash |
logstash-6.3.1.tar.gz
|
|
CentOS6.5-x86_64 |
192.168.8.104 |
Kibana |
kibana-6.3.1-linux-x86_64.tar.gz
|
Deploy ELK:
1. Set up client Nginx (recommended to use yum installation for testing, I used yum installation for testing kibana
[root@nginx ~]# hostname
nginx
[root@nginx ~]# cat /etc/redhat-release
CentOS release 6.5 (Final)
[root@nginx ~]# uname -r
2.6.32-431.el6.x86_64
[root@nginx ~]# /etc/init.d/iptables stop
iptables: Set Chain as Policy ACCEPT: filter                    [Determine]
iptables: Clear firewall rules:                                 [Determine]
iptables: Unloading module:                                   [Determine]
[root@nginx ~]# setenforce 0
setenforce: SELinux is disabled
[root@nginx ~]# chkconfig iptables off
[root@nginx ~]# tar xf nginx-1.13.12.tar.gz -C /usr/src/
2. Deploy client Apache (recommended to use yum installation for testing, I used yum installation for testing kibana)
[root@Apache ~]# hostname
Apache
[root@Apache ~]# cat /etc/redhat-release
CentOS release 6.5 (Final)
[root@Apache ~]# uname -r
2.6.32-431.el6.x86_64
[root@Apache ~]# /etc/init.d/iptables stop
[root@Apache ~]# setenforce 0
[root@Apache ~]# tar xf apr-1.5.1.tar.gz -C /usr/src/
[root@Apache ~]# tar xf apr-util-1.5.1.tar.gz -C /usr/src/
[root@Apache ~]# tar xf  httpd-2.4.33.tar.gz  -C /usr/src/
[root@Apache ~]# cd /usr/src/apr-1.5.1/
[root@Apache apr-1.5.1]# ./configure prefix=/usr/local/apr && make && make install
[root@Apache apr-1.5.1]# cd ../apr-util-1.5.1/
[root@Apache apr-util-1.5.1]# ./configure --prefix=/usr/local/apr-util --with-apr=/usr/local/apr/ && make && make install
[root@Apache apr-util-1.5.1]# cd ../httpd-2.4.33/
[root@Apache httpd-2.4.33]# ./configure --prefix=/usr/local/httpd --enable-so --enable-rewrite --enable-header --enable-charset-lite --enable-cgi --with-apr=/usr/local/apr/ --with-apr-util=/usr/local/apr-util/ && make && make install
[root@Apache httpd-2.4.33]# ln -s /usr/local/httpd/bin/* /usr/local/sbin/
[root@Apache httpd-2.4.33]# apachectl start
AH00557: httpd: apr_sockaddr_info_get() failed for Apache
AH00558: httpd: Could not reliably determine the server's fully qualified domain name, using 127.0.0.1. Set the 'ServerName' directive globally to suppress this message
[root@Apache httpd-2.4.33]# netstat -anpt|grep httpd
tcp        0      0 :::80                       :::*                        LISTEN      34117/httpd
3. Deploying Elasticserch (JDK is required for Logstash and Kibana)
1. View the system environment:
[root@Elasticserch ~]# hostname
Elasticserch
[root@Elasticserch ~]# cat /etc/redhat-release
CentOS release 6.5 (Final)
[root@Elasticserch ~]# uname -r
2.6.32-431.el6.x86_64
[root@Elasticserch ~]# /etc/init.d/iptables stop
[root@Elasticserch ~]# setenforce 0
2. Install JDK environment: (Note Delete and reinstall old version of JDK if the system used to be)
[root@Elasticserch ~]# tar xf jdk-8u161-linux-x64.tar.gz
[root@Elasticserch ~]# mv jdk1.8.0_161/ /usr/local/java
[root@Elasticserch ~]# vim /etc/profile.d/java.sh
export JAVA_HOME=/usr/local/java
export PATH=$PATH:$JAVA_HOME/bin
[root@Elasticserch ~]# source /etc/profile
[root@Elasticserch ~]# java -version
java version "1.8.0_161"
Java(TM) SE Runtime Environment (build 1.8.0_161-b12)
Java HotSpot(TM) 64-Bit Server VM (build 25.161-b12, mixed mode)
3. Install the Elasticserch node:
[root@Elasticserch ~]# tar xf elasticsearch-6.3.1.tar.gz
[root@Elasticserch ~]# mv elasticsearch-6.3.1 /usr/local/elasticsearch
[root@Elasticserch ~]# cd /usr/local/elasticsearch/
[root@Elasticserch elasticsearch]# cd config/
[root@Elasticserch config]# cp elasticsearch.yml{,.default}     #Back up configuration files to prevent modification errors
4. Modify the configuration file:
[root@Elasticserch config]# vim elasticsearch.yml
cluster.name: my-es-cluster           #The name of the cluster
node.name: node-1                 #Name of node
path.data: /usr/local/elasticsearch/data   #Data Path
path.logs: /usr/local/ elasticsearch /logs    #Log Path
bootstrap.memory_lock: false          #This line removes the comment and changes ture to false, which will cause service startup errors
bootstrap.system_call_filter: false      #Add this line or the startup will fail.
//Reasons for configuring the above two lines:
//This is because Centos6 does not support SecComp and the default bootstrap.system_call_filter for ES5.2.0 detects true, which causes the detection to fail and directly causes ES to fail to start.
network.host: 192.168.8.102          # elasticsearch host address
http.port: 9200                        #Port number
discovery.zen.ping.unicast.hosts: ["node-1"]  #Start a new node to discover through the host list.
discovery.zen.minimum_master_nodes: 1    #Total Nodes
[root@elasticsearch ~]# vim /etc/security/limits.d/90-nproc.conf
*          soft    nproc     4096   #Default 1024, changed to 4096
[root@elasticsearch ~]# vim /etc/sysctl.conf
#Append at the end or the service will fail.
vm.max_map_count=655360
[root@elasticsearch ~]# sysctl -p   #Make the above configuration effective
5. Create users to run elasticsearch:
[root@Elasticserch config]# useradd elasticsearch
[root@Elasticserch config]# chown -R elasticsearch.elasticsearch /usr/local/elasticsearch/
6. Modify the number of file handles:
[root@Elasticserch config]# vim /etc/security/limits.conf
#Add the following:
*               soft    nofile           65536
*               hard    nofile           65536
*               soft    nproc           65536
*               hard    nproc           65536
7. Switch User Startup Services
[root@Elasticserch config]# su - elasticsearch
[elasticsearch@Elasticserch ~]$ cd /usr/local/elasticsearch/
[elasticsearch@elasticsearch elasticsearch]$ bin/elasticsearch &
Note: If a startup error occurs, see if any of the yellow flags in the above configuration process are misconfigured or not.
8. Check if the service started successfully
[root@elasticsearch ~]# netstat -anpt
Active Internet connections (servers and established)
Proto Recv-Q Send-Q Local Address               Foreign Address             State       PID/Program name
tcp        0      0 0.0.0.0:111                 0.0.0.0:*                   LISTEN      1018/rpcbind
tcp        0      0 0.0.0.0:22                  0.0.0.0:*                   LISTEN      1152/sshd
tcp        0      0 127.0.0.1:25                0.0.0.0:*                   LISTEN      1228/master
tcp        0      0 0.0.0.0:3616                0.0.0.0:*                   LISTEN      1036/rpc.statd
tcp        0      0 192.168.8.102:22            192.168.8.254:64255         ESTABLISHED 1727/sshd
tcp        0     64 192.168.8.102:22            192.168.8.254:64756         ESTABLISHED 2617/sshd
tcp        0      0 :::34155                    :::*                        LISTEN      1036/rpc.statd
tcp        0      0 :::111                      :::*                        LISTEN      1018/rpcbind
tcp        0      0 :::9200                     :::*                        LISTEN      2180/java
tcp        0      0 :::9300                     :::*                        LISTEN      2180/java
tcp        0      0 :::22                       :::*                        LISTEN      1152/sshd
tcp        0      0 ::1:25                      :::*                        LISTEN      1228/master
9. Simple testing
[root@elasticsearch ~]# curl http://192.168.8.102:9200
{
  "name" : "node-1",
  "cluster_name" : "my-es_cluster",
  "cluster_uuid" : "3zTOiOpUSEC5Z4S-lo4TUA",
  "version" : {
    "number" : "6.3.1",
    "build_flavor" : "default",
    "build_type" : "tar",
    "build_hash" : "eb782d0",
    "build_date" : "2018-06-29T21:59:26.107521Z",
    "build_snapshot" : false,
    "lucene_version" : "7.3.1",
    "minimum_wire_compatibility_version" : "5.6.0",
    "minimum_index_compatibility_version" : "5.0.0"
  },
  "tagline" : "You Know, for Search"
}
The above results indicate that the ES configuration is complete and there is no problem
4. Deploy Logstash Node
1. View the system environment:
[root@Logstash ~]# hostname
Logstash
[root@Logstash ~]# cat /etc/redhat-release
CentOS release 6.5 (Final)
[root@Logstash ~]# uname -r
2.6.32-431.el6.x86_64
[root@Logstash ~]# /etc/init.d/iptables stop
iptables: Set Chain as Policy ACCEPT: filter                    [Determine]
iptables: Clear firewall rules:                                 [Determine]
iptables: Unloading module:                                   [Determine]
[root@Logstash ~]# setenforce 0
setenforce: SELinux is disabled
2. Install logstash, which listens for new content from data source files that are logstash processed and uploaded to es.
[root@Logstash ~]# tar xf logstash-6.3.1.tar.gz
[root@Logstash ~]# mv logstash-6.3.1 /usr/local/logstash
Modify its configuration file if necessary
3. Create a startup profile for logstash
[root@Logstash ~]#/usr/local/logstash/config/apache.conf
input {
  beats {
    port => "5044"
  }
}
filter {
  grok {
    match => { "message" => "%{COMBINEDAPACHELOG}" }
  }
  date {
    match => [ "timestamp", "dd/MMM/yyyy:HH:mm:ss Z" ]
    target => ["datetime"]
  }
  geoip {
    source => "clientip"
  }
}
output {
  elasticsearch {
    hosts => "192.168.8.102:9200" #ES Host IP and Port
    index => "access_log" #Indexes
  }
  stdout { codec => rubydebug }
}
4. Start logstash
[root@Logstash ~]#cd /usr/local/logstash/
[root@Logstash logstash]#ls
bin  config  CONTRIBUTORS  data  Gemfile  Gemfile.lock  lib  LICENSE.txt  logs  logstash-core  logstash-core-plugin-api  modules  NOTICE.TXT  tools  vendor  x-pack
[root@Logstash logstash]./bin/logstash -f config/apache.conf
[root@Logstash ~]# netstat -anpt
Active Internet connections (servers and established)
Proto Recv-Q Send-Q Local Address               Foreign Address             State       PID/Program name
tcp        0      0 0.0.0.0:111                 0.0.0.0:*                   LISTEN      1019/rpcbind
tcp        0      0 0.0.0.0:22                  0.0.0.0:*                   LISTEN      1153/sshd
tcp        0      0 127.0.0.1:25                0.0.0.0:*                   LISTEN      1229/master
tcp        0      0 0.0.0.0:47370               0.0.0.0:*                   LISTEN      1037/rpc.statd
tcp        0      0 192.168.8.103:22            192.168.8.254:49219         ESTABLISHED 1910/sshd
tcp        0      0 192.168.8.103:22            192.168.8.254:52930         ESTABLISHED 2467/sshd
tcp        0    288 192.168.8.103:22            192.168.8.254:65405         ESTABLISHED 3241/sshd
tcp        0      0 :::111                      :::*                        LISTEN      1019/rpcbind
tcp        0      0 :::80                       :::*                        LISTEN      2409/httpd
tcp        0      0 :::5043                     :::*                        LISTEN      2877/java
tcp        0      0 :::5044                     :::*                        LISTEN      2686/java
tcp        0      0 :::64917                    :::*                        LISTEN      1037/rpc.statd
tcp        0      0 :::22                       :::*                        LISTEN      1153/sshd
tcp        0      0 ::1:25                      :::*                        LISTEN      1229/master
tcp        0      0 ::ffff:127.0.0.1:9600       :::*                        LISTEN      2686/java
tcp        0      0 ::ffff:127.0.0.1:9601       :::*                        LISTEN      2877/java
I started two logstash instance ports here, 5044 and 5043, respectively
5. Deploy Kibana Node
1. View the system environment:
[root@Kibana ~]# hostname
Kibana
[root@Kibana ~]# cat /etc/redhat-release
CentOS release 6.5 (Final)
[root@Kibana ~]# uname -r
2.6.32-431.el6.x86_64
2. Install kibana
[root@Kibana ~]# tar xf kibana-6.3.1-linux-x86_64.tar.gz
[root@Kibana ~]# mv kibana-6.3.1-linux-x86_64 /usr/local/kibana
[root@Kibana ~]# cd /usr/local/kibana/config/
[root@Kibana config]# cp kibana.yml{,.default}
3. Edit the configuration file:
[root@Kibana config]# vim kibana.yml
server.port: 5601              #Remove comments from this line
server.host: "192.168.8.104"   #Remove comments and write local addresses
elasticsearch.url: "http://192.168.8.102:9200 "#Write the IP of the elasticsearch host
4. Start the service:
[root@Kibana ~]#cd /usr/local/kibana/bin
[root@Kibana bin]./kibana
  log   [21:22:38.557] [info][status][plugin:kibana@6.3.1] Status changed from uninitialized to green - Ready
  log   [21:22:38.603] [info][status][plugin:elasticsearch@6.3.1] Status changed from uninitialized to yellow - Waiting for Elasticsearch
  log   [21:22:38.608] [info][status][plugin:xpack_main@6.3.1] Status changed from uninitialized to yellow - Waiting for Elasticsearch
  log   [21:22:38.621] [info][status][plugin:searchprofiler@6.3.1] Status changed from uninitialized to yellow - Waiting for Elasticsearch
  log   [21:22:38.629] [info][status][plugin:ml@6.3.1] Status changed from uninitialized to yellow - Waiting for Elasticsearch
  log   [21:22:38.698] [info][status][plugin:tilemap@6.3.1] Status changed from uninitialized to yellow - Waiting for Elasticsearch
  log   [21:22:38.700] [info][status][plugin:watcher@6.3.1] Status changed from uninitialized to yellow - Waiting for Elasticsearch
  log   [21:22:38.723] [info][status][plugin:license_management@6.3.1] Status changed from uninitialized to green - Ready
  log   [21:22:38.725] [info][status][plugin:index_management@6.3.1] Status changed from uninitialized to yellow - Waiting for Elasticsearch
  log   [21:22:38.858] [info][status][plugin:timelion@6.3.1] Status changed from uninitialized to green - Ready
  log   [21:22:38.860] [info][status][plugin:graph@6.3.1] Status changed from uninitialized to yellow - Waiting for Elasticsearch
  log   [21:22:38.863] [info][status][plugin:monitoring@6.3.1] Status changed from uninitialized to green - Ready
  log   [21:22:38.865] [info][status][plugin:security@6.3.1] Status changed from uninitialized to yellow - Waiting for Elasticsearch
  log   [21:22:38.867] [warning][security] Generating a random key for xpack.security.encryptionKey. To prevent sessions from being invalidated on restart, please set xpack.security.encryptionKey in kibana.yml
  log   [21:22:38.873] [warning][security] Session cookies will be transmitted over insecure connections. This is not recommended.
  log   [21:22:38.920] [info][status][plugin:grokdebugger@6.3.1] Status changed from uninitialized to yellow - Waiting for Elasticsearch
  log   [21:22:38.933] [info][status][plugin:dashboard_mode@6.3.1] Status changed from uninitialized to green - Ready
  log   [21:22:38.940] [info][status][plugin:logstash@6.3.1] Status changed from uninitialized to yellow - Waiting for Elasticsearch
  log   [21:22:38.967] [info][status][plugin:apm@6.3.1] Status changed from uninitialized to green - Ready
  log   [21:22:38.974] [info][status][plugin:console@6.3.1] Status changed from uninitialized to green - Ready
  log   [21:22:38.979] [info][status][plugin:console_extensions@6.3.1] Status changed from uninitialized to green - Ready
  log   [21:22:38.986] [info][status][plugin:metrics@6.3.1] Status changed from uninitialized to green - Ready
  log   [21:22:39.701] [warning][reporting] Generating a random key for xpack.reporting.encryptionKey. To prevent pending reports from failing on restart, please set xpack.reporting.encryptionKey in kibana.yml
  log   [21:22:39.708] [info][status][plugin:reporting@6.3.1] Status changed from uninitialized to yellow - Waiting for Elasticsearch
  log   [21:22:39.884] [info][listening] Server running at http://0.0.0.0:5601
  log   [21:22:39.901] [info][status][plugin:elasticsearch@6.3.1] Status changed from yellow to green - Ready
  log   [21:22:39.906] [info][license][xpack] Imported license information from Elasticsearch for the [data] cluster: mode: basic | status: active
  log   [21:22:39.946] [info][status][plugin:xpack_main@6.3.1] Status changed from yellow to green - Ready
  log   [21:22:39.947] [info][status][plugin:searchprofiler@6.3.1] Status changed from yellow to green - Ready
  log   [21:22:39.948] [info][status][plugin:ml@6.3.1] Status changed from yellow to green - Ready
  log   [21:22:39.949] [info][status][plugin:tilemap@6.3.1] Status changed from yellow to green - Ready
  log   [21:22:39.950] [info][status][plugin:watcher@6.3.1] Status changed from yellow to green - Ready
  log   [21:22:39.951] [info][status][plugin:index_management@6.3.1] Status changed from yellow to green - Ready
  log   [21:22:39.954] [info][status][plugin:graph@6.3.1] Status changed from yellow to green - Ready
  log   [21:22:39.955] [info][status][plugin:security@6.3.1] Status changed from yellow to green - Ready
  log   [21:22:39.956] [info][status][plugin:grokdebugger@6.3.1] Status changed from yellow to green - Ready
  log   [21:22:39.959] [info][status][plugin:logstash@6.3.1] Status changed from yellow to green - Ready
  log   [21:22:39.960] [info][status][plugin:reporting@6.3.1] Status changed from yellow to green - Ready
  log   [21:22:39.977] [info][kibana-monitoring][monitoring-ui] Starting all Kibana monitoring collectors
  log   [21:22:39.988] [info][license][xpack] Imported license information from Elasticsearch for the [monitoring] cluster: mode: basic | status: active
5. Open your browser to 192.168.8.104:5601
5. Configure filebeat on apache
[root@Apache ~]# cd /usr/local/filebeat/
[root@Apache filebeat]# ls
data  fields.yml  filebeat  filebeat.reference.yml  filebeat.yml  kibana  LICENSE.txt  module  modules.d  NOTICE.txt  README.md
[root@Apache filebeat]# VIM filebeat.yml (modify only the following paragraphs)
#=========================== Filebeat inputs =============================
filebeat.inputs:
- type: log
  paths:
    - "/var/log/httpd/*" Note that I'm using the yum Installed apache
  fields:
    apache: true
  fields_under_root: true
#============================== Kibana =====================================

# Starting with Beats version 6.0.0, the dashboards are loaded via the Kibana API.
# This requires a Kibana endpoint configuration.
setup.kibana:

  # Kibana Host
  # Scheme and port can be left out and will be set to the default (http and 5601)
  # In case you specify and additional path, the scheme is required: http://localhost:5601/path
  # IPv6 addresses should always be defined as: https://[2001:db8::1]:5601
  host: "192.168.8.104:5601"
#----------------------------- Logstash output --------------------------------
output.logstash:
  # The Logstash hosts
 hosts: ["192.168.8.103:5044"]

  # Optional SSL. By default is off.
  # List of root certificates for HTTPS server verifications
  #ssl.certificate_authorities: ["/etc/pki/root/ca.pem"]

  # Certificate for SSL client authentication
  #ssl.certificate: "/etc/pki/client/cert.pem"

  # Client Certificate Key
  #ssl.key: "/etc/pki/client/cert.key"
[root@Apache filebeat]# ./filebeat -e -c filebeat.yml
First test access to apache, generate logs, and finish viewing the output in the front-end console on logstash
{
     "@timestamp" => 2018-07-22T21:37:06.606Z,
          "input" => {
        "type" => "log"
    },
           "tags" => [
        [0] "beats_input_codec_plain_applied",
        [1] "_geoip_lookup_failure"
    ],
        "request" => "/",
          "agent" => "\"curl/7.19.7 (x86_64-redhat-linux-gnu) libcurl/7.19.7 NSS/3.14.0.0 zlib/1.2.3 libidn/1.18 libssh2/1.4.2\"",
           "beat" => {
            "name" => "Logstash",
        "hostname" => "Logstash",
         "version" => "6.3.1"
    },
          "ident" => "-",
           "verb" => "GET",
         "apache" => true,
    "httpversion" => "1.1",
           "host" => {
        "name" => "Logstash"
    },
     "prospector" => {
        "type" => "log"
    },
       "clientip" => "192.168.8.101",
         "source" => "/var/log/httpd/access_log",
       "referrer" => "\"-\"",
           "auth" => "-",
       "datetime" => 2018-07-22T21:37:05.000Z,
         "offset" => 25023,
      "timestamp" => "23/Jul/2018:05:37:05 +0800",
        "message" => "192.168.8.101 - - [23/Jul/2018:05:37:05 +0800] \"GET / HTTP/1.1\" 403 4961 \"-\" \"curl/7.19.7 (x86_64-redhat-linux-gnu) libcurl/7.19.7 NSS/3.14.0.0 zlib/1.2.3 libidn/1.18 libssh2/1.4.2\"",
       "response" => "403",
       "@version" => "1",
          "bytes" => "4961",
          "geoip" => {}
}
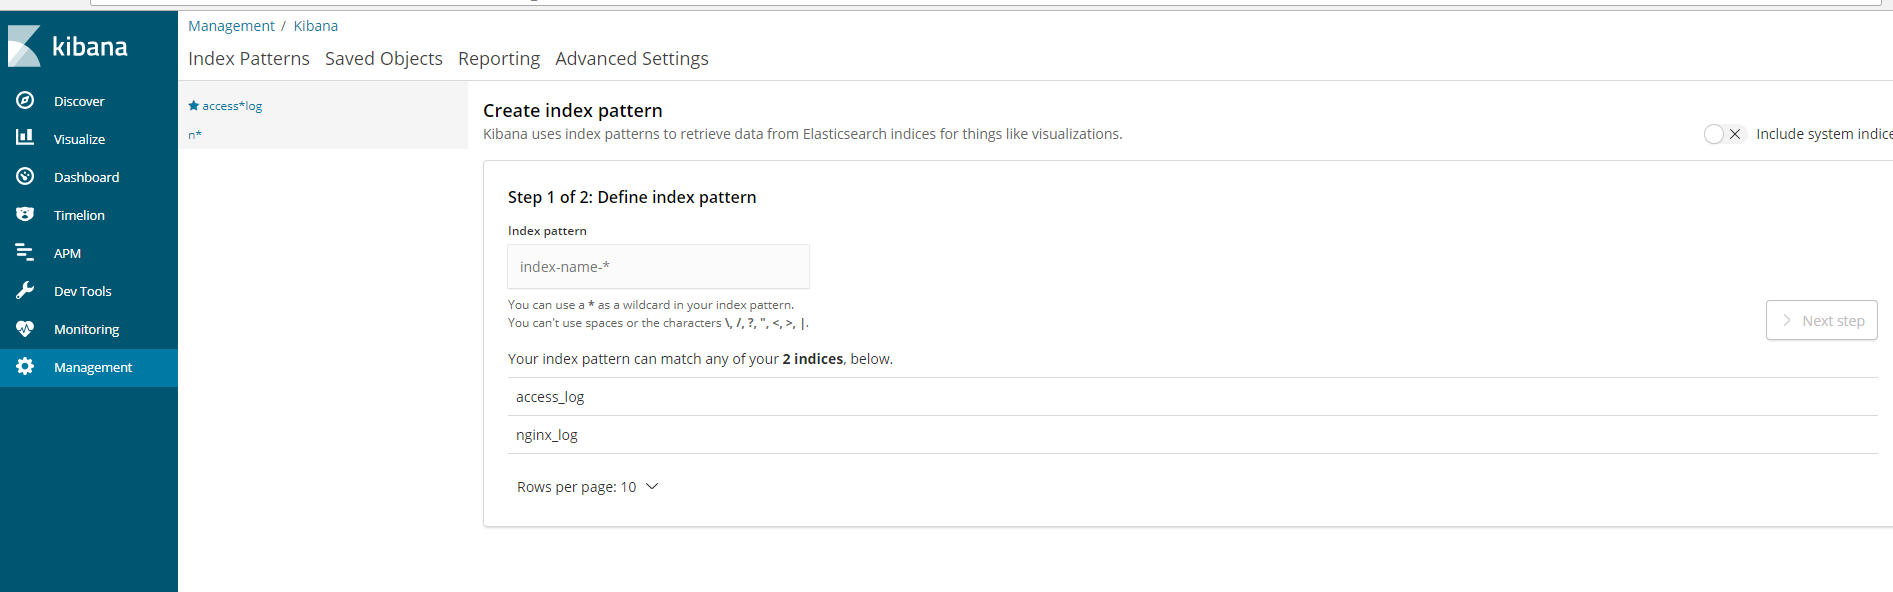
Finish creating index in kibana
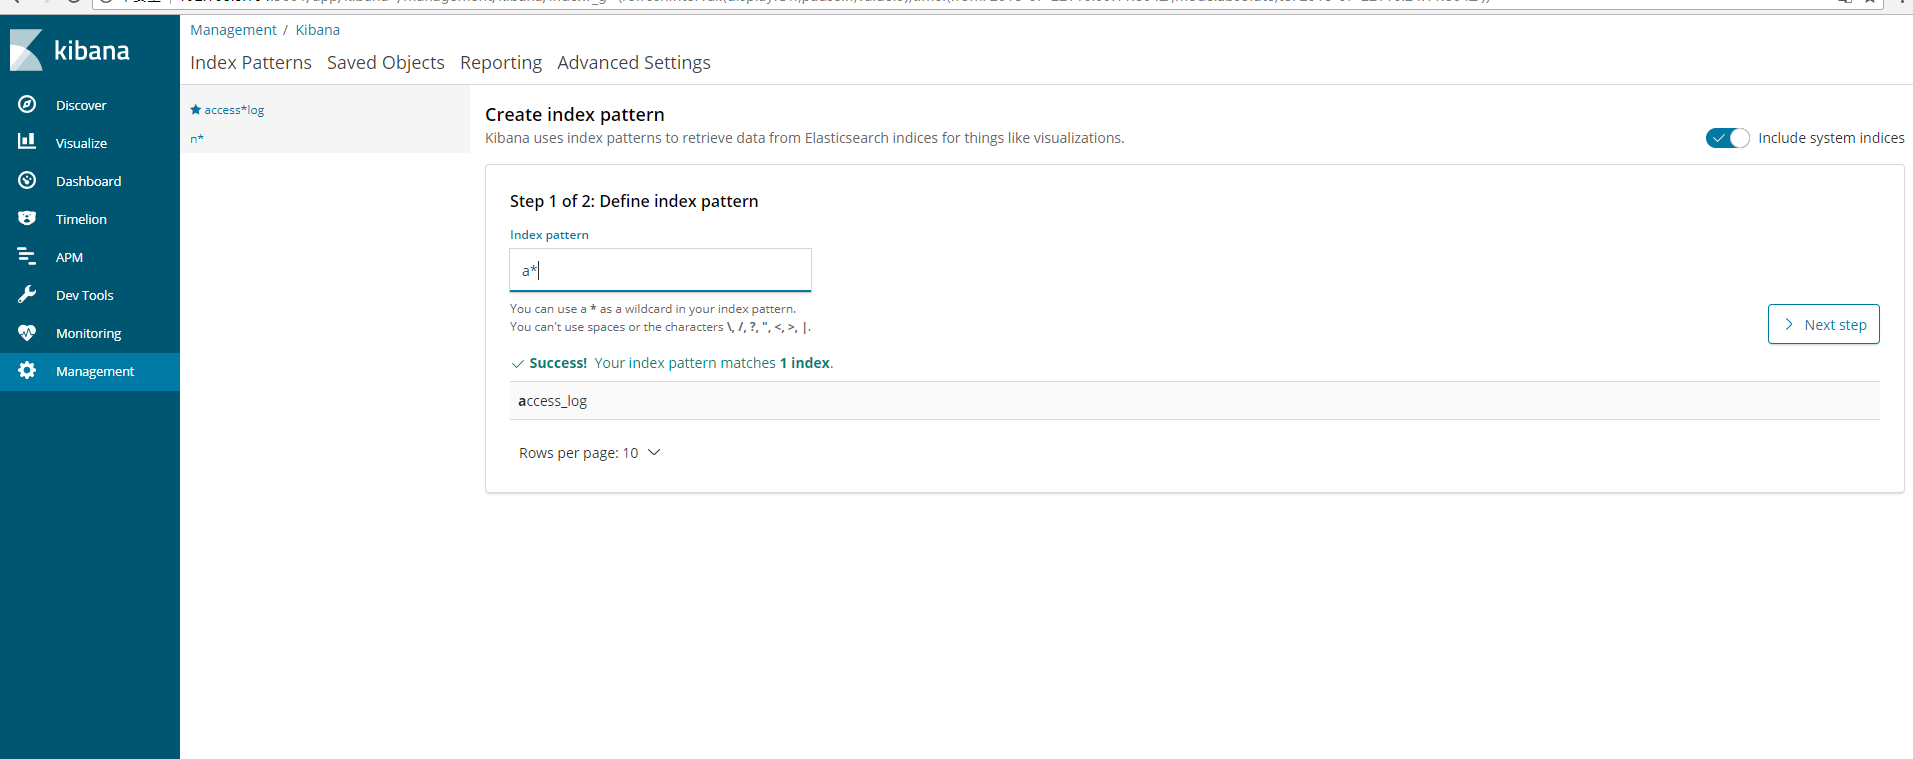
Note that when the statement below your input box becomes Success!Your index pattern matches 1 index.You can click Next
When you create an index, you will be asked to select a filter here that does not apply to the filter, otherwise you will not see the data.
Finish Click on Menu Bar
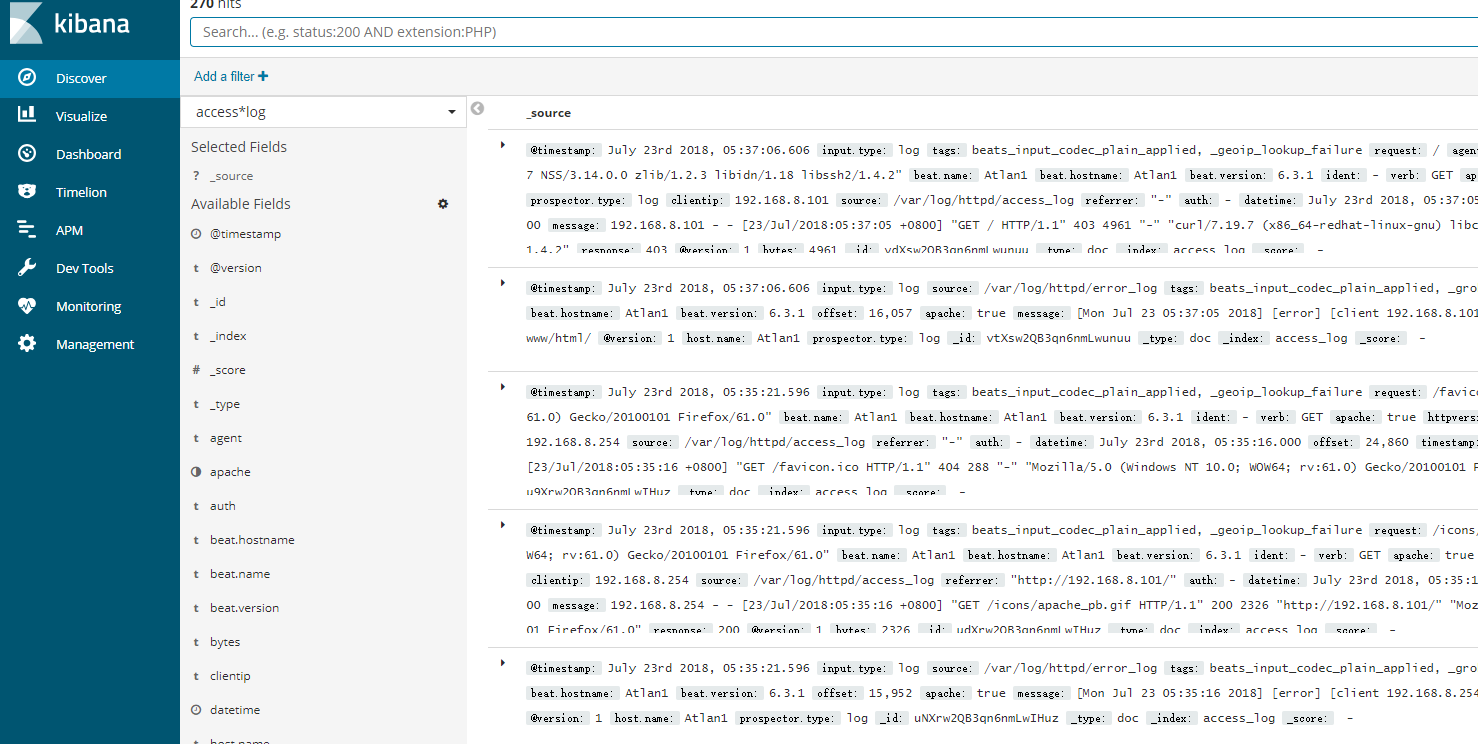
Visible data
ELK is now set up