Author: v Shen
Introduction: Cloud Log Service (CLS) is a one-stop service provided by Tencent cloud Log data The solution platform provides a number of services from log collection, log storage to log retrieval, chart analysis, monitoring alarm, log delivery and so on to help users solve business problems through logs Operation and maintenance , service monitoring, log audit and other scenario problems.
CDN is a very important Internet infrastructure. Users can quickly access various pictures, videos and other resources in the network through CDN. During the access process, CDN will generate a large amount of log data. Through the analysis of CDN access logs, a large amount of useful information can be mined for CDN quality and performance analysis, error diagnosis, client distribution and user behavior analysis.
Precondition: the CDN log is collected to the CLS side. See Operation details.
What is CDN?
CDN Content Delivery Network (CDN) is a new network architecture added to the existing Internet, which is composed of high-performance acceleration nodes all over the world. These high-performance service nodes will store business content according to a certain caching policy. When a user sends a request to a business content, the request will be dispatched to the service node closest to the user, and the service node will respond quickly directly, effectively reducing the user access delay and improving the availability.
Traditional CDN log analysis
At present, CDN service providers usually provide basic monitoring indicators in real time, such as request times, broadband and other information. However, in many specific analysis scenarios, these default real-time indicators may not meet the customized analysis needs of users. Therefore, users usually further download the original CDN logs for offline in-depth analysis and mining.
In the scenario of strong interactive analysis such as real-time problem location and rapid verification, it is not surprising that users build off-line analysis clusters by themselves, which not only requires a lot of operation and maintenance development costs and labor costs, but also the real-time data generation cannot be guaranteed, with a delay of more than half an hour; In the analysis scenarios such as alarm and troubleshooting of CDN log, the flexibility is not good, and it is unable to quickly respond to the needs of real-time interactive query.
CDN to CLS scheme
Tencent cloud CDN is connected with CLS log service. Users can deliver CDN data to CLS log service in real time, and further use the retrieval and SQL analysis capabilities of CLS log service to meet users' personalized real-time log analysis needs in different scenarios:
- Log one click delivery
- Ten billion log, second analysis
- Dashboard real-time log visualization
- One minute real-time alarm
CDN log introduction
CDN log field description
Field name | Original log type | Log service type | explain |
|---|---|---|---|
app_id | Integer | long | Tencent cloud account APPID |
client_ip | String | text | Client IP |
file_size | Integer | long | file size |
hit | String | text | Cache HIT / MISS. Both CDN edge node hits and parent node hits are marked as HIT |
host | String | text | domain name |
http_code | Integer | long | HTTP status code |
isp | String | text | Operator |
method | String | text | HTTP Method |
param | String | text | Parameters carried by URL |
proto | String | text | HTTP protocol ID |
prov | String | text | Operator Province |
referer | String | text | Referer information, HTTP source address |
request_range | String | text | Range parameter, request range |
request_time | Integer | long | Response time (MS) refers to the time taken by the node to respond to all packets after receiving the request and then to the client |
request_port | String | long | The port on which the client establishes a connection with the CDN node; otherwise- |
rsp_size | Integer | long | Number of bytes returned |
time | Integer | long | Request time, UNIX timestamp, in seconds. |
ua | String | text | User agent information |
url | String | text | Request path |
uuid | String | text | Unique identification of the request |
version | Integer | long | CDN live log version |
1. CDN quality monitoring
Scenario 1: monitor CDN access delay higher than a certain threshold alarm
It is more accurate to use the percentage in mathematical statistics (e.g. 99% maximum delay) as the alarm trigger condition. Using the average value and individual value to trigger the alarm will cause some individual request delays to be averaged, which can not reflect the real situation. For example, use the following query analysis statement to calculate the average delay size of each minute in a day window (1440 minutes), the delay size of 50% quantile, and the delay size of 90% quantile.
* | select avg(request_time) as l, approx_percentile(request_time, 0.5) as p50, approx_percentile(request_time, 0.99) as p99, time_series(__TIMESTAMP__, '5m', '%Y-%m-%d %H:%i:%s', '0') as time group by time order by time desc limit 1440
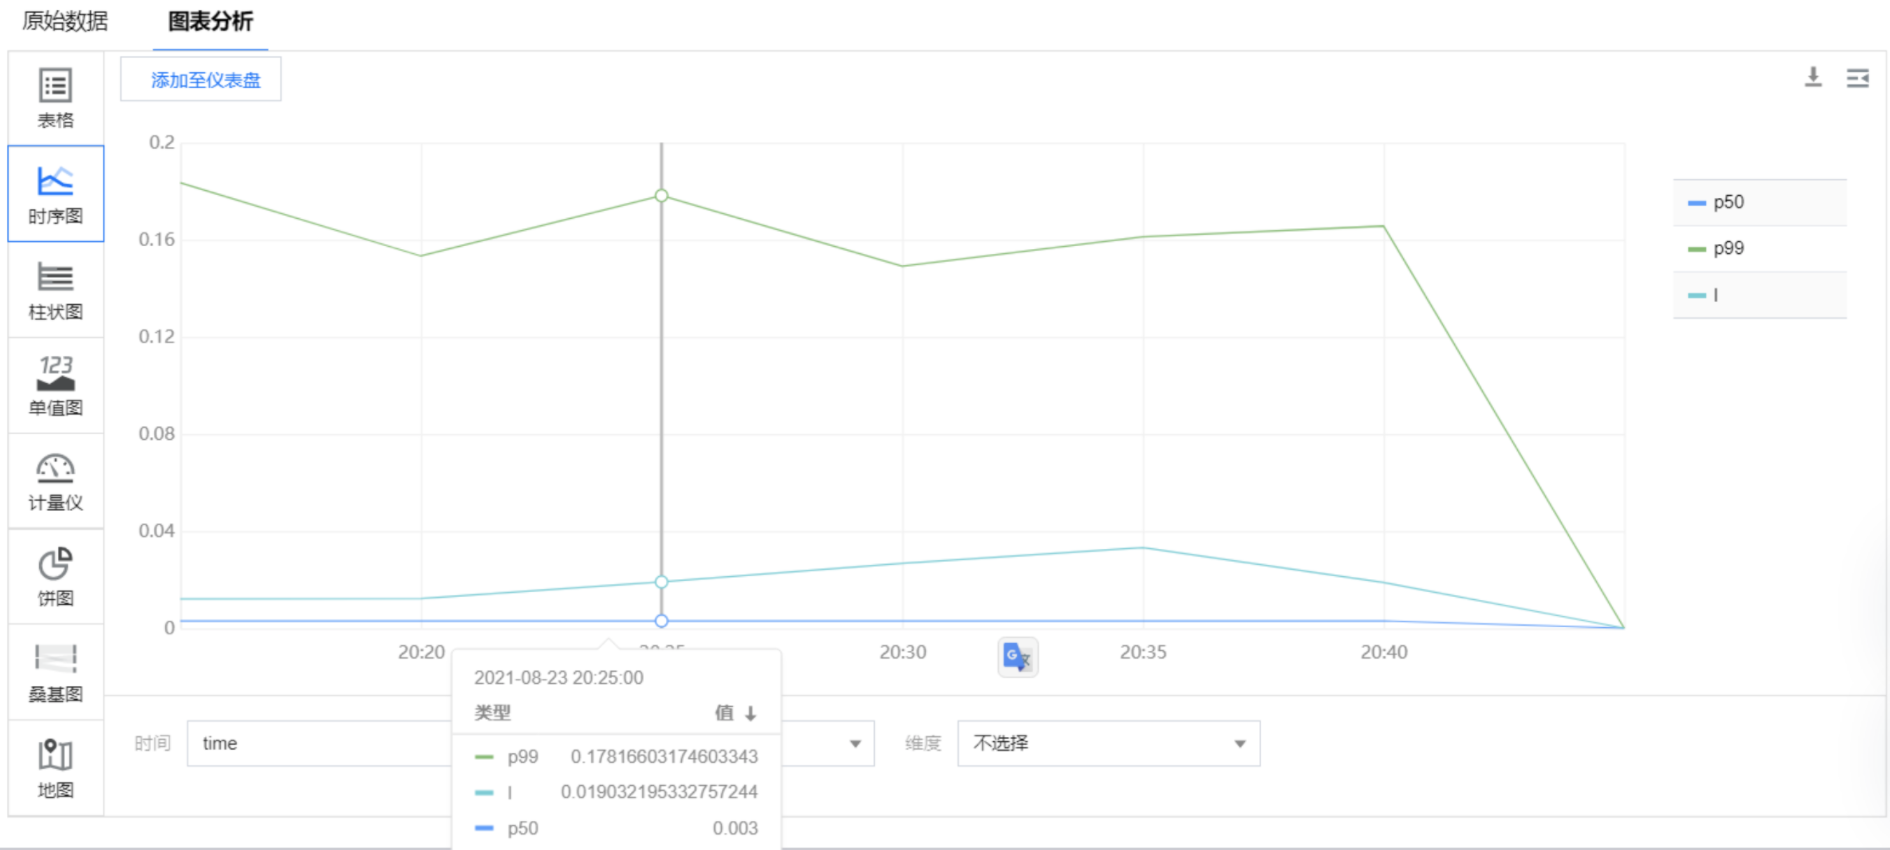
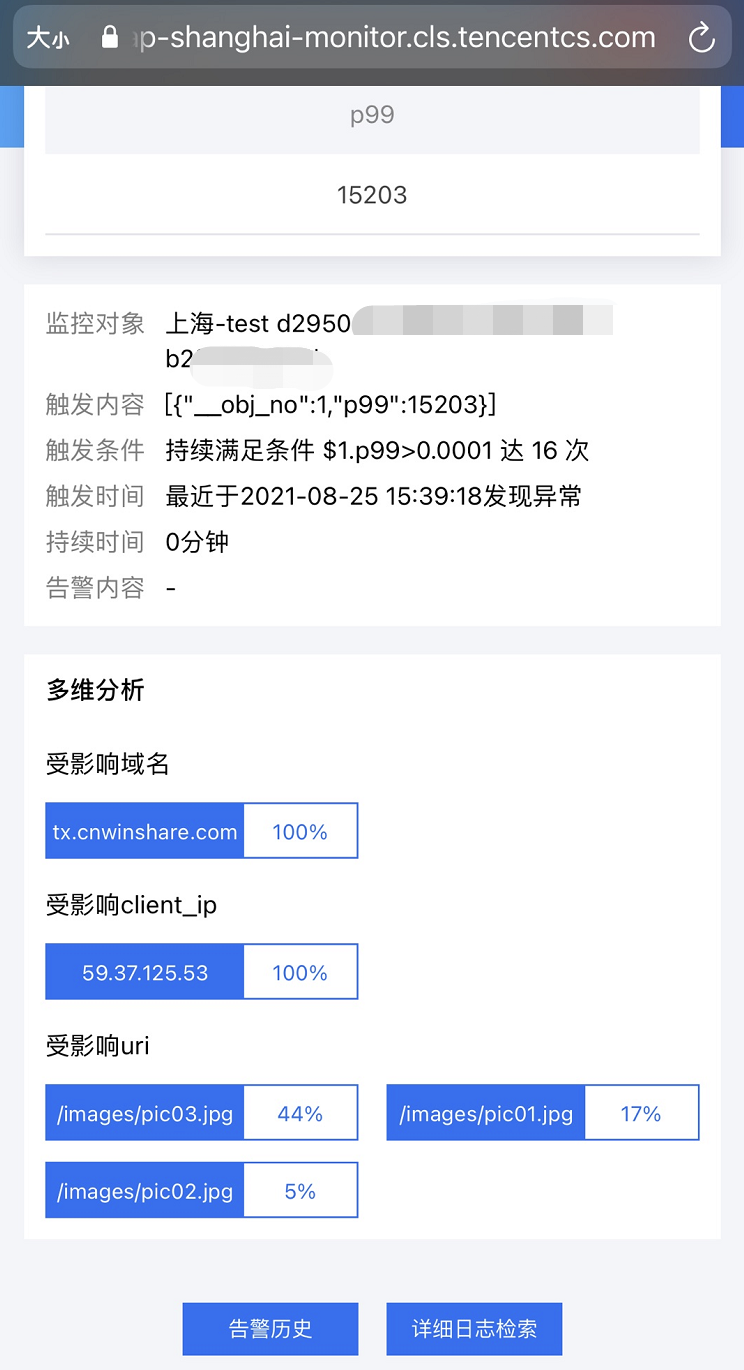
An alarm is given for 99% of the time delay greater than 100ms, and the affected domain name, url and client are displayed in the alarm information_ IP in order to quickly determine the error situation. The alarm settings are as follows:
* | select approx_percentile(request_time, 0.99) as p99
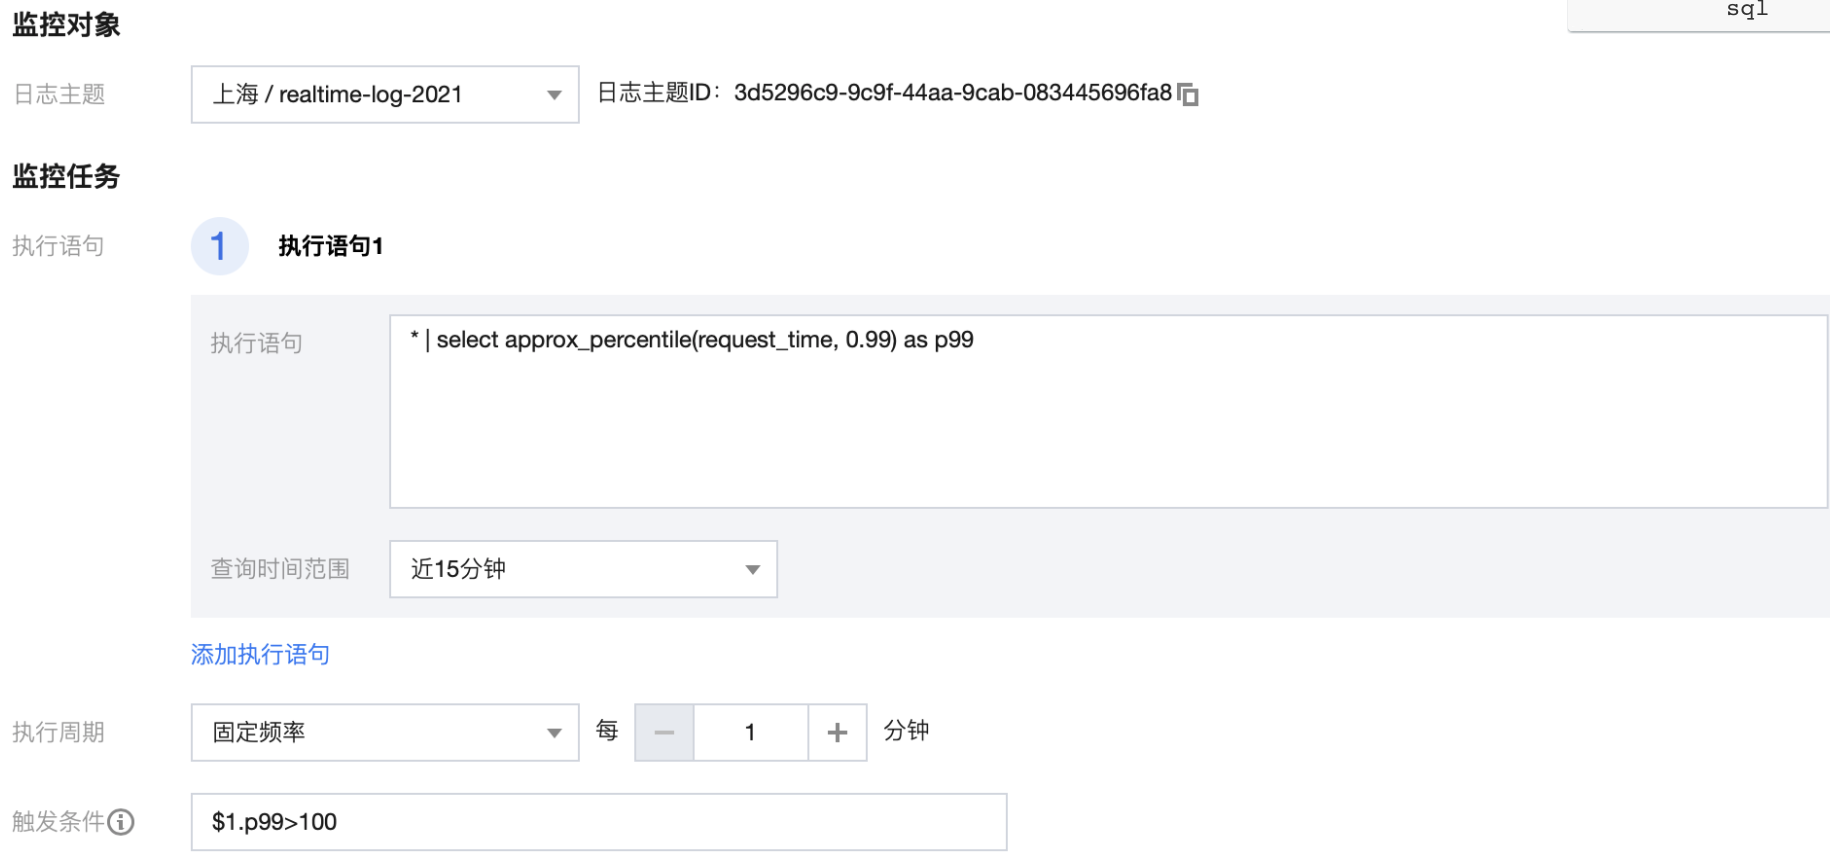
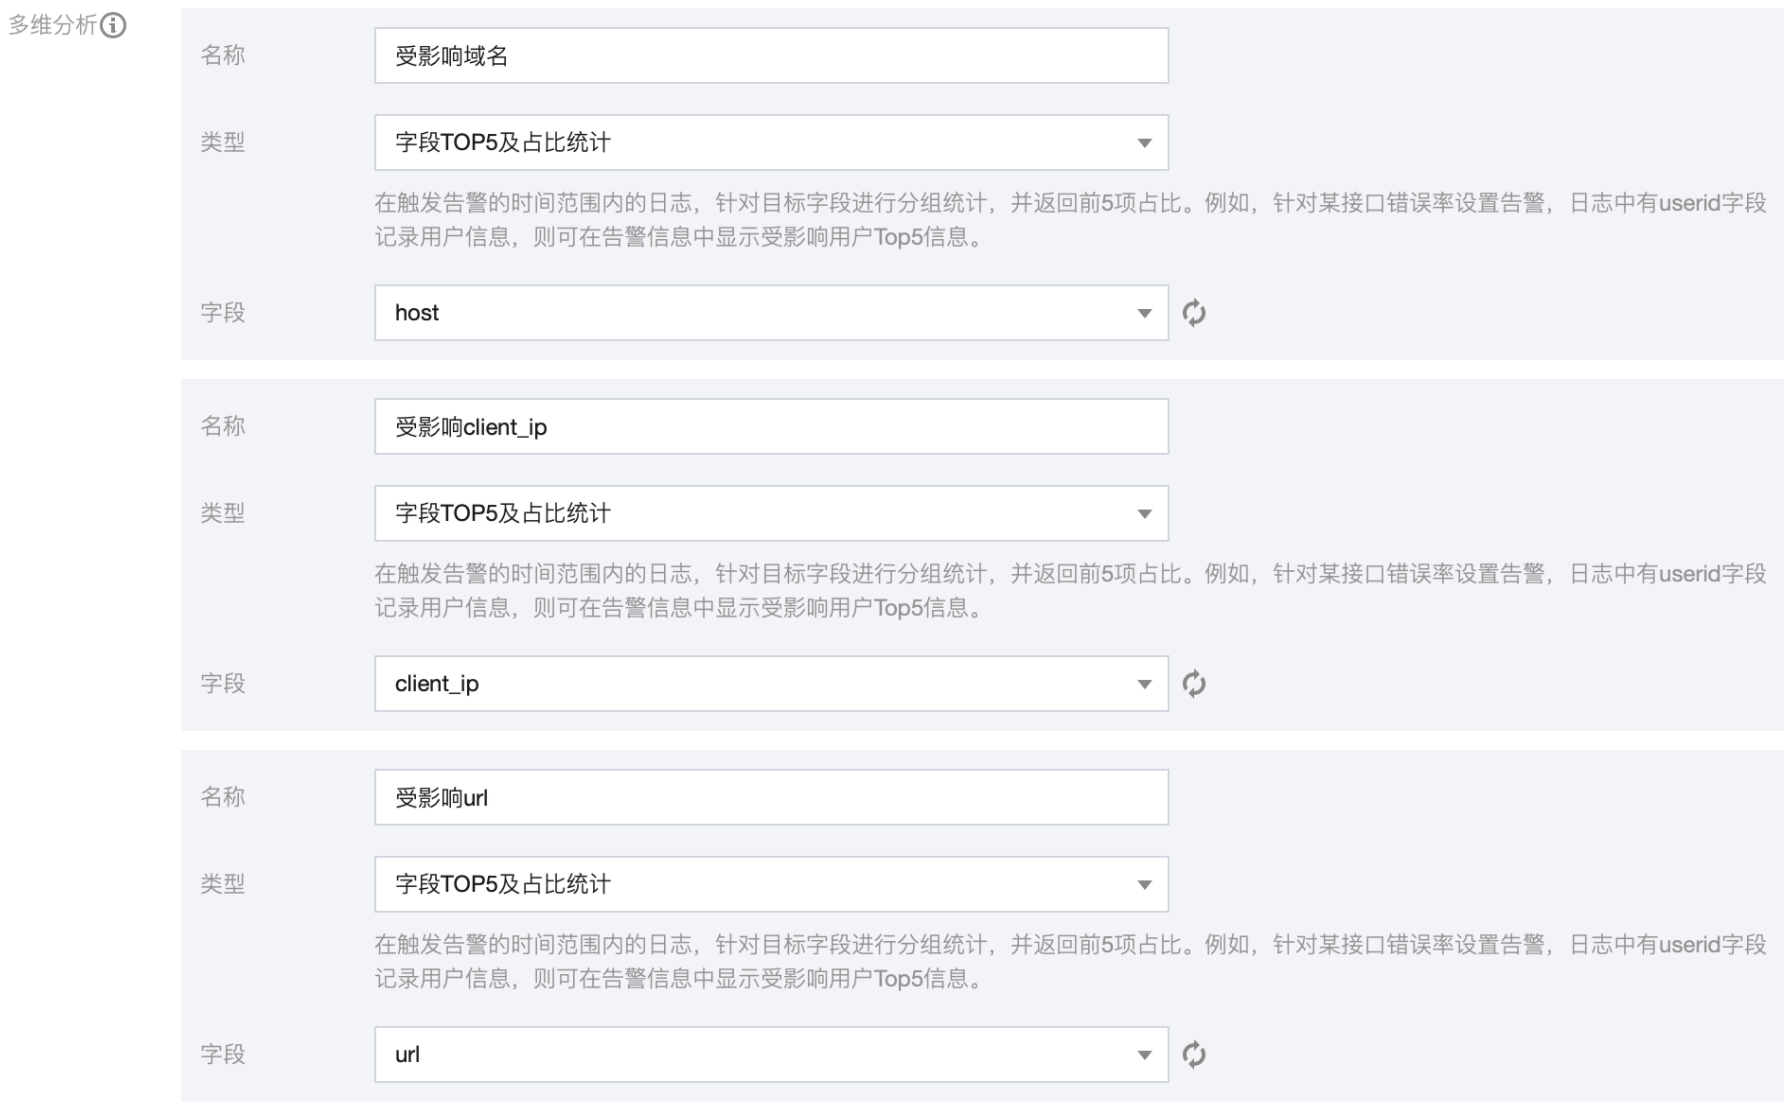
By configuring multi-dimensional analysis, the affected domain name, client ip and url are displayed in the alarm information to help developers quickly locate problems.
Once the alarm is triggered, key information can be obtained at the first time through wechat, enterprise wechat and SMS.
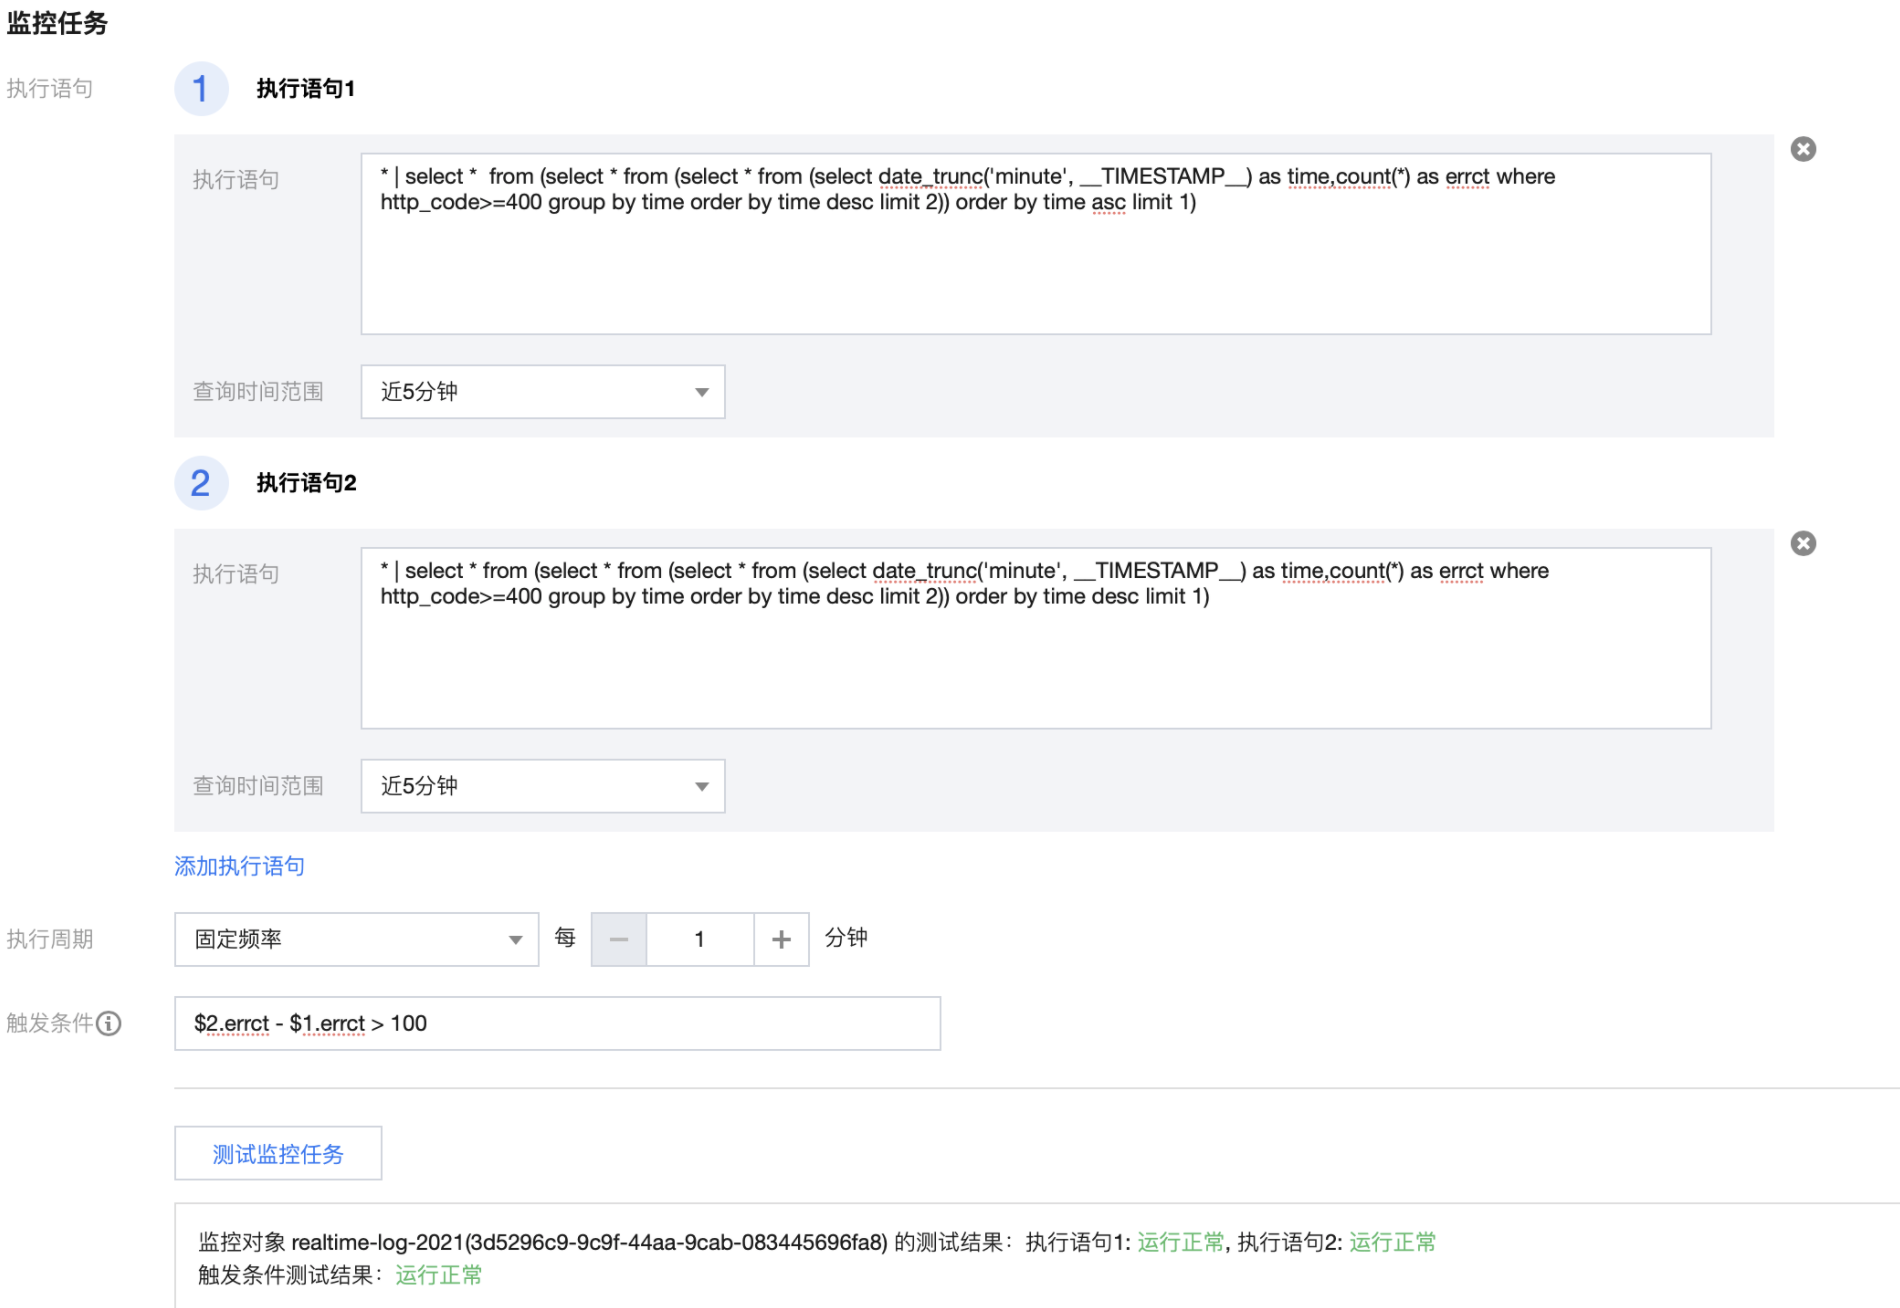
Scenario 2: resource access error surge alarm. When the year-on-year increase exceeds a certain threshold, the alarm notifies the user
When the number of page access errors increases sharply, it may indicate that the CDN back-end server fails or the request is overloaded. We can monitor the year-on-year increase in the number of request errors within a certain time range (eg. one minute) by setting an alarm. When the year-on-year increase exceeds a certain threshold, the alarm will notify the user.
Number of errors in the last minute
* | select * from (select * from (select * from (select date_trunc('minute', __TIMESTAMP__) as time,count(*) as errct where http_code>=400 group by time order by time desc limit 2)) order by time desc limit 1)Number of errors in the last minute
* | select * from (select * from (select * from (select date_trunc('minute', __TIMESTAMP__) as time,count(*) as errct where http_code>=400 group by time order by time desc limit 2)) order by time asc limit 1The trigger condition of alarm strategy configuration is [number of errors in the last minute] - [number of errors in the last minute] > the specified threshold
$2.errct-$1.errct >100
2. CDN quality and performance analysis
The logs provided by CDN contain rich contents. We can make comprehensive statistics and Analysis on the overall quality and performance of CDN from multiple dimensions:
- Health degree
- cache hit rate
- Average download speed
- Download times, download traffic and speed of operators
- Request delay response
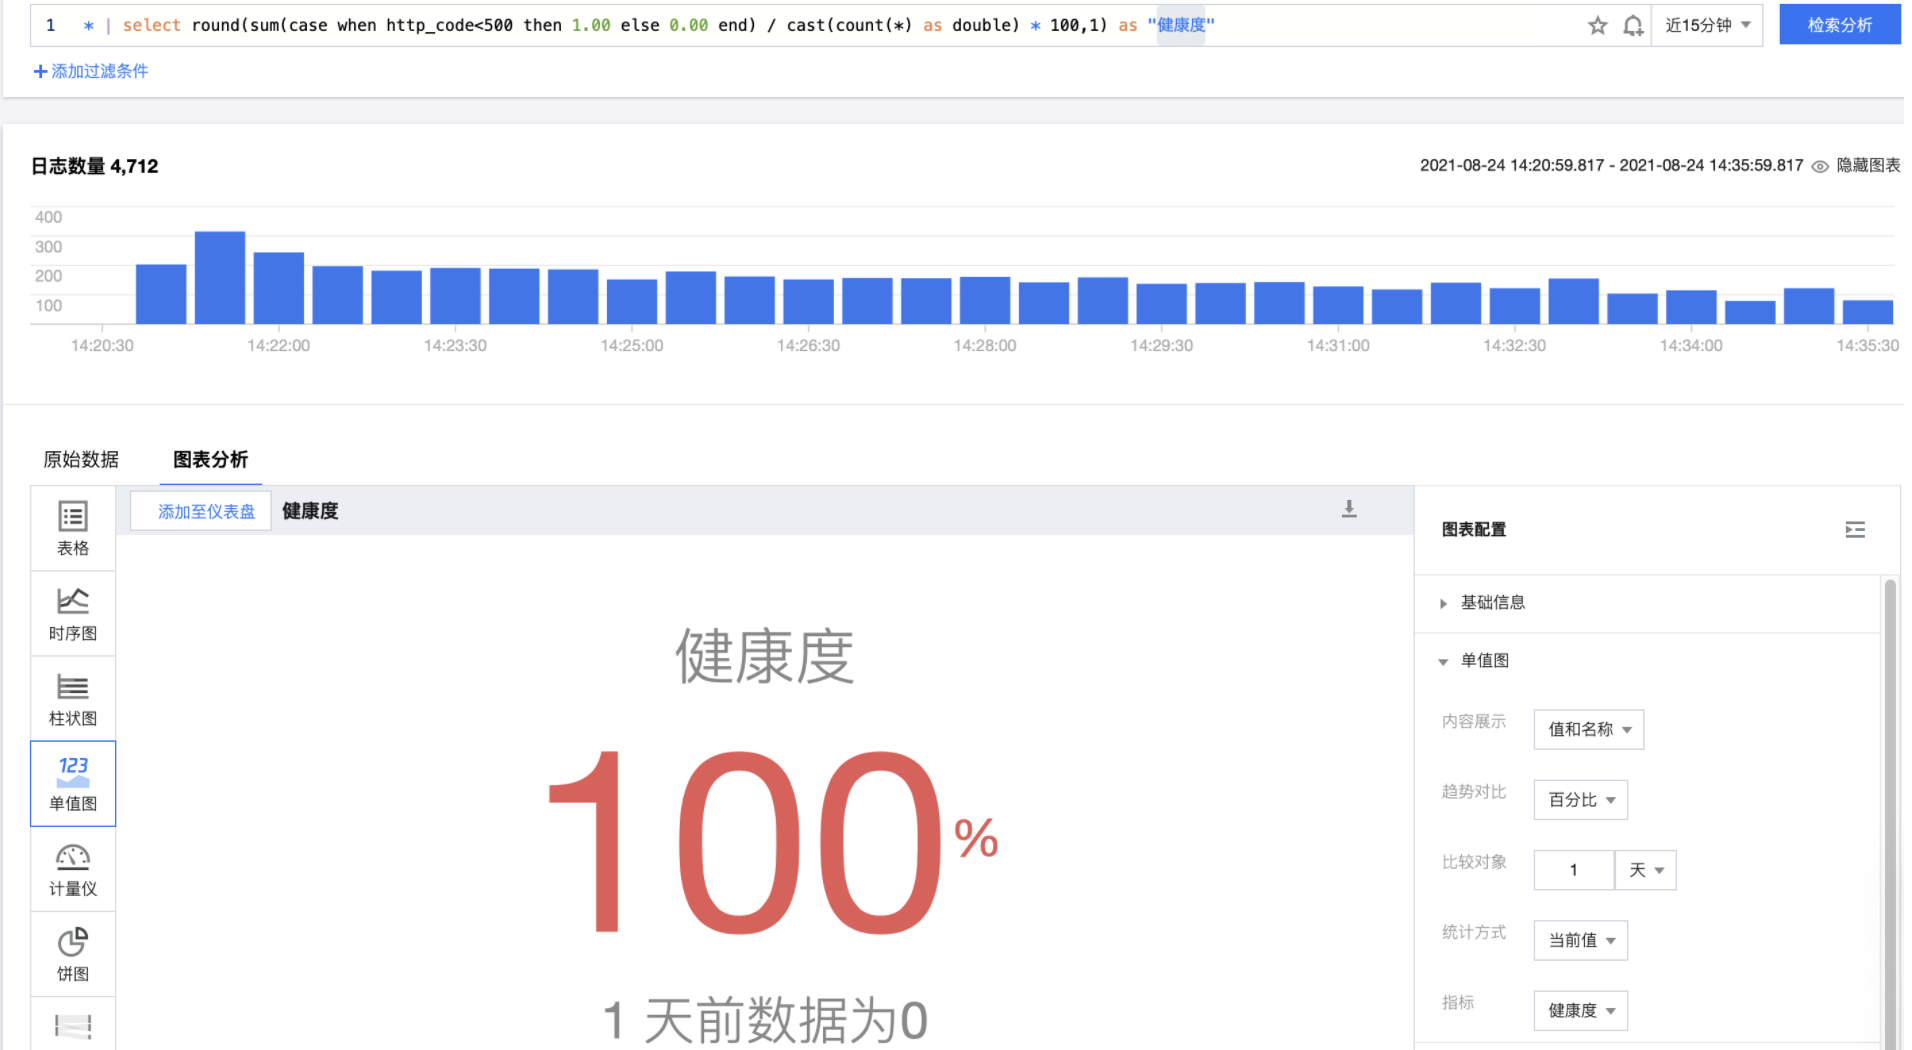
Health degree
Statistics http_ The percentage of requests with code less than 500 in all requests.
* | select round(sum(case when http_code<500 then 1.00 else 0.00 end) / cast(count(*) as double) * 100,1) as "Health degree"
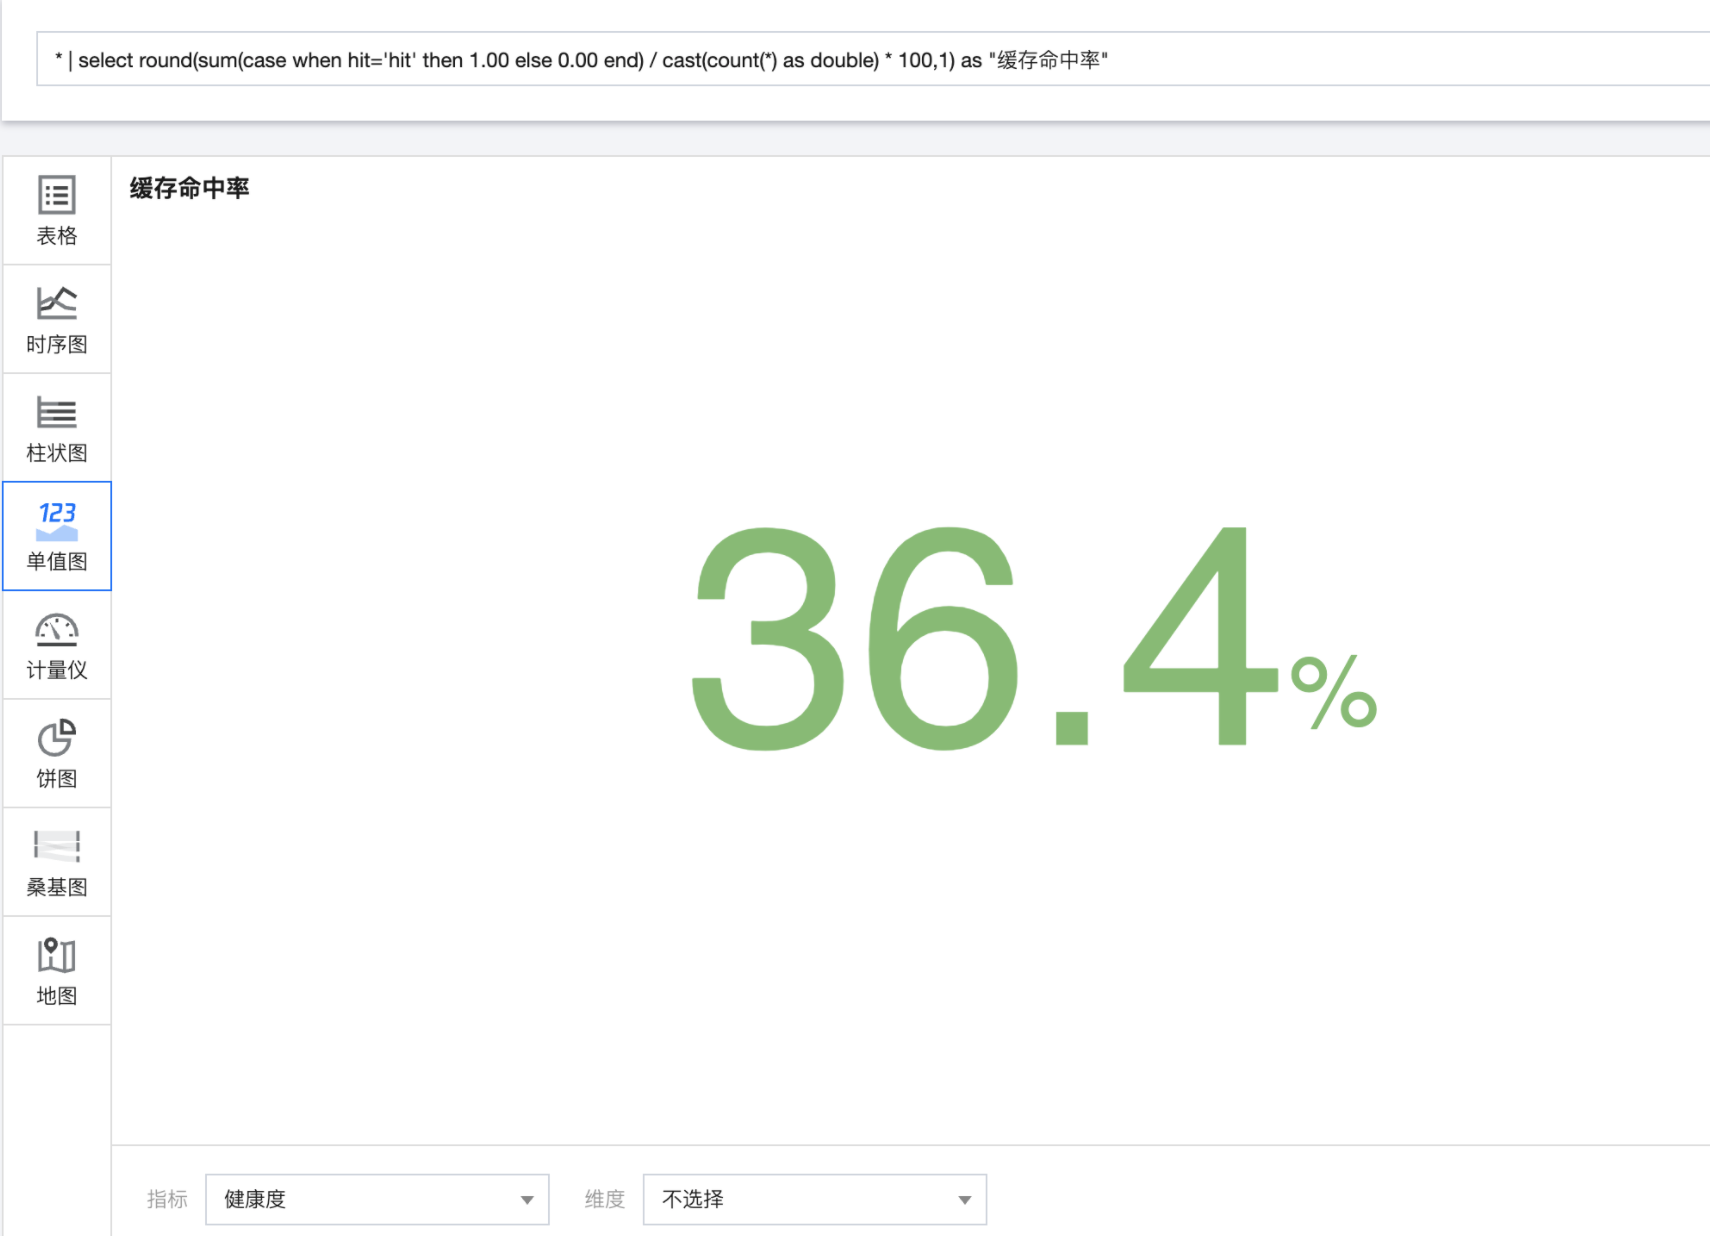
cache hit rate
Statistics return_ In requests with code less than 400, hit is the percentage of "hit" requests.
http_code<400 | select round(sum(case when hit='hit' then 1.00 else 0.00 end) / cast(count(*) as double) * 100,1) as "cache hit rate "
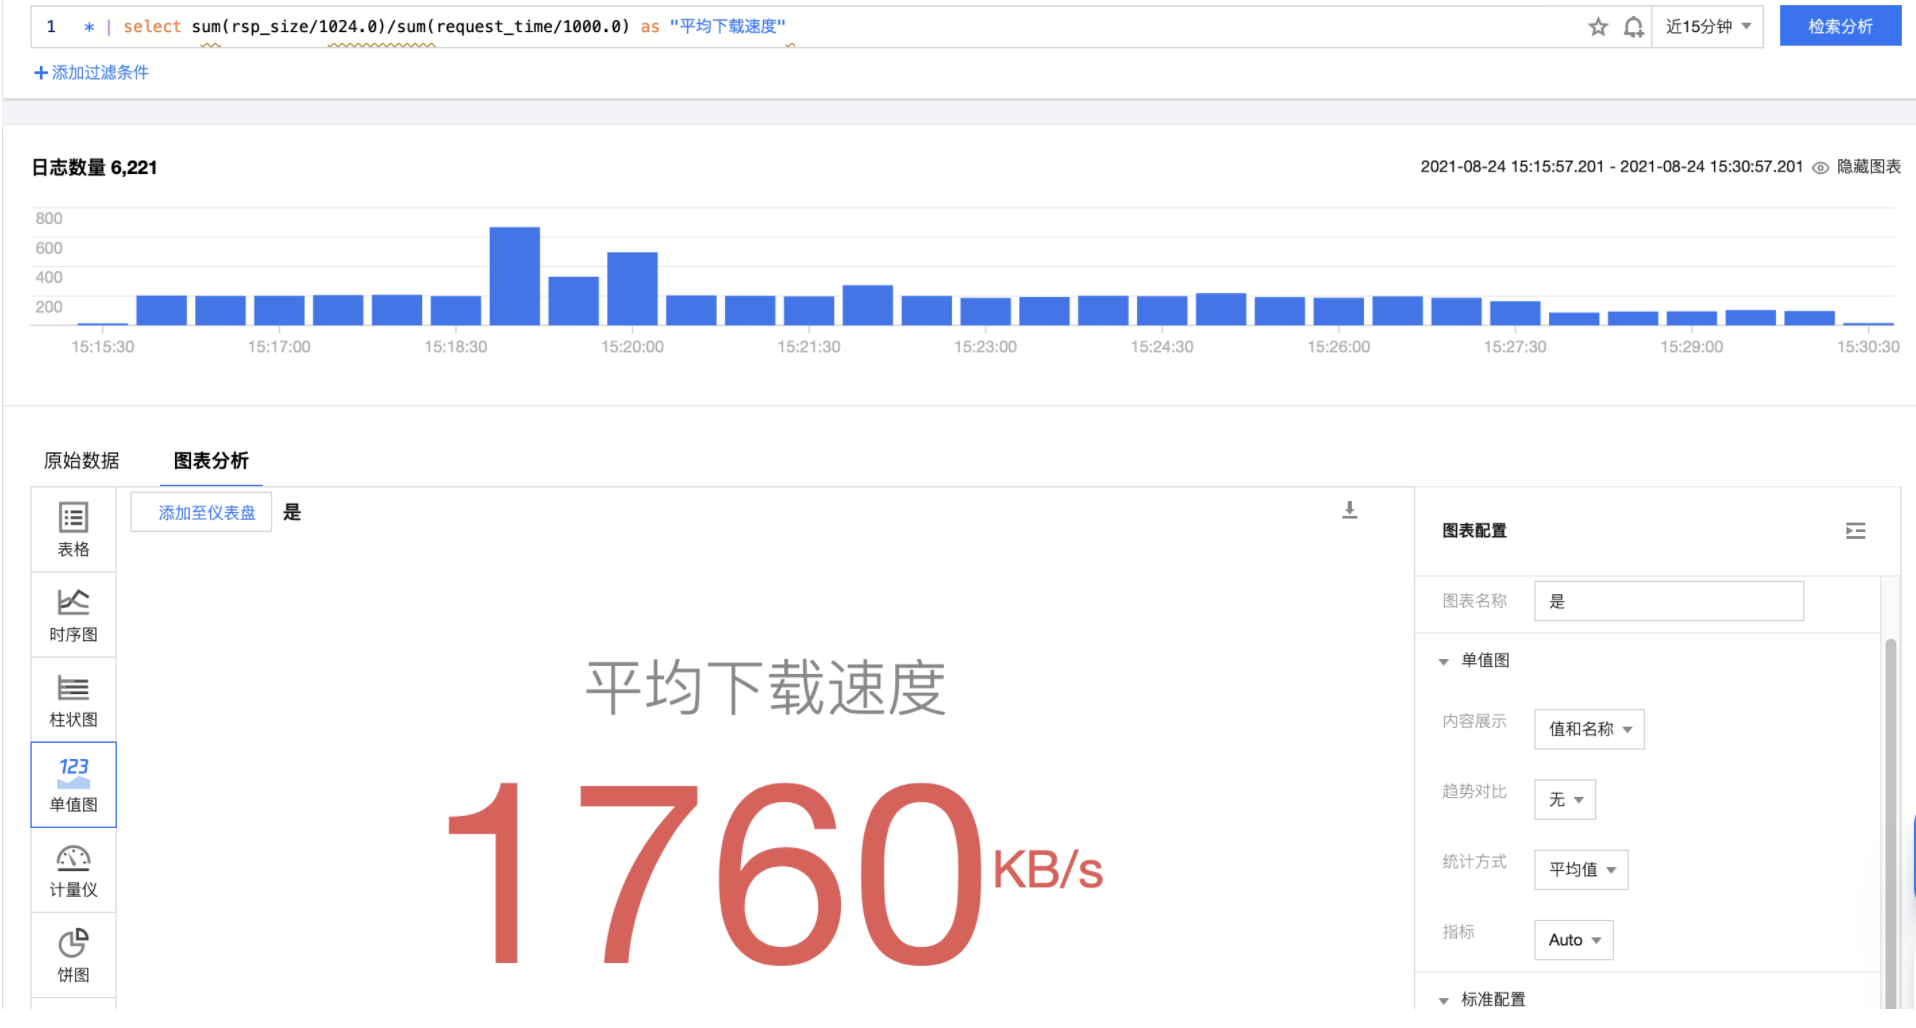
Average download speed
The average download speed is obtained by dividing the overall download volume by the overall time-consuming over a period of time.
* | select sum(rsp_size/1024.0) / sum(request_time/1000.0) as "Average download speed(kb/s)"
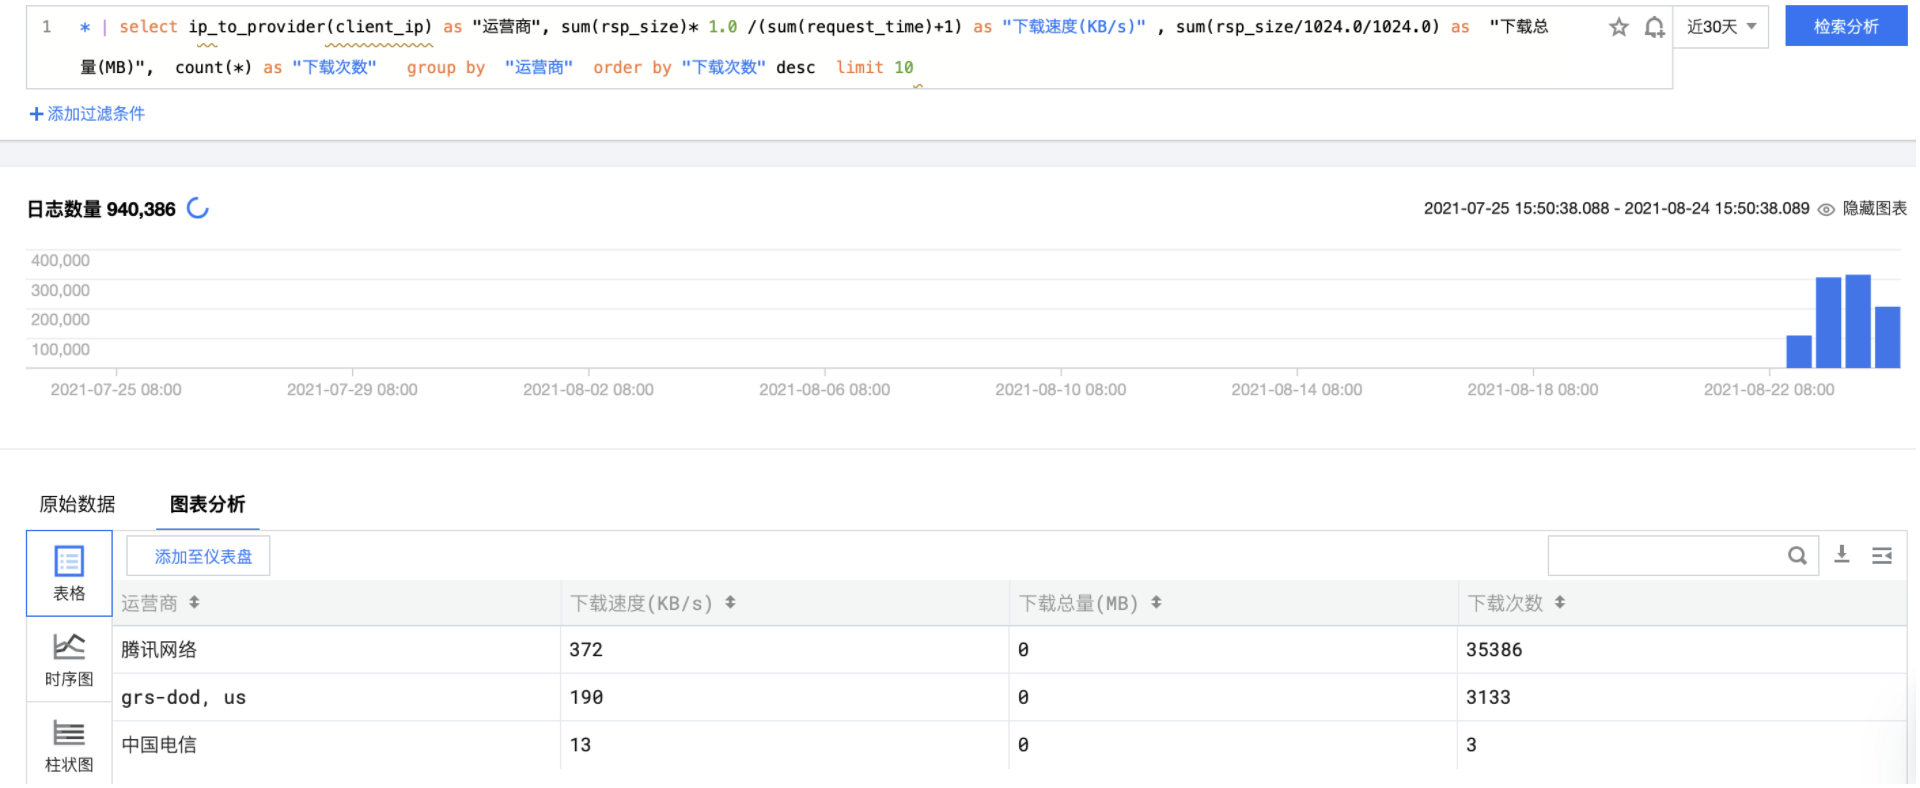
Download times, download traffic and speed of operators
The principle is the same as above, using ip_to_provider function, the client_ip is transformed into the corresponding operator.
* | select ip_to_provider(client_ip) as isp , sum(rsp_size)* 1.0 /(sum(request_time)+1) as "Download speed(KB/s)" , sum(rsp_size/1024.0/1024.0) as "Total Downloads(MB)", count(*) as c group by isp order by c desc limit 10
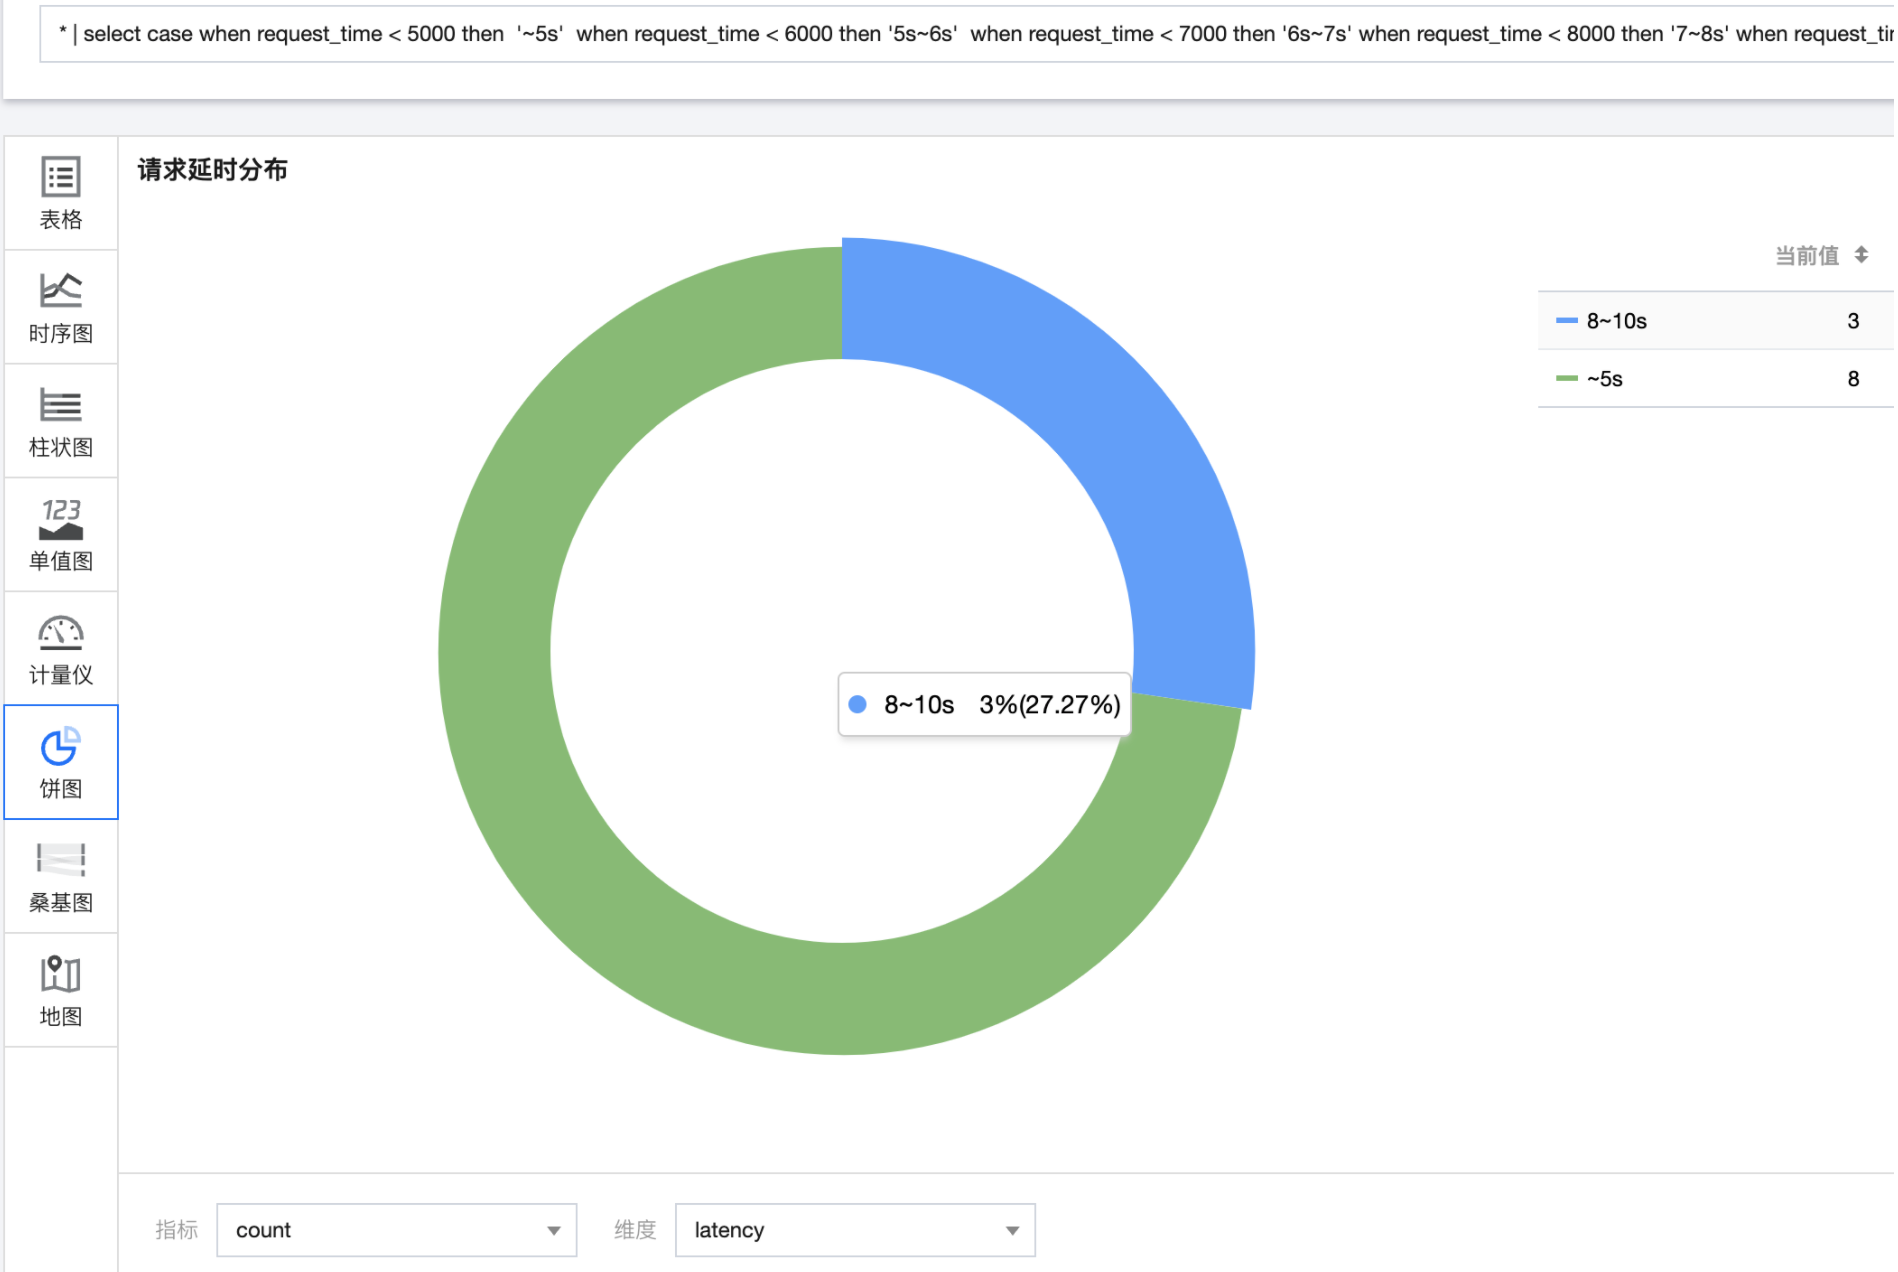
Request delay response
The access delay is counted according to each window, and the appropriate delay time window can be divided according to the actual situation of the application.
* | select case when request_time < 5000 then '~5s' when request_time < 6000 then '5s~6s' when request_time < 7000 then '6s~7s' when request_time < 8000 then '7~8s' when request_time < 10000 then '8~10s' when request_time < 15000 then '10~15s' else '15s~' end as latency , count(*) as count group by latency
3. CDN error diagnosis
demand
Access errors have always been an important part affecting the service experience. When errors occur, it is necessary to quickly locate the current QPS and proportion of errors, which domain names and URI s have the greatest impact, whether they are related to regions and operators, and whether they are caused by the new version released.
Solution
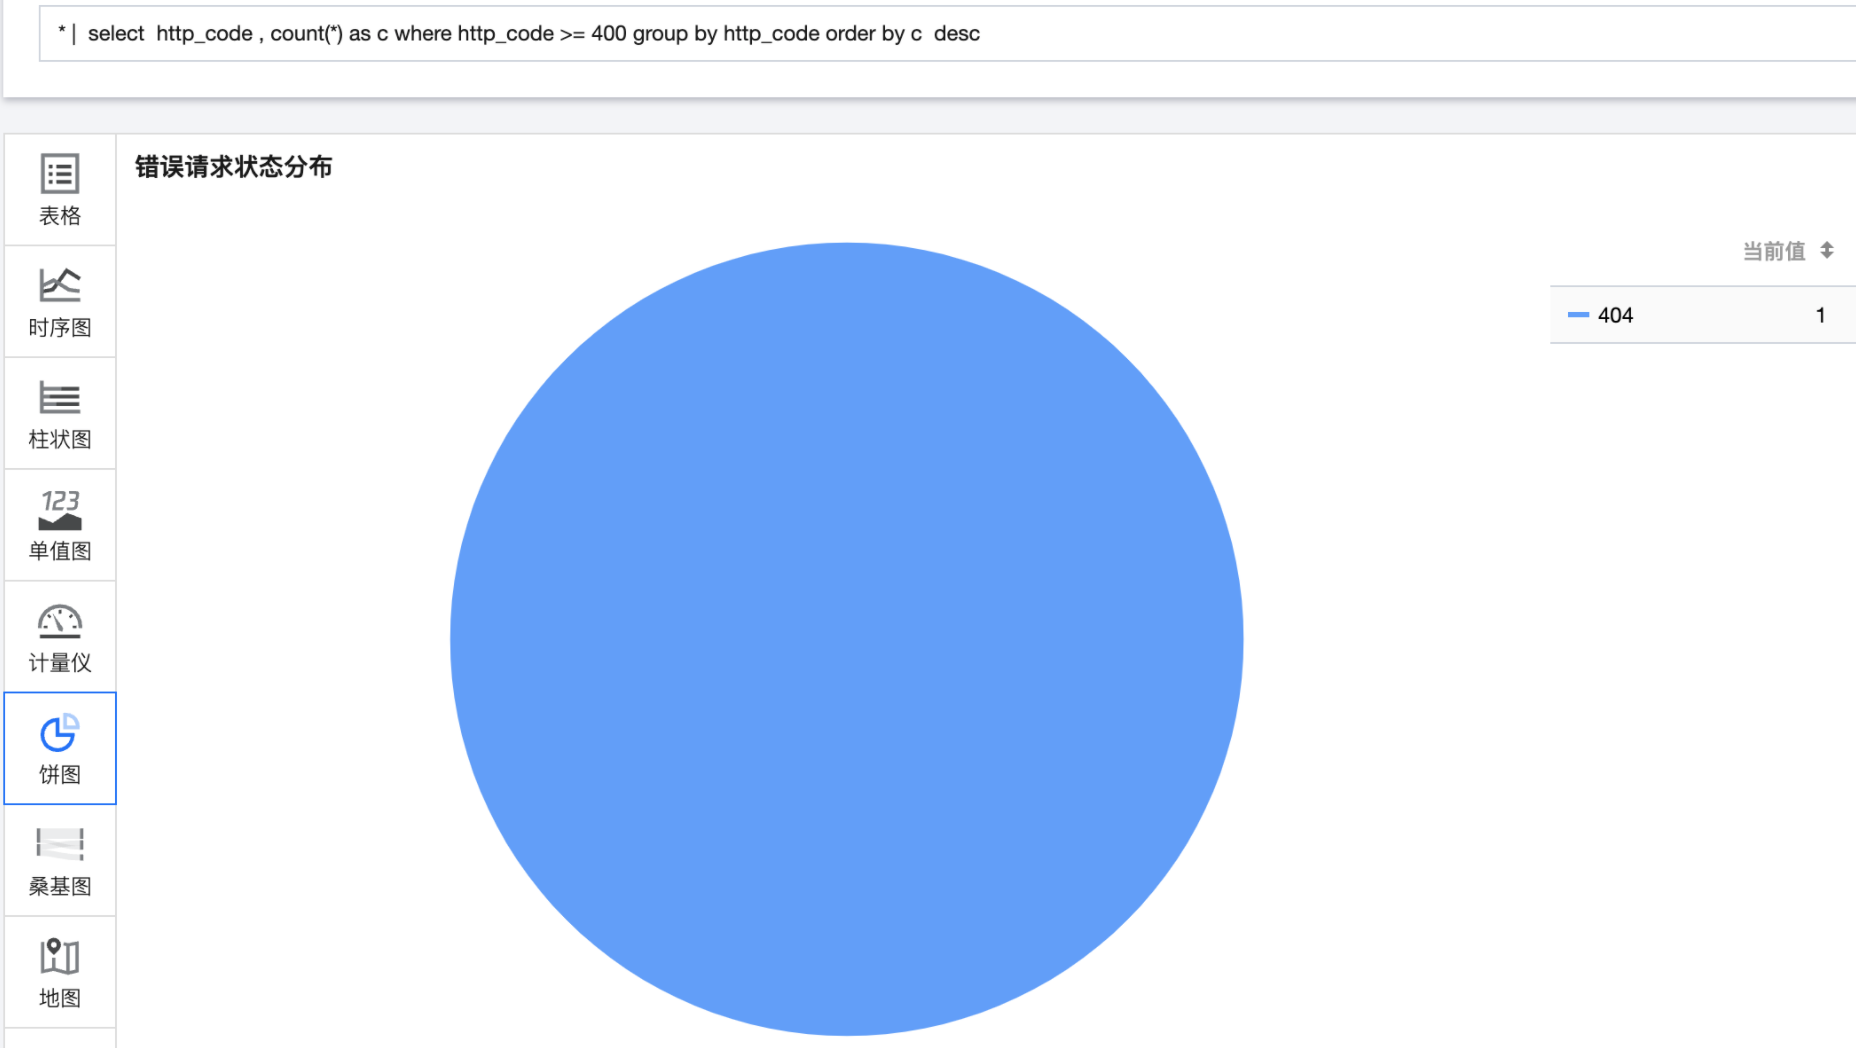
Check 4xx and 5xx error code distribution
* | select http_code , count(*) as c where http_code >= 400 group by http_code order by c desc
From the following error distribution diagram, the main errors are 404 errors, indicating that the accessed file or content does not exist. At this time, it is necessary to check whether the resources have been deleted or destroyed.
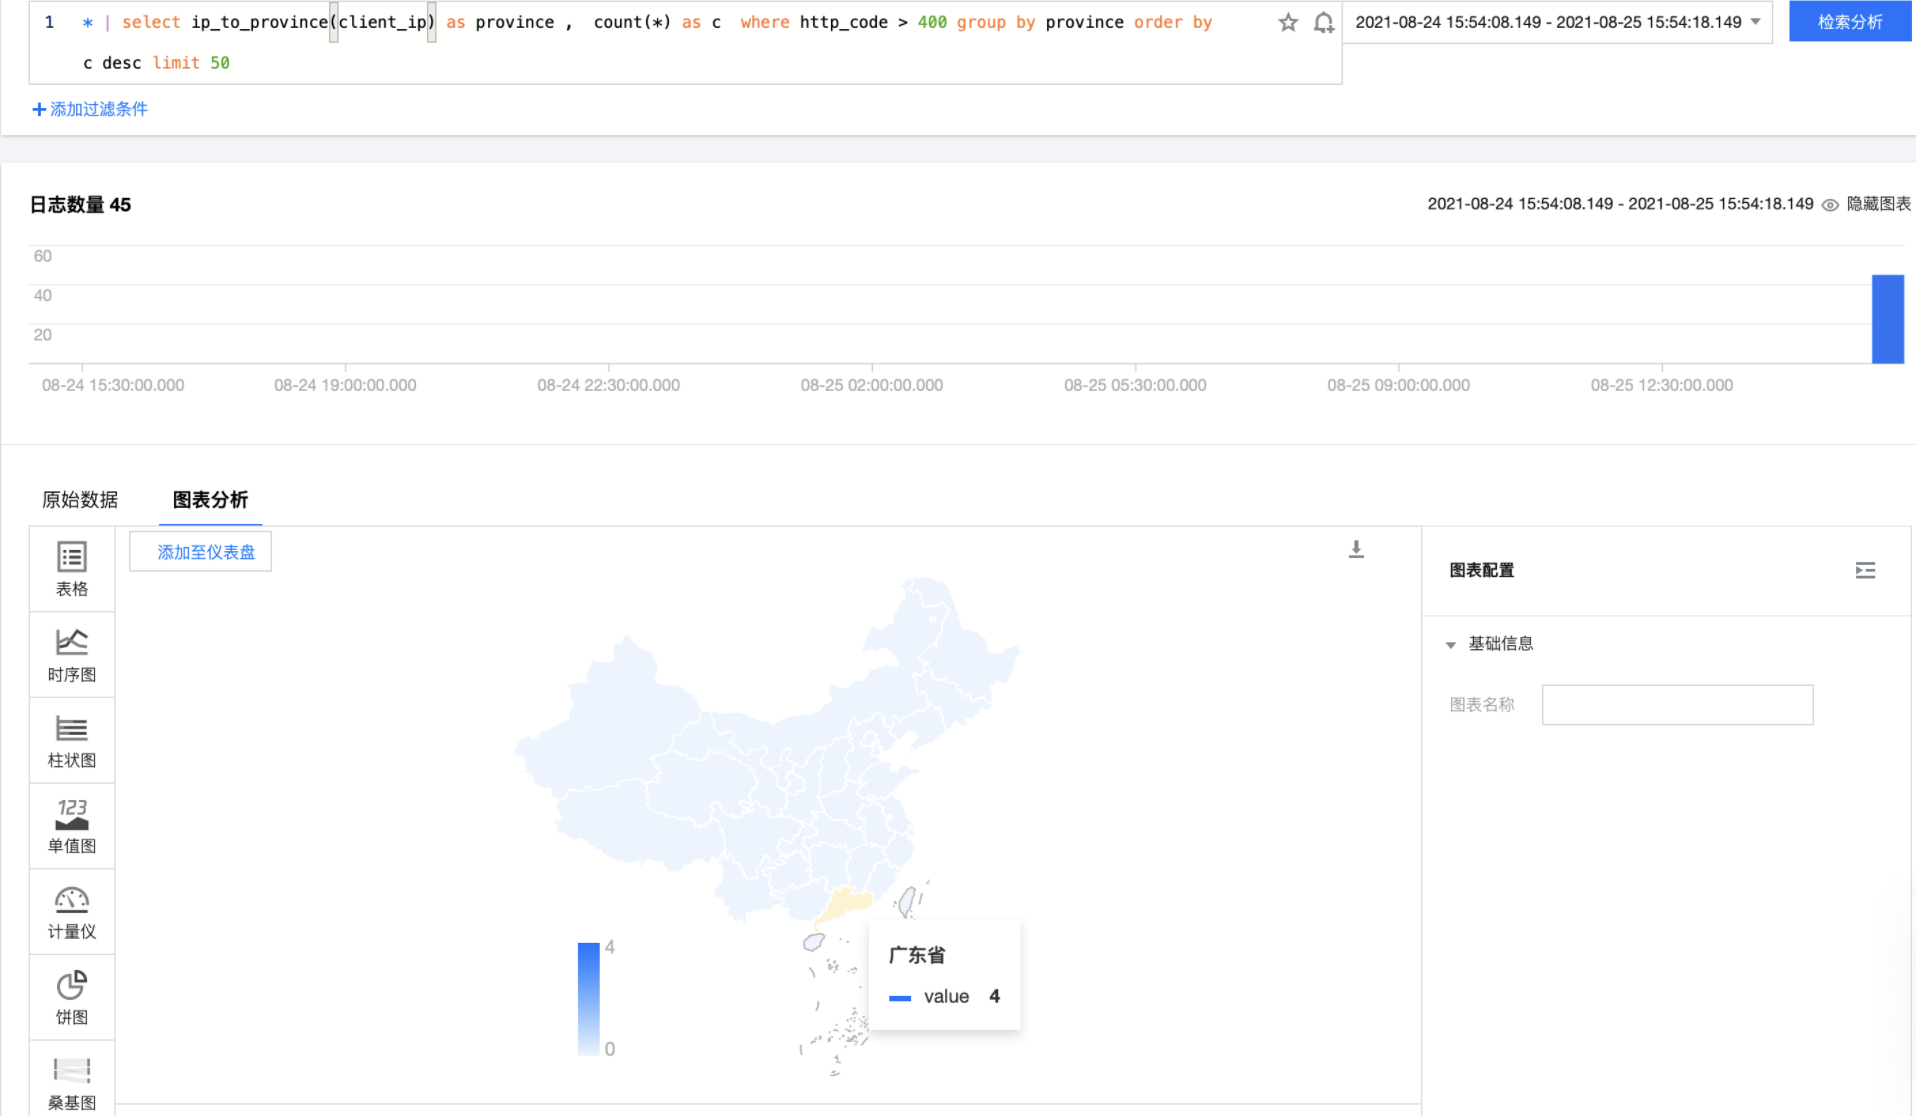
For http_ For requests with code > 400, we conduct multi-dimensional analysis, such as top ranking according to the dimensions of domain name and uri; Number of errors viewed from the perspective of province and operator; View client distribution.
domain name
* | select host , count(*) as count where http_code > 400 group by host order by count desc limit 10
url
* | select url , count(*) as count where http_code > 400 group by url order by count desc limit 10
Province, operator analysis
* | select client_ip, ip_to_province(client_ip) as "province", ip_to_provider(client_ip) as "Operator" , count(*) as "Number of errors" where http_code >= 400 group by client_ip order by "Number of errors" DESC limit 100
Client distribution
* | select ua as "Client version", count(*) as "Number of errors" where http_code > 400 group by ua order by "Number of errors" desc limit 10sql

As can be seen from the figure, the errors are concentrated on the Safari client. After locating the problem, it is found that the new version bug leads to frequent failure of accessing resources in the Safari browser window.
4. User behavior analysis
demand
- Where do most users come from, internal or external
- Which resource users are popular resources
- Whether there are users downloading resources crazily, and whether the behavior meets the expectations
Solution
Access source analysis
* | select ip_to_province(client_ip) as province , count(*) as c group by province order by c desc limit 50
Access TopUrl
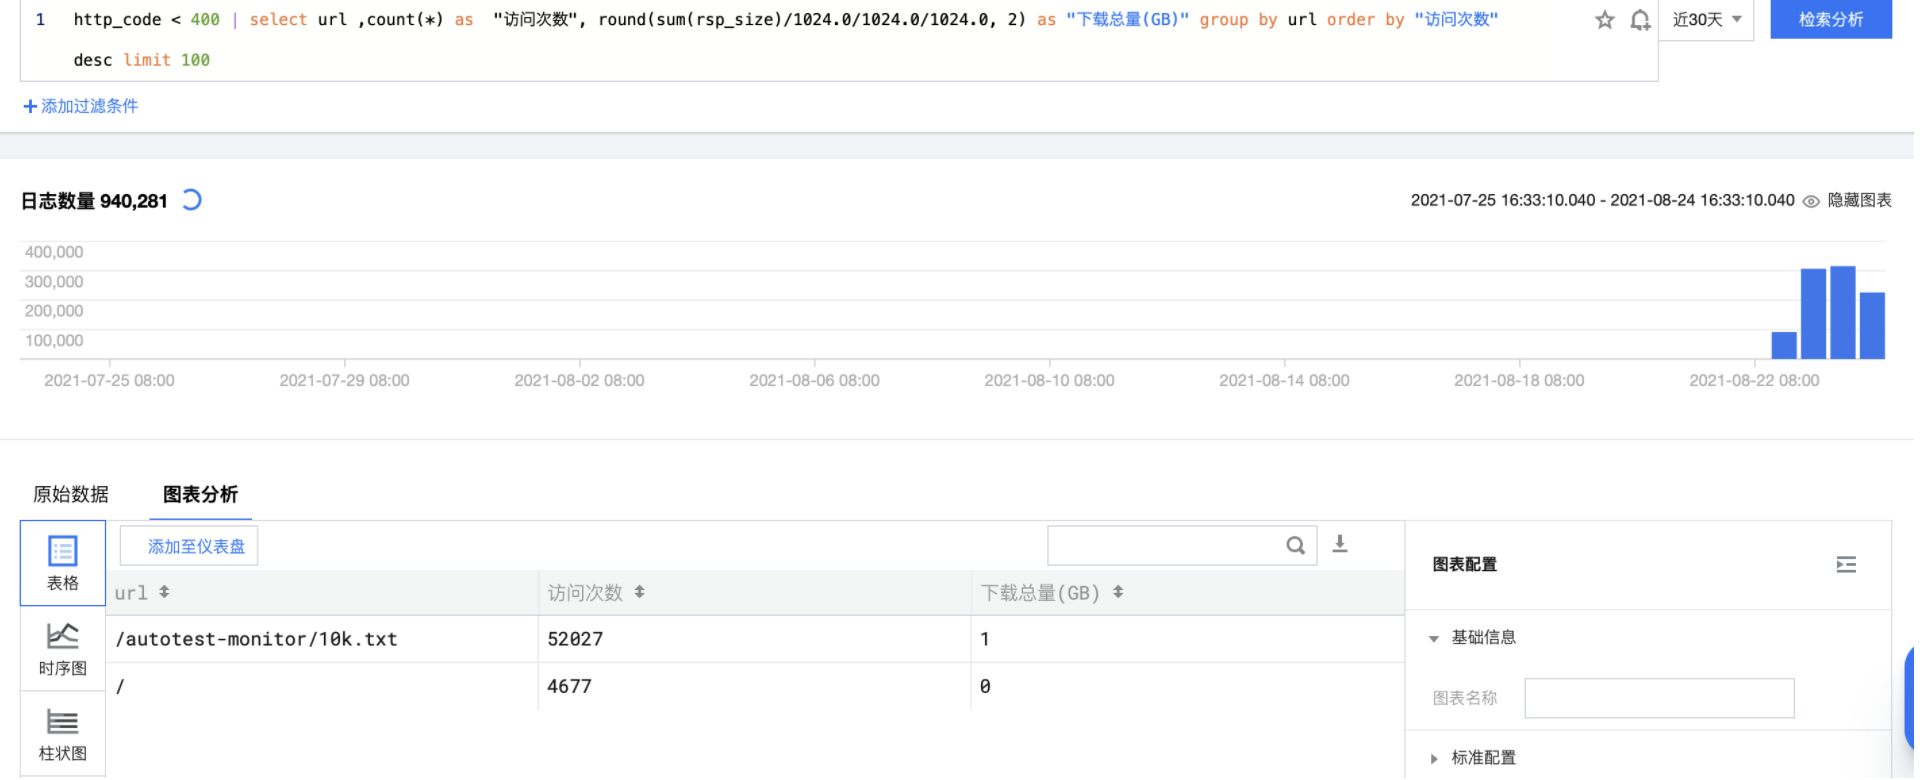
http_code < 400 | select url ,count(*) as "Number of visits", round(sum(rsp_size)/1024.0/1024.0/1024.0, 2) as "Total Downloads(GB)" group by url order by "Number of visits" desc limit 100
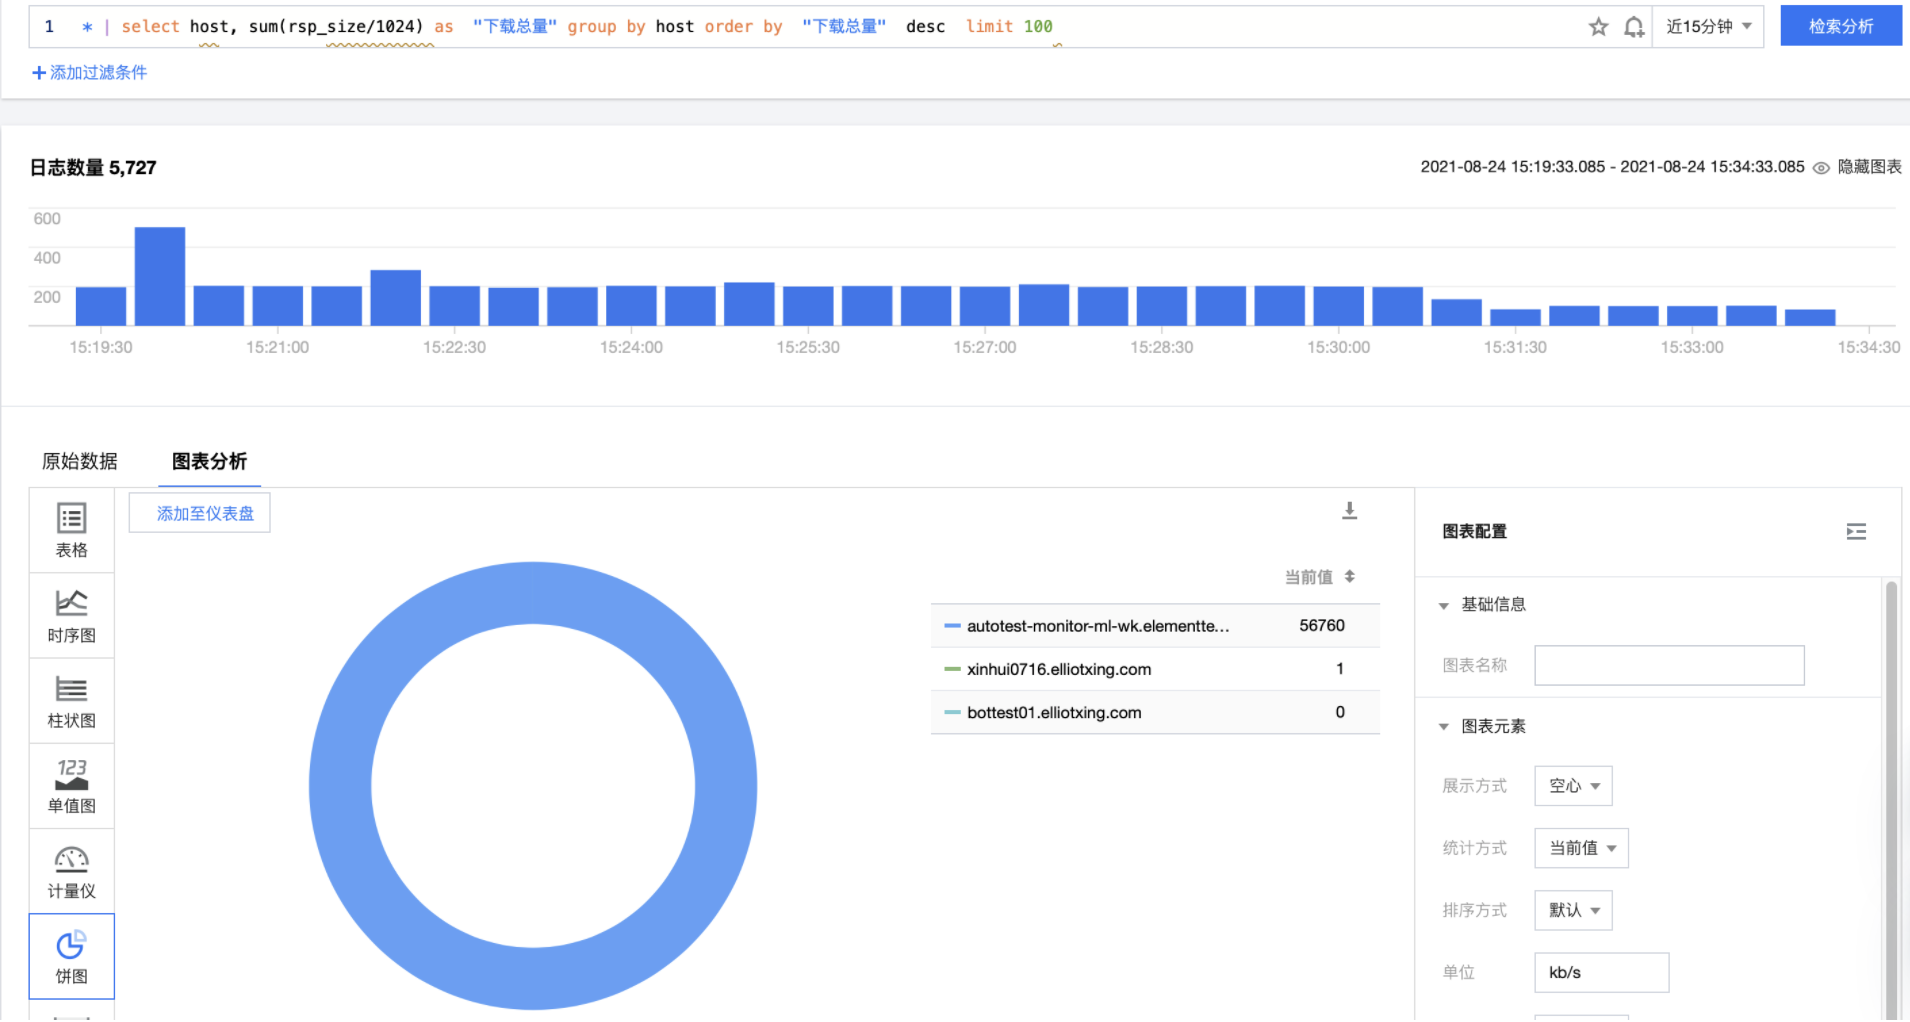
Top domain names of download traffic are sorted according to the amount of data downloaded by each domain name
* | select host, sum(rsp_size/1024) as "Total Downloads" group by host order by "Total Downloads" desc limit 100
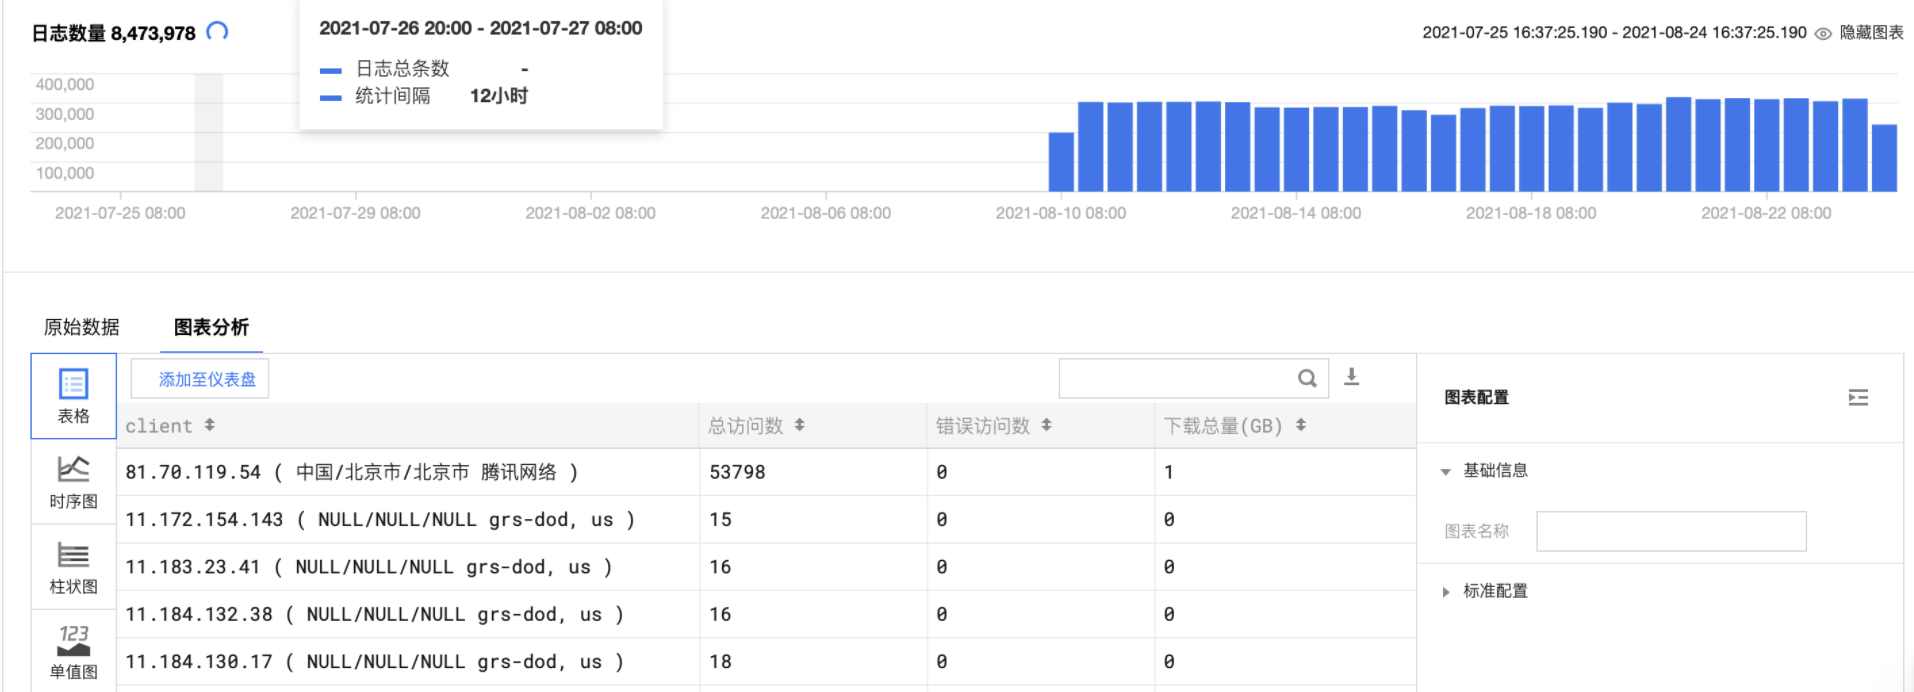
Downloads Top user statistics
* | SELECT CASE WHEN ip_to_country(client_ip)='Hong Kong' THEN concat(client_ip, ' ( Hong Kong )') WHEN ip_to_province(client_ip)='' THEN concat(client_ip, ' ( Unknown IP )') WHEN ip_to_provider(client_ip)='Intranet IP' THEN concat(client_ip, ' (Private IP )') ELSE concat(client_ip, ' ( ', ip_to_country(client_ip), '/', ip_to_province(client_ip), '/', if(ip_to_city(client_ip)='-1', 'Unknown city', ip_to_city(client_ip)), ' ',ip_to_provider(client_ip), ' )') END AS client, pv as "Total visits", error_count as "Number of wrong accesses" , throughput as "Total Downloads(GB)" from (select client_ip , count(*) as pv, round(sum(rsp_size)/1024.0/1024/1024.0, 1) AS throughput , sum(if(http_code > 400, 1, 0)) AS error_count from log group by client_ip order by throughput desc limit 100)
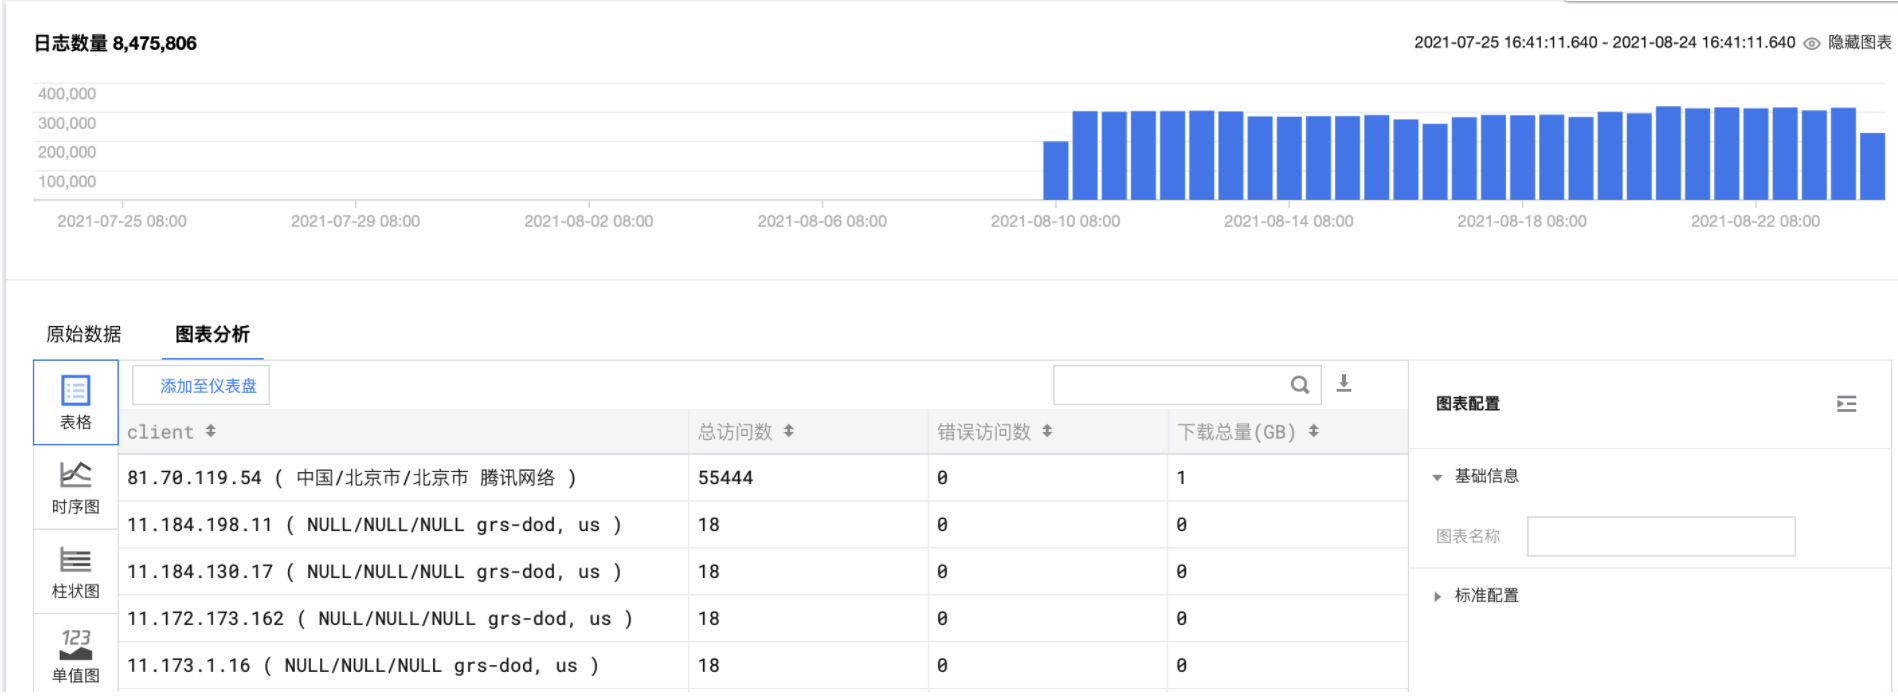
Effective access to Top user statistics
* | SELECT CASE WHEN ip_to_country(client_ip)='Hong Kong' THEN concat(client_ip, ' ( Hong Kong )') WHEN ip_to_province(client_ip)='' THEN concat(client_ip, ' ( Unknown IP )') WHEN ip_to_provider(client_ip)='Intranet IP' THEN concat(client_ip, ' (Private IP )') ELSE concat(client_ip, ' ( ', ip_to_country(client_ip), '/', ip_to_province(client_ip), '/', if(ip_to_city(client_ip)='-1', 'Unknown city', ip_to_city(client_ip)), ' ',ip_to_provider(client_ip), ' )') END AS client, pv as "Total visits", (pv - success_count) as "Number of wrong accesses" , throughput as "Total Downloads(GB)" from (select client_ip , count(*) as pv, round(sum(rsp_size)/1024.0/1024/1024.0, 1) AS throughput , sum(if(http_code < 400, 1, 0)) AS success_count from log group by client_ip order by success_count desc limit 100)
Access PV and UV statistics, statistics of the number of accesses in a certain period of time and the change trend of independent client ip
* | select date_trunc('minute', __TIMESTAMP__) as time, count(*) as pv,count( distinct client_ip) as uv group by time order by time limit 1000 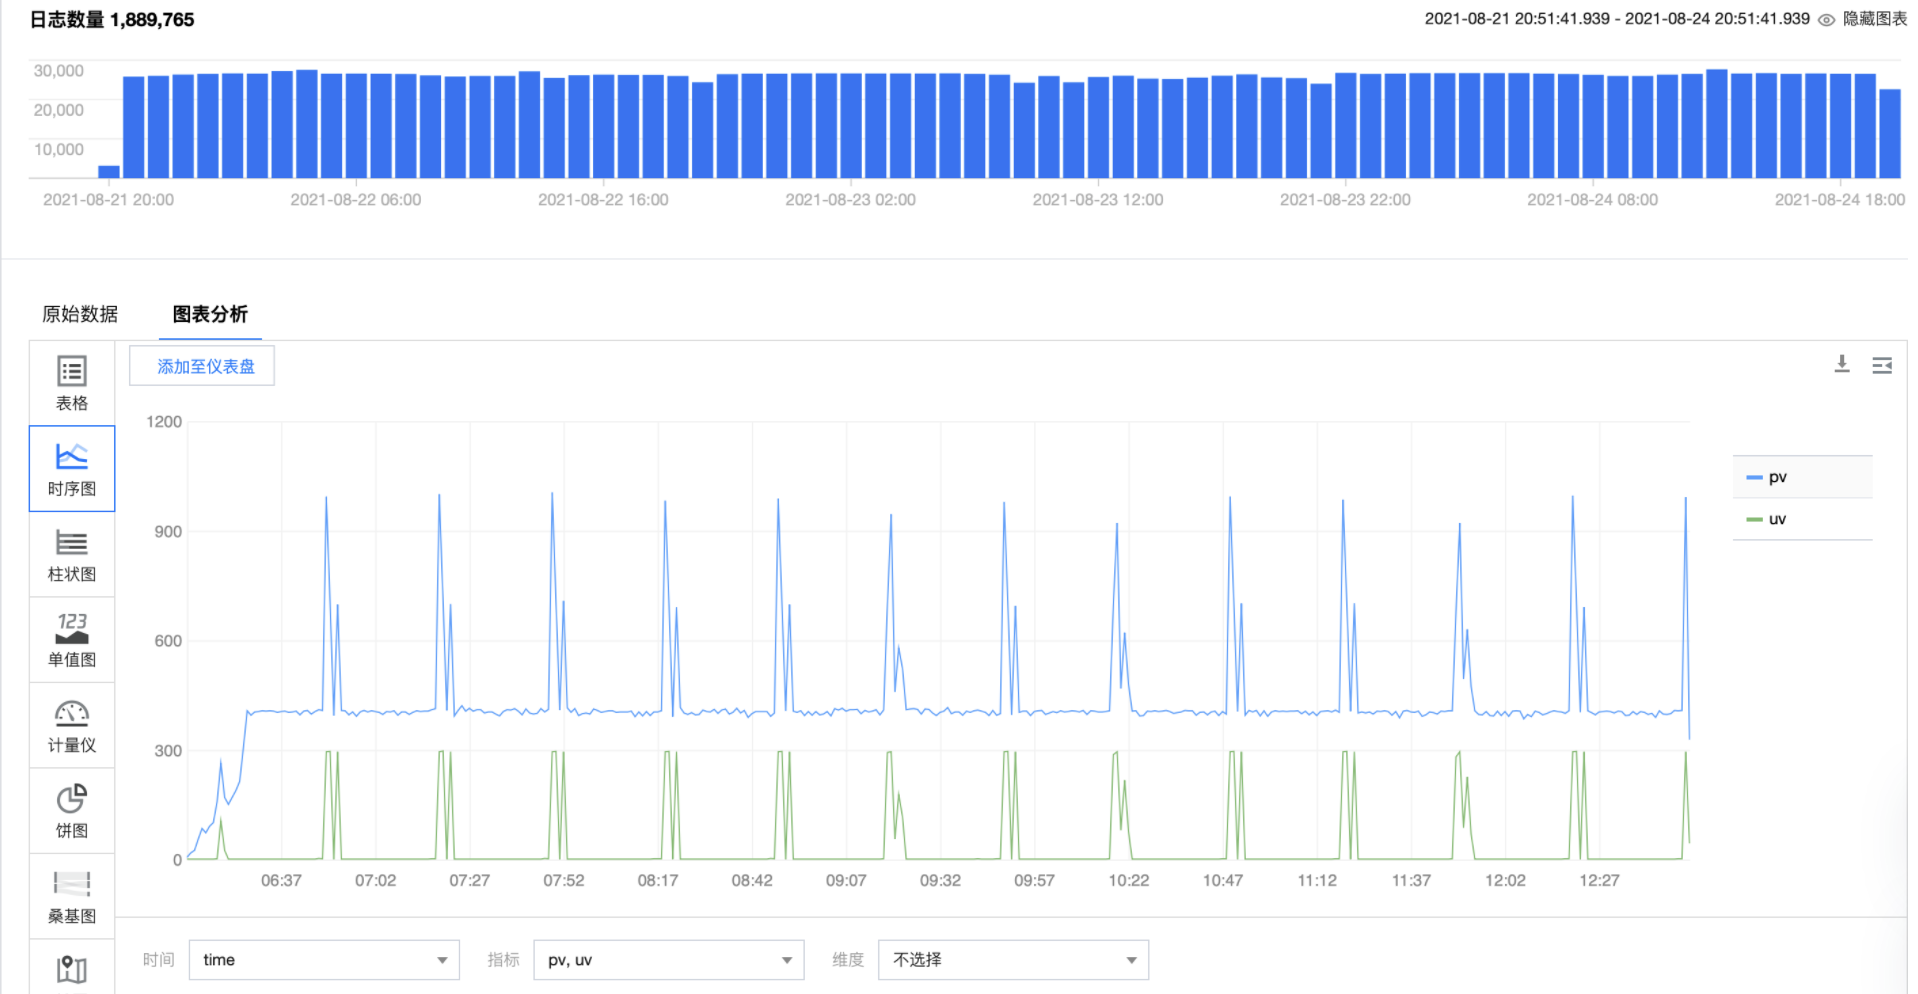
The above is the play sharing of CDN access log. If you have more interesting log practices, you are welcome to contribute and share!

Previous articles:
CLB O & M & operation best practices - big insight into access logs
[Tencent cloud log service CLS] detailed explanation of CLS service in serverless application
[log service CLS] application workflow ASW access CLS practice sharing
[log service CLS] Python development API access to CLS (with source code and detailed steps)
[log service CLS] Nginx access log access Tencent cloud log service