Another article by the author https://segmentfault.com/a/11... This paper describes the implementation of Canvas-based text editor "Simple Poetry", in which the text is rendered artistically by WebGL. This article mainly describes the process of obtaining font data by Canvas, segmentation and parsing of strokes, and rendering the effect by WebGL.
introduction
It is easy to draw text with canvas native api, but the function of beautifying text effect provided by native API is very limited. If you want to draw artistic characters other than edge drawing and gradient, and you don't need to spend time and effort making font libraries, using WebGL to render is a good choice.
This article mainly describes how to use canvas native api to obtain text pixel data, and process it with stroke segmentation, edge search, normal calculation, etc. Finally, these information is transmitted to the shader to realize basic illumination stereo text.
The advantage of using canvas native api to obtain text pixel information is that it can draw any browser-supported fonts without making additional font files; however, the disadvantage is that it is time-consuming for data processing of some advanced requirements, such as stroke segmentation. But for personal projects, this is a quick way to make the effect of custom art words.
The final results are as follows: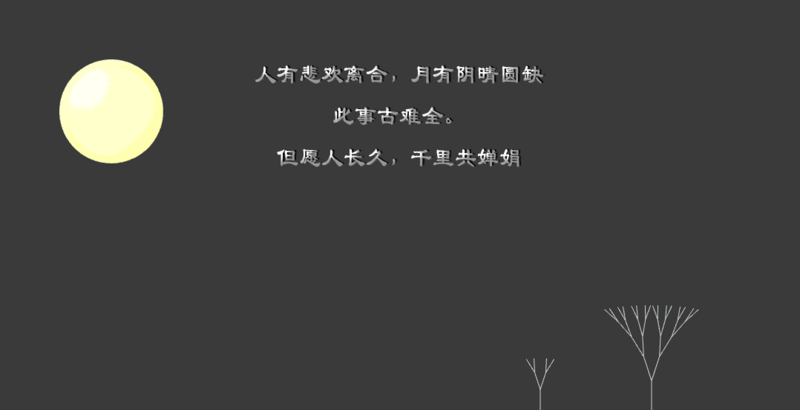
This paper focuses on the processing of text data, so only a relatively simple rendering effect is used, but with these data, it is easy to design a more dazzling text art effect.
"Simple Poetry" editor source code: https://github.com/moyuer1992...
Preview address: https://moyuer1992.github.io/...
The core code of word processing is: https://github.com/moyuer1992...
WebGL Rendering Core Code: https://github.com/moyuer1992...
Capturing font pixels by canvas
Getting text pixel information is the first step.
We use an off-screen canvas to draw basic text. Set the font size to size, set the size=200 in the project, and set the side length of canvas to be the same as the font size. The larger the size settings, the more accurate the pixel information is. Of course, the cost is longer. If the speed is pursued, the size can be reduced.
ctx.clearRect(0, 0, ctx.canvas.width, ctx.canvas.height);
ctx.font = size + 'px ' + (options.font || 'Official script');
ctx.fillStyle = 'black';
ctx.textAlign = 'center';
ctx.textBaseline = 'middle';
ctx.fillText(text, width / 2, height / 2);
Get pixel information:
var imageData = ctx.getImageData(0, 0, ctx.canvas.width, ctx.canvas.height);
var data = imageData.data;
Well, the data variable is the final pixel data we get. Now let's look at the data structure of data: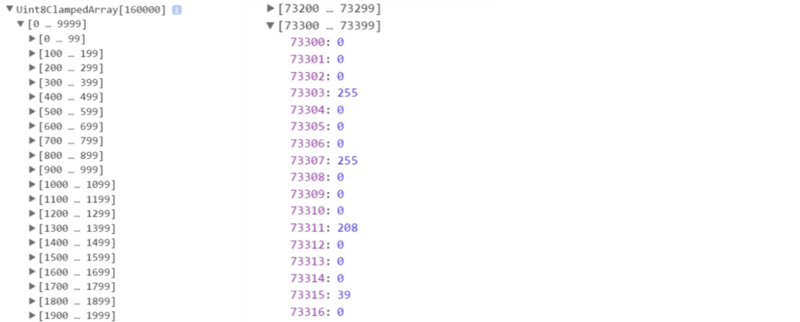
As you can see, the result is an array of 200 x 200 x 4 in length. The canvas of 200x200 has a total of 40,000 pixels, and the color on each pixel is represented by four values. Because of the use of black coloring, the top three must be 0. The fourth bit represents transparency. For colorless pixels, the value is 0. For colored points, the value is greater than zero. So, if we want to judge whether the text is worth in line j and column i, we just need to judge whether data [(j ctx. canvas. width + i) 4 + 3] is greater than zero.
Thus, we can write out a function to determine whether a position has a color or not.
var hasPixel = function (j, i) {
  //Line j, column i
  if (i < 0 || j < 0) {
    return false;
  }
  return !!data[(j * ctx.canvas.width + i) * 4 + 3];
};
Stroke segmentation
Next, we need to segment the words and strokes. In fact, it is a process of finding connected parts: the text is regarded as an image, and all connected parts of the image are found, each part is a stroke.
Looking for the idea of connected domain refer to this article:
http://www.cnblogs.com/ronny/...
The algorithm can be roughly divided into several steps:
Scan the image line by line and record the connected segments of each line.
Each connected segment is labeled. For the first line, the connected segments are labeled from the beginning. If it is not the first line, it is judged whether it is connected to a connected segment of the previous line, and if so, it is given the label of the connected segment.
If a connected segment is connected with two connected segments in the previous row at the same time, the pair is recorded.
By merging all associations (i.e. the process of merging and collecting), the unique label of each connected domain is obtained.
Here is the core code. Key variables are defined as follows:
g: width * height two-dimensional array, indicating which connected domain each pixel belongs to. A value of 0 means that the pixel is not in text, but is transparent.
e: width * height two-dimensional array, indicating whether each pixel is an image edge.
markMap: Record Association pairs.
cnt: Associates the total number of tags before merging.
Progressive scanning:
for (var j = 0; j < ctx.canvas.height; j += grid) {
  g.push([]);
  e.push([]);

  for (var i = 0; i < ctx.canvas.width; i += grid) {
    var value = 0;
    var isEdge = false;


    if (hasPixel(j, i)) {
      value = markPoint(j, i);
    }
    e[j][i] = isEdge;
    g[j][i] = value;
  }
}
Mark:
var markPoint = function (j, i) {
  var value = 0;

  if (i > 0 && hasPixel(j, i - 1)) {
    //Connected to the left
    value = g[j][i - 1];
  } else {
    value = ++cnt;
  }

  if ( j > 0 && hasPixel(j - 1, i) && ( i === 0 || !hasPixel(j - 1, i - 1) ) ) {
    //Up-connected and left-disconnected (i.e., first-time and last-line connections)
    if (g[j - 1][i] !== value) {
      markMap.push([g[j - 1][i], value]);
    }
  }

  if ( !hasPixel(j, i - 1) ) {
    //The head of a row
    if ( hasPixel(j - 1, i - 1) && g[j - 1][i - 1] !== value) {
      //Connected to the upper left
      markMap.push([g[j - 1][i - 1], value]);
    }
  }

  if ( !hasPixel(j, i + 1) ) {
    //End of line
    if ( hasPixel(j - 1, i + 1) && g[j - 1][i + 1] !== value) {
      //Connected to the upper right
      markMap.push([g[j - 1][i + 1], value]);
    }
  }

  return value;
};
So far, the whole image is traversed once, and the steps of 1-3 in the algorithm have been completed. Next, we need to classify the tags according to the correlation information in markMap, and the final image is formed. The pixels with the same tag are in the same connected domain (that is, the same stroke).
It is a problem to classify tags by association, and the core code is as follows:
for (var i = 0; i < cnt; i++) {
  markArr[i] = i;
}

var findFather = function (n) {
  if (markArr[n] === n) {
    return n;
  } else {
    markArr[n] = findFather(markArr[n]);
    return markArr[n];
  }
}

for (i = 0; i < markMap.length; i++) {
  var a = markMap[i][0];
  var b = markMap[i][3];

  var f1 = findFather(a);
  var f2 = findFather(b);

  if (f1 !== f2) {
    markArr[f2] = f1;
  }
}
Finally, we get the markArr array, which records the final category tags corresponding to each original tag number.
For example, let the array of images marked in the previous step be g; if mark Arr [3] = 1 and mark[5] = 1, then all the pixels in G with values of 3 and 5 belong to a connected domain, which is marked 1.
By processing g according to the markArr array, we can get the final segmentation data of the connected domain.
Text Contour Search
After getting the segmented image data, we can use WebGL to render in the form of gl.POINTS, and we can set different colors for different strokes. But that does not meet our needs. We want to render text into a three-dimensional model, which means that we need to convert two-dimensional lattice into three-dimensional graphics.
Assuming that the text has n strokes, the data we have now can be viewed as N-block connected lattices. Firstly, we need to convert n text lattices into n two-dimensional graphics. In WebGL, all faces must be made up of triangles. This means that we need to convert a lattice into a set of adjacent triangles.
Perhaps the first idea you can think of is to connect every three adjacent pixels to form a triangle, which is indeed a method, but because of the excessive number of pixels, this method takes a long time and is not recommended.
Our thinking to solve this problem is:
Find the outline of each stroke (that is, each connected area) and store it in an array clockwise.
In this case, the contour of each connected domain can be regarded as a polygon, and then it can be divided into several triangulations by classical triangulation algorithm.
The contour search algorithm can also refer to this article:
http://www.cnblogs.com/ronny/...
The general idea is to find the first empty pixel above the first point as the starting point of the outline, record the entrance direction of 6 (directly above), find the next connected pixel along the clockwise direction, and record the entrance direction, and so on, until the end coincides with the starting point.
Next, we need to determine whether there is hollowing, so we need to find the inner contour point, the first point below which is empty pixel and not on any contour, as the starting point of the inner contour, the entry is 2 (right below), the next step is the same as looking for the outer contour.
Note that the image may not have only one inner contour, so there is a need for circular judgment. If such a pixel does not exist, there is no inner contour.
Through the previous data processing, we can easily determine whether a pixel is above the contour: as long as we can determine whether there are non-empty pixels around it. But the key problem is that the triangulation algorithm needs the vertices of "polygon" arranged in order. In this way, the core logic is actually how to sort contour pixels clockwise.
The contour sequential search method for a single connected domain is as follows:
Variable definitions:
v: Current Connected Domain Marker
g: width * height two-dimensional array, indicating which connected domain each pixel belongs to. A value of 0 means that the pixel is not in text, but is transparent. If the value is v, the pixel is in the current connected domain.
e: width * height two-dimensional array, indicating whether each pixel is an image edge.
entryRecord: Entry Orientation Marker Array
rs: Final contour result
holes: If there is an inner contour, it is the starting point of the inner contour (the inner contour point is at the end of the array, if there are multiple inner contours, then only the starting position of the inner contour can be recorded. This is to adapt to the parameter settings of the triangulation library earcut, which will be mentioned later).
Code:
function orderEdge (g, e, v, gap) {
  v++;
  var rs = [];
  var entryRecord = [];
  var start = findOuterContourEntry(g, v);
  var next = start;
  var end = false;
  rs.push(start);
  entryRecord.push(6);
  var holes = [];
  var mark;
  var holeMark = 2;
  e[start[1]][start[0]] = holeMark;

  var process = function (i, j) {
    if (i < 0 || i >= g[0].length || j < 0 || j >= g.length) {
      return false;
    }

    if (g[j][i] !== v || tmp) {
      return false;
    }

    e[j][i] = holeMark;
    tmp = [i, j]
    rs.push(tmp);
    mark = true;

    return true;
  }

  var map = [
    (i,j) => {return {'i': i + 1, 'j': j}},
    (i,j) => {return {'i': i + 1, 'j': j + 1}},
    (i,j) => {return {'i': i, 'j': j +1}},
    (i,j) => {return {'i': i - 1, 'j': j + 1}},
    (i,j) => {return {'i': i - 1, 'j': j}},
    (i,j) => {return {'i': i - 1, 'j': j - 1}},
    (i,j) => {return {'i': i, 'j': j - 1}},
    (i,j) => {return {'i': i + 1, 'j': j - 1}},
  ];

  var convertEntry = function (index) {
    var arr = [4, 5, 6, 7, 0, 1, 2, 3];
    return arr[index];
  }

  while (!end) {
    var i = next[0];
    var j = next[1];
    var tmp = null;
    var entryIndex = entryRecord[entryRecord.length - 1];

    for (var c = 0; c < 8; c++) {
      var index = ((entryIndex + 1) + c) % 8;
      var hasNext = process(map[index](i, j).i, map[index](i, j).j);
      if (hasNext) {
        entryIndex = convertEntry(index);
        break;
      }
    }

    if (tmp) {
      next = tmp;

      if ((next[0] === start[0]) && (next[1] === start[1])) {
        var innerEntry = findInnerContourEntry(g, v, e);
        if (innerEntry) {
          next = start = innerEntry;
          e[start[1]][start[0]] = holeMark;
          rs.push(next);
          entryRecord.push(entryIndex);
          entryIndex = 2;
          holes.push(rs.length - 1);
          holeMark++;
        } else {
          end = true;
        }
      }
    } else {
      rs.splice(rs.length - 1, 1);
      entryIndex = convertEntry(entryRecord.splice(entryRecord.length - 1, 1)[0]);
      next = rs[rs.length - 1];
    }

    entryRecord.push(entryIndex);
  }
  return [rs, holes];
}
function findOuterContourEntry (g, v) {
  var start = [-1, -1];
  for (var j = 0; j < g.length; j++) {
    for (var i = 0; i < g[0].length; i++) {
      if (g[j][i] === v) {
        start = [i, j];
        return start;
      }
    }
  }
  return start;
}
function findInnerContourEntry (g, v, e) {
  var start = false;
  for (var j = 0; j < g.length; j++) {
    for (var i = 0; i < g[0].length; i++) {
      if (g[j][i] === v && (g[j + 1] && g[j + 1][i] === 0)) {
        var isInContours = false;
        if (typeof(e[j][i]) === 'number') {
          isInContours = true;
        }
        if (!isInContours) {
          start = [i, j];
          return start;
        }
      }
    }
  }
  return start;
}
In order to check the search of inner contour in particular, we find a text test with a circular connected domain.
Seeing everything ok, then this step is done with great success.
For the triangulation process, we use the open source library earcut for processing. Earcut project address:
https://github.com/mapbox/earcut
Triangle arrays are computed by earcut:
var triangles = earcut(flatten(points), holes);
For each triangle, the coordinates of three vertices need to be set when entering the shader, and the normal vector of the plane of the triangle needs to be calculated at the same time. For a triangle consisting of three vertices a, B and c, the normal vector is calculated as follows:
var normal = cross(subtract(b, a), subtract(c, a));
We now have only one side of the text. Since we want to make stereo text, we need to calculate the front, back and side of the text at the same time.
Front and back are easy to get:
for (var n = 0; n < triangles.length; n += 3) {
  var a = points[triangles[n]];
  var b = points[triangles[n + 1]];
  var c = points[triangles[n + 2]];

  //===== Font Positive Data=====
  triangle(vec3(a[0], a[1], z), vec3(b[0], b[1], z), vec3(c[0], c[1], z), index);

  //===== Font Back Data=====
  triangle(vec3(a[0], a[1], z2), vec3(b[0], b[1], z2), vec3(c[0], c[1], z2), index);
}
The key point is the construction of the side, which needs to consider both internal and external contours. The front and back sides of each group of adjacent points on the contour can form a rectangle, which can be divided into two triangles to obtain the side structure. The code is as follows:
var holesMap = [];
var last = 0;

if (holes.length) {
  for (var holeIndex = 0; holeIndex < holes.length; holeIndex++) {
    holesMap.push([last, holes[holeIndex] - 1]);
    last = holes[holeIndex];
  }
}

holesMap.push([last, points.length - 1]);

for (var i = 0; i < holesMap.length; i++) {
  var startAt = holesMap[i][0];
  var endAt = holesMap[i][1];

  for (var j = startAt; j < endAt; j++) {
    triangle(vec3(points[j][0], points[j][1], z), vec3(points[j][0], points[j][1], z2), vec3(points[j+1][0], points[j+1][1], z), index);
    triangle(vec3(points[j][0], points[j][1], z2), vec3(points[j+1][0], points[j+1][1], z2), vec3(points[j+1][0], points[j+1][1], z), index);
  }
  triangle(vec3(points[startAt][0], points[startAt][1], z), vec3(points[startAt][0], points[startAt][1], z2), vec3(points[endAt][0], points[endAt][1], z), index);
  triangle(vec3(points[startAt][0], points[startAt][1], z2), vec3(points[endAt][0], points[endAt][1], z2), vec3(points[endAt][0], points[endAt][1], z), index);
}
WebGL Rendering
So far, we've processed all the data we need. Next, we need to pass the useful parameters to the vertex shader.
The parameters passed into the vertex shader are defined as follows:
attribute vec3 vPosition;
attribute vec4 vNormal;

uniform vec4 ambientProduct, diffuseProduct, specularProduct;
uniform mat4 modelViewMatrix;
uniform mat4 projectionMatrix;
uniform vec4 lightPosition;
uniform float shininess;
uniform mat3 normalMatrix;
The variables from vertex shader output to chip shader are defined as follows:
varying vec4 fColor;
Vertex shader key code:
vec4 aPosition = vec4(vPosition, 1.0);

......

gl_Position = projectionMatrix * modelViewMatrix * aPosition;
fColor = ambient + diffuse +specular;
Chip shader key code:
gl_FragColor = fColor;
Follow-up
The rendering of a three-dimensional Chinese character has been completed. You must think that this effect is not cool enough. Maybe you want to add some animation to it. Don't worry. The next article will introduce a text effect and animation design.