In the chart, the chart data label represents the specific data in the chart in the form of data, which can enhance the readability of the chart. We can add data labels to the chart, or modify or delete the existing data labels. The following will be implemented in the form of C code.
Using tool: fire.xls for. Net pack
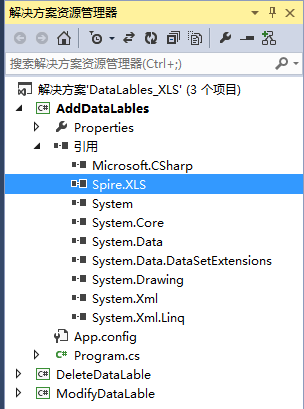
dll file acquisition and reference:
Method 1: Pass Download official website Bag. After downloading, unzip the file and install the program under Bin folder. After installation, add the Spire.Xls.dll file under the Bin folder in the installation path to the vs project program. As follows:
Method 2: available through Nuget Download.
C# example
[add data label]
using Spire.Xls;
using Spire.Xls.Charts;
using System.Drawing;


namespace AddDataLables
{
    class Program
    {
        static void Main(string[] args)
        {
            //Load test document
            Workbook workbook = new Workbook();
            workbook.LoadFromFile("test.xlsx");

            //Get the first workbook and the first chart in it
            Worksheet sheet = workbook.Worksheets[0];
            Chart chart = sheet.Charts[0];

            //Get the specified series in the chart
            ChartSerie serie1 = chart.Series[1];
            //Add data label,And set data label style
            serie1.DataPoints.DefaultDataPoint.DataLabels.HasValue = true;
            serie1.DataPoints.DefaultDataPoint.DataLabels.FrameFormat.Fill.FillType = ShapeFillType.SolidColor;
            serie1.DataPoints.DefaultDataPoint.DataLabels.FrameFormat.Fill.ForeColor = Color.White;
            serie1.DataPoints.DefaultDataPoint.DataLabels.FrameFormat.Border.Pattern = ChartLinePatternType.Solid;
            serie1.DataPoints.DefaultDataPoint.DataLabels.FrameFormat.Border.Color = Color.Green;


            ////Use data customization from other cells in the document datalabel
            //ChartSerie serie2 = chart.Series[2];
            //serie2.DataPoints.DefaultDataPoint.DataLabels.ValueFromCell = sheet.Range["B4:E4"];
            ////Add data annotation
            //serie2.DataPoints.DefaultDataPoint.DataLabels.HasWedgeCallout = true;

            //Save document
            workbook.SaveToFile("AddDataLable.xlsx");
            System.Diagnostics.Process.Start("AddDataLable.xlsx");
        }
    }
}
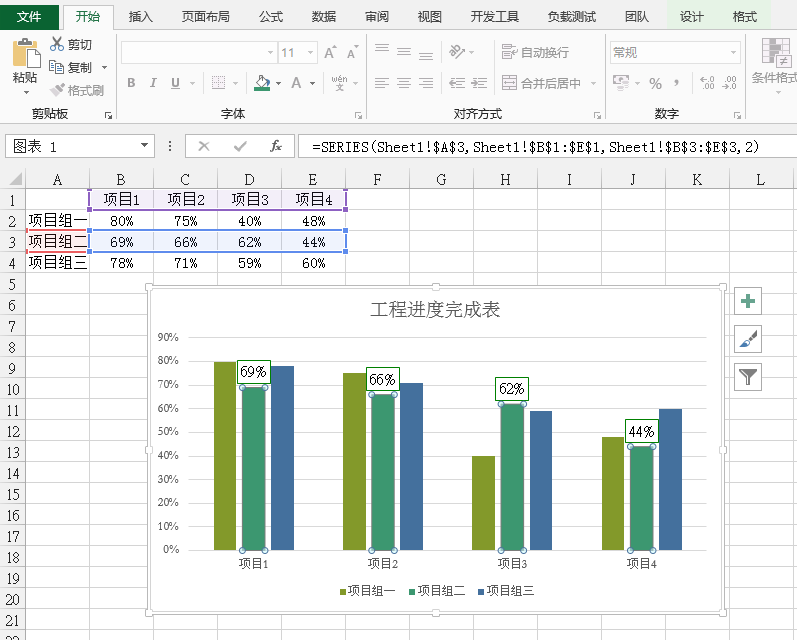
Data label effect:
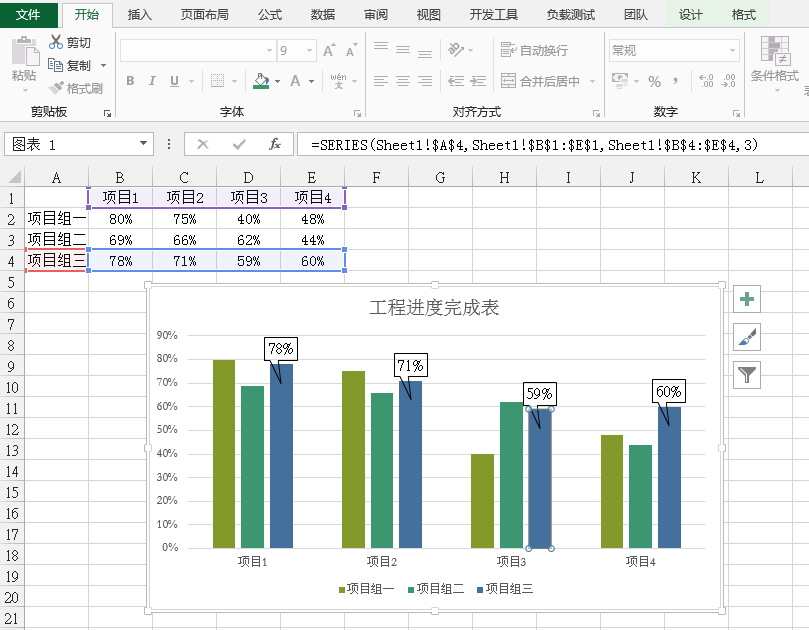
Data annotation effect:
[edit / modify data label]
Here, take the data annotation added in the above code as an example to modify.
using Spire.Xls;
using Spire.Xls.Charts;
using System.Drawing;


namespace ModifyDataLable
{
    class Program
    {
        static void Main(string[] args)
        {
            //Loading documents
            Workbook workbook = new Workbook();
            workbook.LoadFromFile("AddDataLable.xlsx");

            //Get the first worksheet and the first chart in it
            Worksheet sheet = workbook.Worksheets[0];
            Chart chart = sheet.Charts[0];

            //Get chart series and data labels
            ChartSerie chartSeries = chart.Series[2];
            ChartDataLabels cslabel = chartSeries.DataPoints[1].DataLabels;


            cslabel.HasLegendKey = true;//Set display legend key
            cslabel.Position = DataLabelPositionType.Center;//Center data labels

            //The location of the custom data label. The default origin is in the upper left corner of the chart.;
            cslabel.IsYMode = true;
            cslabel.IsXMode = true;
            cslabel.X = 1100;
            cslabel.Y = 400;

            //Set display guide line (any one DataPoint Will take effect for the entire series, but will not show effect until the data label position is customized.)
            cslabel.ShowLeaderLines = true;

            //Cancel wedge dimension (set any one DataPoint Will work for the entire series)
            cslabel.HasWedgeCallout = false;

            //Preservation
            workbook.SaveToFile("ModifyDatalable.xlsx");
            System.Diagnostics.Process.Start("ModifyDatalable.xlsx");
        }
    }
}
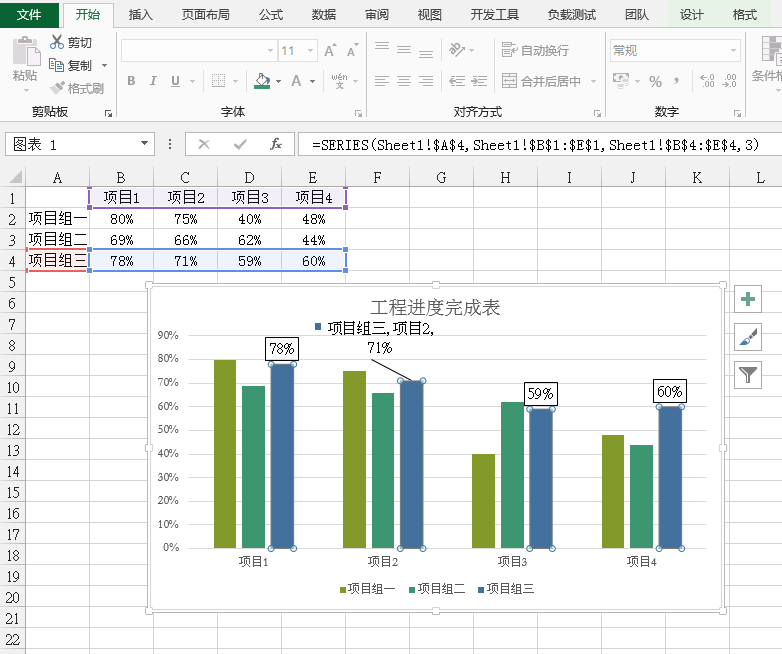
Data label modification effect:
[delete data label]
using Spire.Xls;
using Spire.Xls.Charts;

namespace DeleteDataLable
{
    class Program
    {
        static void Main(string[] args)
        {
            //Loading documents
            Workbook workbook = new Workbook();
            workbook.LoadFromFile("AddDataLable.xlsx");

            //Get the first worksheet and the first chart in it
            Worksheet sheet = workbook.Worksheets[0];
            Chart chart = sheet.Charts[0];

            //Delete data labels for all series
            for (int i = 0; i < chart.Series.Count; i++)
            {
                ChartSerie chartSeries = chart.Series[i];
                chartSeries.DataPoints.Clear();
            }


            //Delete the data label of the specified data series
            //ChartSerie chartSeries = chart.Series[2];
            //chartSeries.DataPoints.Clear();


            //Delete the specified value of the data label in the specified series
            //ChartSerie chartSeries = chart.Series[2];
            //ChartDataLabels cslabel = chartSeries.DataPoints[0].DataLabels;
            //cslabel.Text = " ";
            //cslabel.HasLegendKey = false;


            //Save document
            workbook.SaveToFile("RemoveDataLable.xlsx");
            System.Diagnostics.Process.Start("RemoveDataLable.xlsx");
        }
    }
}
After running the program, you can view the data label deletion effect.
(end of this paper)