Summary
In the monitoring system, we usually divide the monitoring into white box monitoring and black box monitoring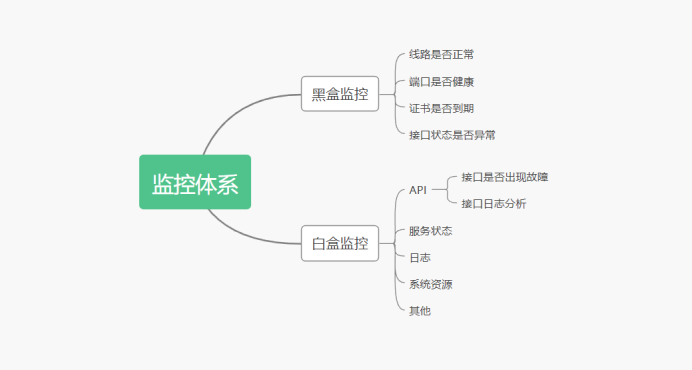
Black box monitoring: the main concern is generally what is happening. For example, when an alarm occurs and the service interface is abnormal, this monitoring is the monitoring that can be seen from the user's point of view, and the key is to be able to alarm the faults that are happening.
White box monitoring: the main concern is the reason, that is, some indicators of internal system exposure, such as redis slave down displayed in redis info, which is an internal indicator displayed in redis info. The key lies in the reason. Maybe redis down is seen in black box monitoring, while redis port is referenced connection is displayed when viewing internal information.
White box monitoring: there are many kinds, including middleware, storage, and web server. For example, redis can use info to expose internal indicator information; mysql can use show variables to expose internal indicator information; nginx can use nginx ﹣ status to expose internal information, and system business indicators can be collected through embedded points or commands.
Blackbox Exporter
In the previous knowledge, we introduced how to carry out white box monitoring under Prometheus: We monitored the resource consumption of the host, the running state of the container, the running data of the database middleware, and predicted our service health state by collecting relevant indicators. In terms of black box monitoring. Blackbox Exporter is the official black box monitoring solution provided by Prometheus community, which allows users to detect the network through HTTP, HTTPS, DNS, TCP and ICMP.
Blackbox? Exporter application scenario
- HTTP test
Define Request Header information
Determine HTTP status / HTTP responses header / HTTP body content - TCP test
Business component port status monitoring
Application layer protocol definition and monitoring - ICMP test
Host detection mechanism - POST test
Port Connectivity - SSL certificate expiration time
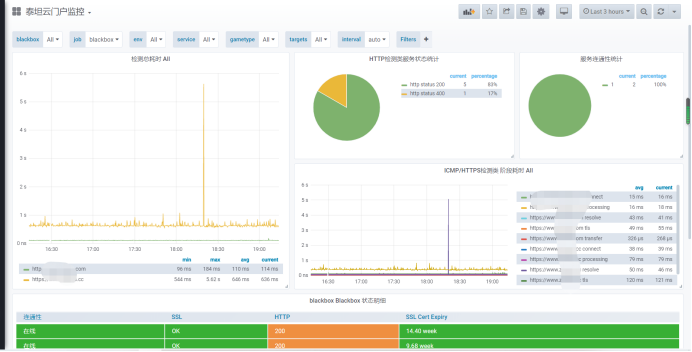
Related templates generated in combination with grafana:
1, First of all, take a look at the relevant charts on our side. There are a number of portal indicators and ssl monitoring:
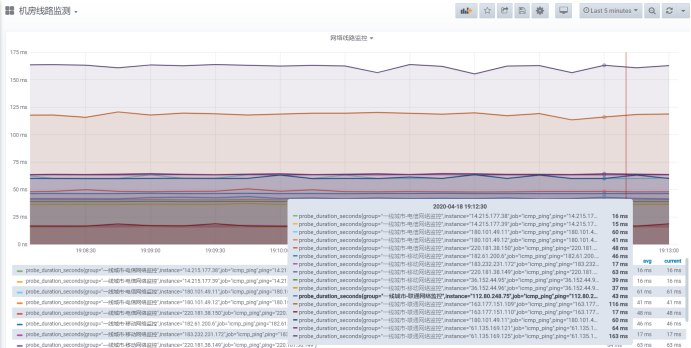
2. Line monitoring:
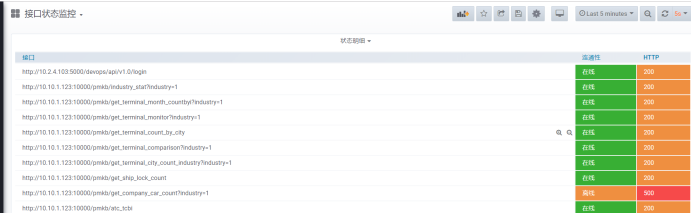
3. Interface status monitoring:
Blackbox Exporter deployment:
1. Install Exporter:
[root@cinder1 src]# wget https://github.com/prometheus/blackbox_exporter/releases/download/v0.16.0/blackbox_exporter-0.16.0.linux-amd64.tar.gz
[root@cinder1 src]#tar -zxvf blackbox_exporter-0.16.0.linux-amd64.tar.gz -C /usr/local
[root@cinder1 src]#mv /usr/local/blackbox_exporter-0.16.0.linux-amd64 /usr/local/blackbox_exporter
2. Add to startup:
[root@cinder1 src]# cat /etc/systemd/system/blackbox_exporter.service
[Unit]
Description=blackbox_exporter
After=network.target

[Service]
WorkingDirectory=/usr/local/blackbox
ExecStart=/usr/local/blackbox/blackbox_exporter \
         --config.file=/usr/local/blackbox/blackbox.yml
[Install]
WantedBy=multi-user.target
3. Check whether it starts normally:
[root@cinder1 src]# ss -tunlp|grep 9115
tcp    LISTEN     0      128      :::9115                 :::*                   users:(("blackbox_export",pid=2517722,fd=3))
icmp monitoring
Through the collection of icmp, we can confirm whether there is a problem in the line to the other party. This is also an important part of monitoring. We want to know what is wrong with the line from all over the country to our computer room. We summarize two schemes:
1. ping and access data collection of nodes all over the country. This kind of service is provided by cloud operators, but it costs money.
2. The method I use now is to find out the nodes that are testing ping everywhere. We can actively ping from the computer room to see if there is any line fault. Let's start.
1, prometheus adds relevant monitoring, and Blackbox starts with the default configuration:
  - job_name: "icmp_ping"
    metrics_path: /probe
    params:
      module: [icmp]  # Using icmp module
    file_sd_configs:
    - refresh_interval: 10s
      files:
      - "/home/prometheus/conf/ping_status*.yml"  #Specific profile
    relabel_configs:
    - source_labels: [__address__]
      regex: (.*)(:80)?
      target_label: __param_target
      replacement: ${1}
    - source_labels: [__param_target]
      target_label: instance
    - source_labels: [__param_target]
      regex: (.*)
      target_label: ping
      replacement: ${1}
    - source_labels: []
      regex: .*
      target_label: __address__
      replacement: 192.168.1.14:9115
2, Related ping node configuration:
[root@cinder1 conf]# cat ping_status.yml
- targets: ['220.181.38.150','14.215.177.39','180.101.49.12','14.215.177.39','180.101.49.11','14.215.177.38','14.215.177.38']
  labels:
    group: 'first-tier cities-Telecommunication network monitoring'
- targets: ['112.80.248.75','163.177.151.109','61.135.169.125','163.177.151.110','180.101.49.11','61.135.169.121','180.101.49.11']
  labels:
    group: 'first-tier cities-Unicom Network Monitoring'
- targets: ['183.232.231.172','36.152.44.95','182.61.200.6','36.152.44.96','220.181.38.149']
  labels:
    group: 'first-tier cities-Mobile network monitoring'
#These data are collected from ping websites all over the country. You can get them from those websites
3, Add grafana
This grafana is defined by myself. When I see that there is no one on the Internet, I define one myself. You can download it from github and see the effect:

http related indicators monitoring:
1, prometheus configure HTTP get access:
  - job_name: "blackbox"
    metrics_path: /probe
    params:
      module: [http_2xx]  #Using the http module
    file_sd_configs:
    - refresh_interval: 1m
      files:
      - "/home/prometheus/conf/blackbox*.yml"
    relabel_configs:
    - source_labels: [__address__]
      target_label: __param_target
    - source_labels: [__param_target]
      target_label: instance
    - target_label: __address__
      replacement: 192.168.1.14:9115
2, Related configuration files are as follows:
[root@cinder1 conf]# cat /home/prometheus/conf/blackbox-dis.yml
- targets:
  - https://www.zhibo8.cc
  - https://www.baidu.com
#Configure related URL s
3, To add a grafana template:
You can select the 9965 template of the template. We also see the previous template, which provides relevant ssl expiration detection.
Interface get request detection
1, prometheus configuration is the same as our previous configuration. Let's look at the configuration file directly:
  - job_name: "check_get"
    metrics_path: /probe
    params:
      module: [http_2xx]  # Look for a HTTP 200 response.
    file_sd_configs:
    - refresh_interval: 1m
      files:
      - "/home/prometheus/conf/service_get.yml"
    relabel_configs:
    - source_labels: [__address__]
      target_label: __param_target
    - source_labels: [__param_target]
      target_label: instance
    - target_label: __address__
      replacement: 192.168.1.14:9115
2, Related interface configuration reference:
[root@cinder1 conf]# cat service_get.yml
- targets:
  - http://10.10.1.123:10000/pmkb/atc_tcbi
  - http://10.10.1.123:10000/pmkb/get_ship_lock_count
  - http://10.10.1.123:10000/pmkb/get_terminal_count_by_city
  - http://10.10.1.123:10000/pmkb/get_terminal_monitor?industry=1
  - http://10.10.1.123:10000/pmkb/get_terminal_comparison?industry=1
  - http://10.10.1.123:10000/pmkb/get_terminal_city_count_industry?industry=1
  - http://10.10.1.123:10000/pmkb/industry_stat?industry=1
  - http://10.10.1.123:10000/pmkb/get_company_car_count?industry=1
  - http://10.10.1.123:10000/pmkb/get_terminal_month_countbyi?industry=1
  labels:
    group: 'service'
3, grafana is customized as before and can be downloaded from github.
Interface post request status detection:
1, First, we need to change the blackbox.yml configuration of the post related interface. We define a module ourselves:
[root@cinder1 blackbox]# cat blackbox.yml
modules:
  http_2xx:
    prober: http
  http_post_2xx:   #The module name can be defined by itself
    prober: http
    http:
      method: POST
      headers:
        Content-Type: application/json   #Add head
      body: '{"username":"admin","password":"123456"}'  #Here we take the login interface as an example
2, Add to prometheus:
  - job_name: "check_service"
    metrics_path: /probe
    params:
      module: [http_post_2xx]  # This corresponds to the module defined in the configuration file
    file_sd_configs:
    - refresh_interval: 1m
      files:
      - "/home/prometheus/conf/service_post.yml"
    relabel_configs:
    - source_labels: [__address__]
      target_label: __param_target
    - source_labels: [__param_target]
      target_label: instance
    - target_label: __address__
      replacement: 192.168.1.14:9115
3, Related configuration:
[root@cinder1 conf]# cat service_post.yml
- targets:
  - http://10.2.4.103:5000/devops/api/v1.0/login
  labels:
    group: 'service'
4, Add the related configuration of grafana, which is also self-defined, and can be downloaded from github.
tcp port status detection:
What I understand is that it's almost like telnet to check whether the port is online
1, prometheus configuration:
  - job_name: 'port_status'
    metrics_path: /probe
    params:
      module: [tcp_connect]  #Using the tcp module
    static_configs:
      - targets: ['10.10.1.35:8068','10.10.1.35:8069']  #Corresponding host interface
        labels:
          instance: 'port_status'
          group: 'tcp'
    relabel_configs:
    - source_labels: [__address__]
      target_label: __param_target
    - target_label: __address__
      replacement: 192.168.1.14:9115
2, Chart:
The diagram can be integrated into the previous grafana 9965 template:
Definition of alarm rules:
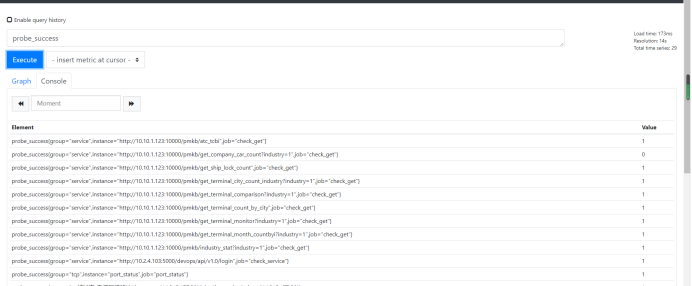
1, Business normality:
Whether icmp, tcp, http and post monitoring are normal can observe the indicator of probe success
Probe? Success = = 0? Connectivity exception
Probe? Success = = 1? Normal connectivity
Alarm also determines whether this indicator is equal to 0. If it is equal to 0, an abnormal alarm will be triggered
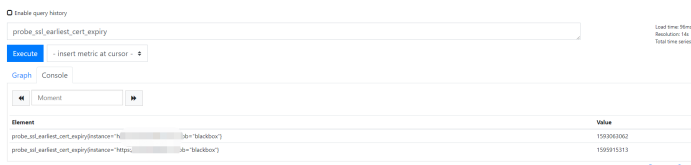
2, Through the http module, we can get the expiration time of the certificate, and add related alarms according to the expiration time
Probe? SSL? Earliest? Cert? Expiry: you can query the certificate expiration time.
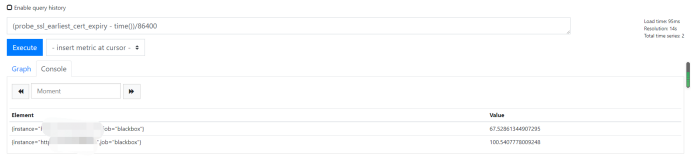
#After unit conversion, we can get the following results in days: (probe? SSL? Earthiest? Cert? Expiry - time()) / 86400
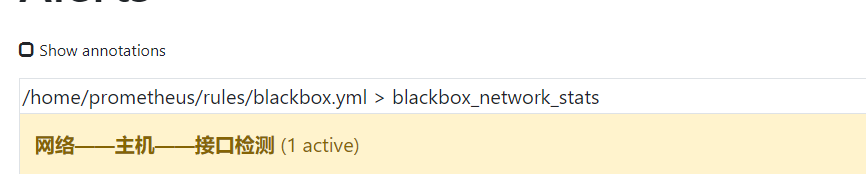
3, So we can customize the following alarm rules in combination with the above configuration
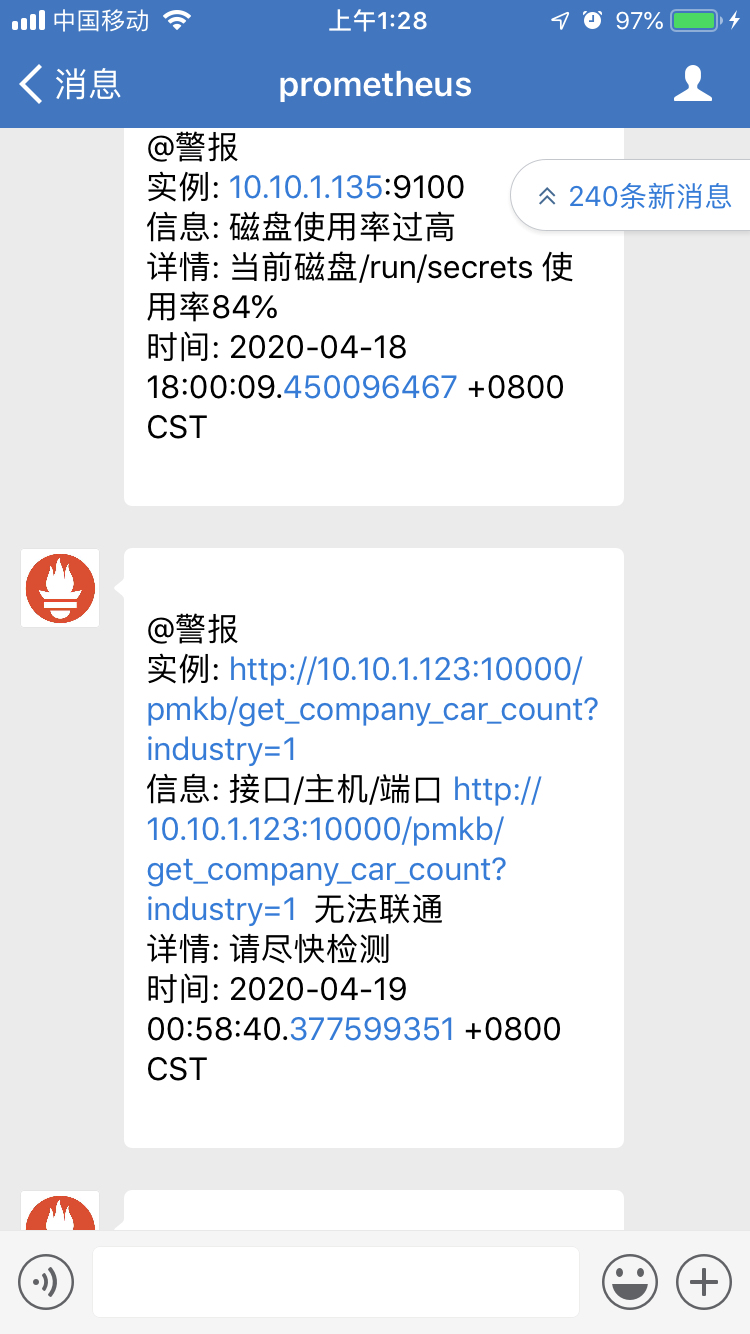
[root@cinder1 rules]# cat blackbox.yml
groups:
- name: blackbox_network_stats
  rules:
  - alert: blackbox_network_stats
    expr: probe_success == 0
    for: 1m
    labels:
      severity: critical
    annotations:
      summary: "Interface/Host/port {{ $labels.instance }}  Unable to connect"
      description: "Please check as soon as possible"
##ssl detection
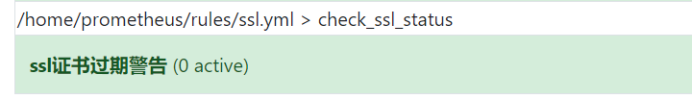
[root@cinder1 rules]# cat ssl.yml
groups:
- name: check_ssl_status
  rules:
  - alert: "ssl Certificate expiration warning"
    expr: (probe_ssl_earliest_cert_expiry - time())/86400 <30
    for: 1h
    labels:
      severity: warn
    annotations:
      description: 'domain name{{$labels.instance}}And{{ printf "%.1f" $value }}Days are overdue,Please update the certificate as soon as possible'
      summary: "ssl Certificate expiration warning"
4, After the restart, we can log in to the web interface to check:
5, We found that there was a problem with an interface. At this time, we also received a corresponding wechat Alert: what are the good infertility hospitals in Zhengzhou: http://www.xasgnk.com/
Summary:
The biggest difference between black box monitoring and white box monitoring is that black box monitoring is fault oriented. When a fault occurs, black box monitoring can quickly find the fault, so we monitor with finer granularity, such as port, interface, line, etc. Through Prometheus Blackbox Exporter, we can quickly implement and customize many of our relevant strategies. You can test them according to the above process.
Which infertility hospital in Zhengzhou is better: http://jbk.39.net/yiyunfengcai/tsyl_zztjyy/1451/