The second week, today we will talk about the use of Logstash.
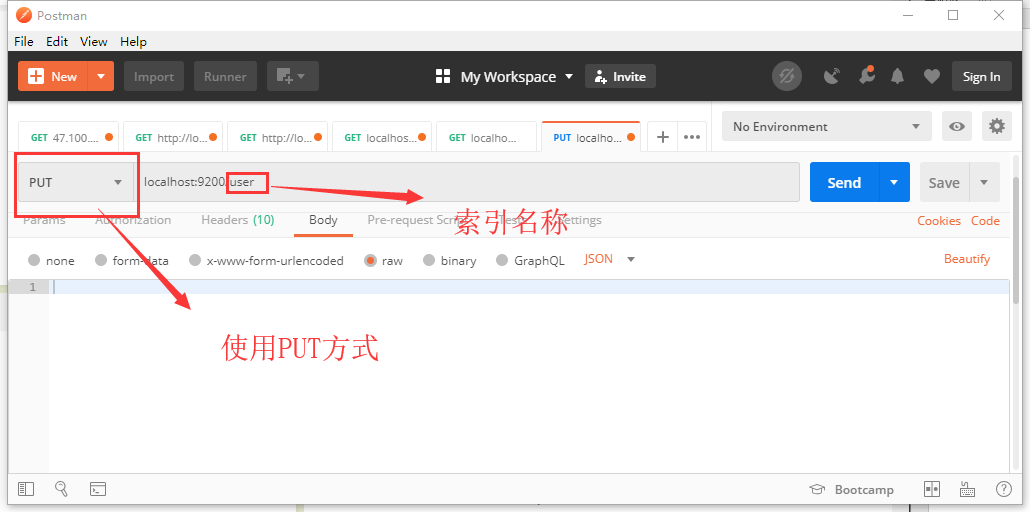
First, we open ES, use postman to create a new index user, and use PUT mode in postman to send requests to localhost:9200/user. See the return information:
{
    "acknowledged": true,
    "shards_acknowledged": true,
    "index": "user"
}
This indicates that the index was established successfully. If not, it may be because ES did not turn on automatic index creation. Modify the configuration in config/elasticsearch.yml, and set action.auto'create'index to true. Do the above again.
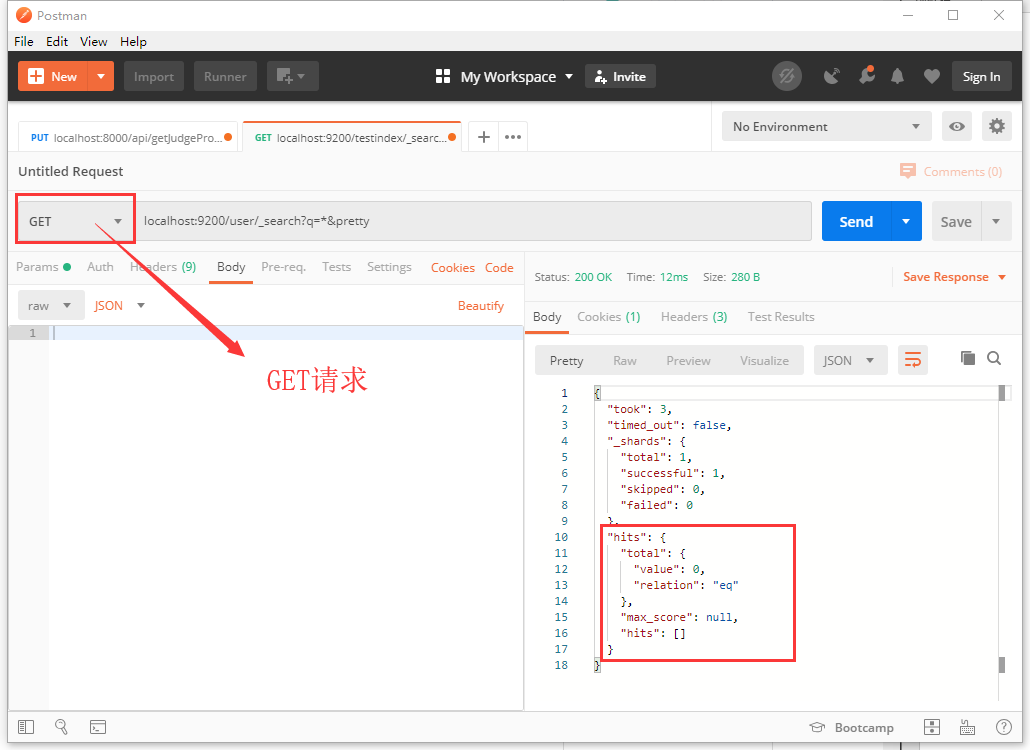
At this time, let's look at the data in the user index. In postman, use the get method to send localhost: 9200 / user / _search? Q = * & pretty to view all the data under the user index. As you can see, under the user index, there is no data.
The table structure we want to read is:
CREATE TABLE `user` (

  `id` int(11) NOT NULL AUTO_INCREMENT,

  `account` varchar(40) DEFAULT NULL,

  `password` varchar(40) DEFAULT NULL,

  `name` varchar(20) DEFAULT NULL,

  `sex` varchar(15) DEFAULT NULL,

  `head_src` varchar(40) DEFAULT NULL,

  `question` int(11) DEFAULT NULL,

  `answer` varchar(100) DEFAULT NULL,

  `signature` varchar(40) DEFAULT NULL,

  `grade` int(11) DEFAULT NULL,

  `code` varchar(100) NOT NULL,

  `state` tinyint(1) unsigned zerofill NOT NULL,

  `permission` tinyint(1) DEFAULT NULL,

  `date` date DEFAULT NULL,

  PRIMARY KEY (`id`),

  UNIQUE KEY `account` (`account`)

) ENGINE=InnoDB AUTO_INCREMENT=13 DEFAULT CHARSET=utf8 STATS_PERSISTENT=1;
(there are no tables or notes in the system made by myself in the University, and the technology is not qualified.)
Next, we enter the Logstash folder, create a new connection jar folder, and put the mysql connection jar package in this folder. You can go to the next one in the Maven warehouse, and I won't put the link here.
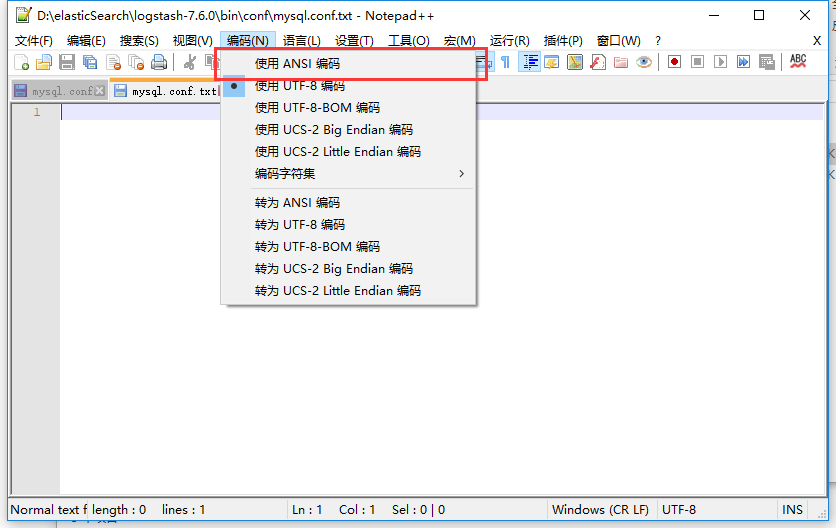
Then we open the bin folder under the Logstash root directory and create the conf folder. In this folder, we create the mysql.conf file. Open the conf file and set the file code to ANSI (very important!! Very important!! Very important!!).
The content of the configuration file can be written as follows:
input {

    # Standard input form, temporarily unavailable

    stdin {

    }

    # JDBC settings

    jdbc {

    # Database connection

    jdbc_connection_string => "jdbc:mysql://localhost:3306/retina"

    jdbc_user => "root"

    jdbc_password => "123456"

    # Jar package location

    jdbc_driver_library => "D:\elasticSearch\logstash-7.6.0\ConnectionJar\mysql-connector-java-5.1.40-bin.jar"

    jdbc_driver_class => "com.mysql.jdbc.Driver"


    # Use column data or not

    use_column_value => true

    # The traced column and use column value must be used at the same time

    tracking_column => id

    # Whether to turn on recording the last running data

    record_last_run => true

    # Storage location of recorded data

    last_run_metadata_path=>"D:\elasticSearch\logstash-7.6.0\bin\conf\station_parameter.txt"

    # Open paging or not

    jdbc_paging_enabled => "true"

    # Paging data size

    jdbc_page_size => "50000"

    # SQL statement, you can also use the following file form

    # statement_filepath => "D:\elasticSearch\logstash-7.6.0\bin\conf\information.sql"

    statement => "select * from user where id > :sql_last_value "

    # The timing of execution is mentioned in my blog: https://my.oschina.net/u/4109273/blog/3042086

    schedule => "* * * * *"

    # Name of index

    type => "user"

  }

}

# Interceptor settings, which are not used in this article, will not be explained

filter {}


# Output configuration

output {

    elasticsearch {

       # Address of ES

       hosts => "localhost:9200"

       # Index used

       index => "user"

       # ID column used by the document

       document_id => "%{id}"

    }

}
But! You can't use the above configuration, it will report an error, because Chinese can't appear in the file, so we need to delete all the comments!
But! You can't use the above configuration, it will report an error, because Chinese can't appear in the file, so we need to delete all the comments!
But! You can't use the above configuration, it will report an error, because Chinese can't appear in the file, so we need to delete all the comments! (I write the available configuration information at the end)
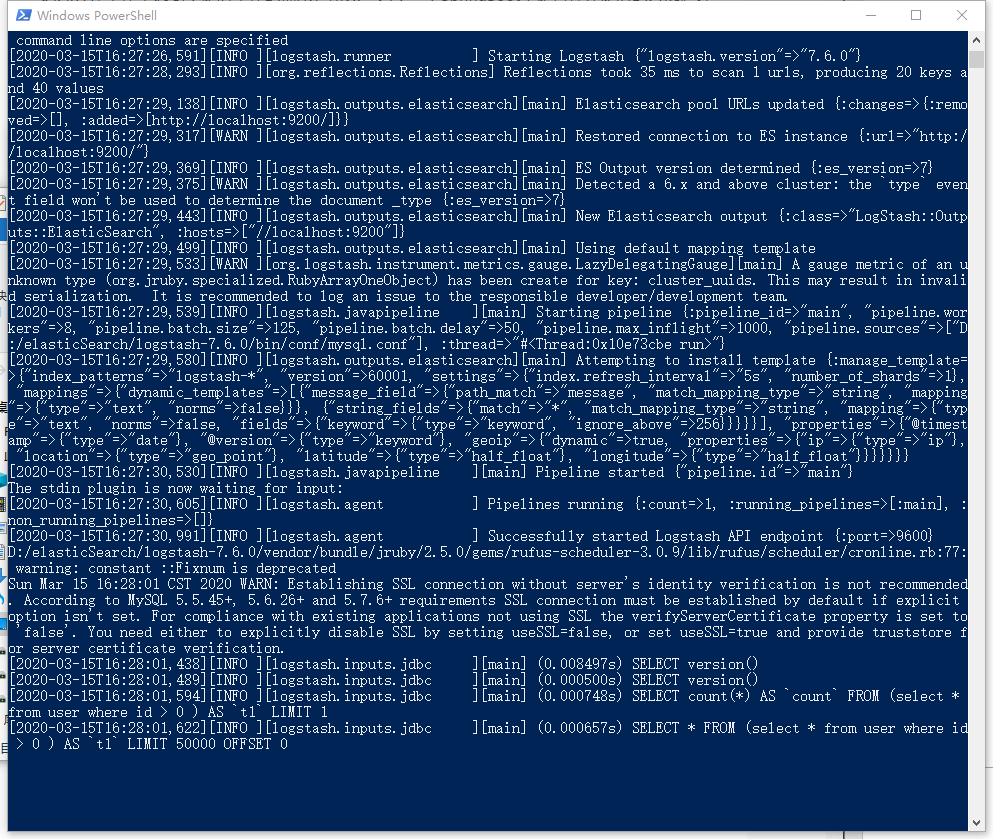
Then we open cmd in the bin file and run the command. \ Logstash - F. \ conf \ mysql.conf. Seeing such a screenshot shows that Logstash is already processing data.
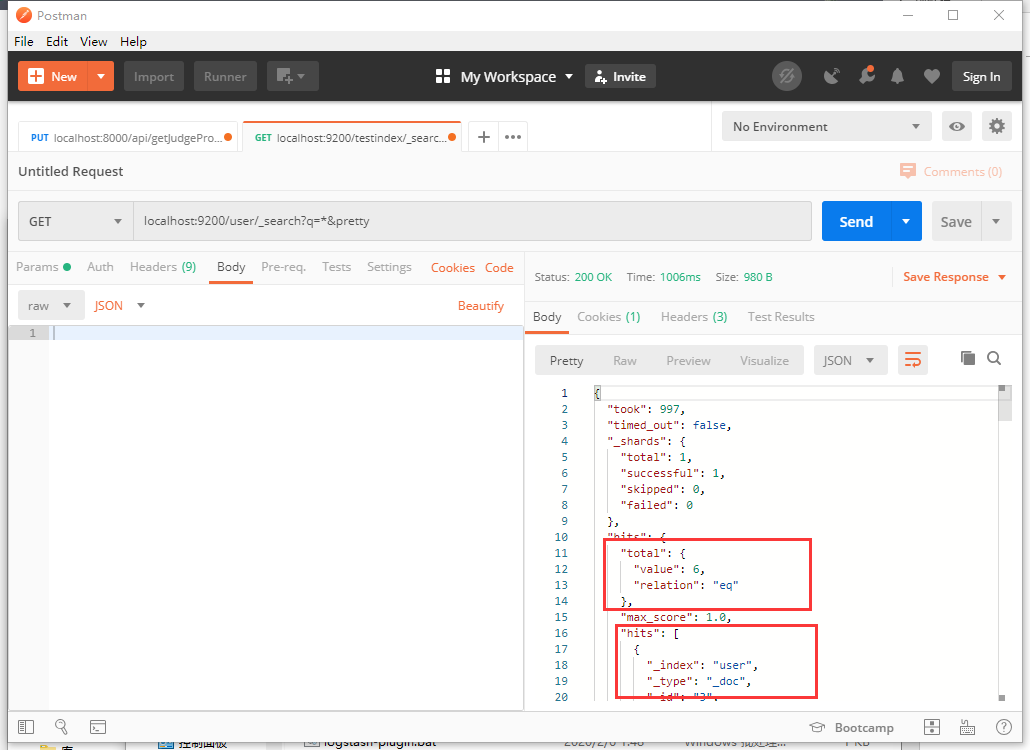
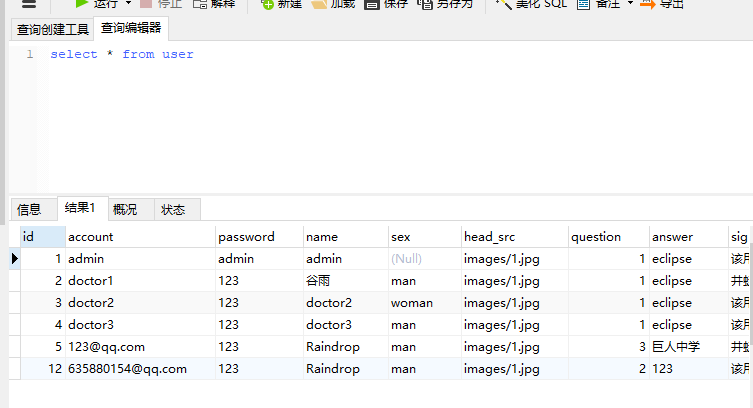
Then we look at the data under the user index. We can see that the data has been written. Then we compare the data in the user table. We can see that all the user data has been written to ES. At this point, the basic use of logstash is ready.
Configuration information:
input {

    stdin {

    }

    jdbc {

    jdbc_connection_string => "jdbc:mysql://localhost:3306/retina"

    jdbc_user => "root"

    jdbc_password => "123456"

    jdbc_driver_library => "D:\elasticSearch\logstash-7.6.0\JDBC\mysql-connector-java-5.1.40-bin.jar"

    jdbc_driver_class => "com.mysql.jdbc.Driver"


    use_column_value => true

    tracking_column => id

    record_last_run => true

    last_run_metadata_path=>"D:\elasticSearch\logstash-7.6.0\bin\conf\station_parameter.txt"

    jdbc_paging_enabled => "true"

    jdbc_page_size => "50000"

    statement => "select * from user where id > :sql_last_value "

    schedule => "* * * * *"

    type => "user"

  }

}

filter {}


output {

    elasticsearch {

       hosts => "localhost:9200"

       index => "user"

       document_id => "%{id}"

    }

}