Basic tutorial of Xamarin chart development (8) OxyPlot framework
[example OxyPlotFormsDemo] display the line graph in Xamarin.Forms.
(1) open the Xamarin.Forms project.
(2) add the OxyPlot.Xamarin.Forms component to the introduction of each subproject.
(3) open the MainActivity.cs file of the subproject OxyPlotFormsDemo.Android, and initialize the OxyPlot renderer. The code is as follows:
using System;

using Android.App;

using Android.Content.PM;

using Android.Runtime;

using Android.Views;

using Android.Widget;

using Android.OS;

namespace OxyPlotFormsDemo.Droid

{

    [Activity(Label = "OxyPlotFormsDemo", Icon = "@mipmap/icon", Theme = "@style/MainTheme", MainLauncher = true, ConfigurationChanges = ConfigChanges.ScreenSize | ConfigChanges.Orientation)]

    public class MainActivity : global::Xamarin.Forms.Platform.Android.FormsAppCompatActivity

    {

        protected override void OnCreate(Bundle savedInstanceState)

        {

            TabLayoutResource = Resource.Layout.Tabbar;

            ToolbarResource = Resource.Layout.Toolbar;

            base.OnCreate(savedInstanceState);

            Xamarin.Essentials.Platform.Init(this, savedInstanceState);

            global::Xamarin.Forms.Forms.Init(this, savedInstanceState);

            OxyPlot.Xamarin.Forms.Platform.Android.PlotViewRenderer.Init();

            LoadApplication(new App());

        }

    }

}
(4) open the AppDelegate.cs file of the OxyPlotFormsDemo.iOS sub project, and initialize the OxyPlot renderer. The code is as follows:
using System;

using System.Collections.Generic;

using System.Linq;

using Foundation;

using UIKit;

namespace OxyPlotFormsDemo.iOS

{

    [Register("AppDelegate")]

    public partial class AppDelegate : global::Xamarin.Forms.Platform.iOS.FormsApplicationDelegate

    {

        public override bool FinishedLaunching(UIApplication app, NSDictionary options)

        {

            global::Xamarin.Forms.Forms.Init();

            OxyPlot.Xamarin.Forms.Platform.iOS.PlotViewRenderer.Init();

            LoadApplication(new App());

            return base.FinishedLaunching(app, options);

        }

    }

}
(5) open the App.xaml.cs file and complete the remaining steps, that is, create the PlotView, draw the chart, set the display mode, etc. The code is as follows:
using OxyPlot;

using OxyPlot.Axes;

using OxyPlot.Series;

using OxyPlot.Xamarin.Forms;

using System;

using Xamarin.Forms;

using Xamarin.Forms.Xaml;

namespace OxyPlotFormsDemo

{

    public partial class App : Application

    {

        public App()

        {

            MainPage = new ContentPage

            {

                //Create and set the contents of the main page to PlotView

                Content = new PlotView

                {

                    Model = CreatePlotModel(),

                    VerticalOptions = LayoutOptions.Fill,

                    HorizontalOptions = LayoutOptions.Fill,

                }

            };

        }

        //Drawing charts

        private PlotModel CreatePlotModel()

        {

            //Create chart mode

            var plotModel = new PlotModel

            {

                Title = "OxyPlot Demo"

            };

            //Add axis

            plotModel.Axes.Add(new LinearAxis { Position = AxisPosition.Bottom });

            plotModel.Axes.Add(new LinearAxis { Position = AxisPosition.Left, Maximum = 10, Minimum = 0 });

            //Create data column

            var series1 = new LineSeries

            {

                Title = "Data",

                MarkerType = MarkerType.Circle,

                MarkerSize = 4,

                MarkerStroke = OxyColors.White

            };

            //Add data point

            series1.Points.Add(new DataPoint(0.0, 6.0));

            series1.Points.Add(new DataPoint(1.4, 2.1));

            series1.Points.Add(new DataPoint(2.0, 4.2));

            series1.Points.Add(new DataPoint(3.3, 2.3));

            series1.Points.Add(new DataPoint(4.7, 7.4));

            series1.Points.Add(new DataPoint(6.0, 6.2));

            series1.Points.Add(new DataPoint(8.9, 8.9));

            //Add data column

            plotModel.Series.Add(series1);

            return plotModel;

        }

        ......

    }

}
Run the program and you will see the effect shown in Figure 1.3.
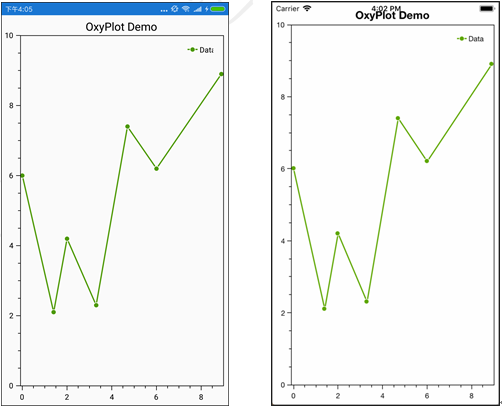
Figure 1.3 Android effect and iOS effect