Preface
Through the combination of HTML5 and OpenLayers, a very good application of telecommunication map network topology can be formed. The result can be used as a telecommunication resource management system, food location sharing software, area room search, railway line drawing and so on. It is an application that can be involved in all fields. Although this Demo is combined with OpenLayers 3, it can also be extended to integrate with many GIS map engines such as ArcGIS, Baidu Map and Google Map.
http://www.hightopo.com/demo/openlayers/
code generation
Create map
OpenLayers is a JavaScript package for developing WebGIS clients. OpenLayers supports many offline online maps, such as Google Maps, Yahoo, Map, Microsoft Virtual Earth, etc. The popular Google Map online maps are used here. Before using OpenLayers, only relevant class libraries and css files need to be introduced.
<link rel="stylesheet" href="css/ol.css" type="text/css">
<script src="lib/ol.js"></script>
The operation of initializing map is to put Map into a div element and initialize an ol.Map map class, which is essential in the whole telecommunication resource management system, and then set the parameters of this class:
var mapDiv = document.getElementById('mapDiv');
map = new ol.Map({
    target: 'mapDiv',// Map container
    controls: ol.control.defaults().extend([
        graphViewControl,// Custom Topology Control
        new ol.control.OverviewMap(),// Map Global View Control
        new ol.control.ScaleLine(),// Scale bar control
        new ol.control.ZoomSlider(),// Scale scale control
        new ol.control.ZoomToExtent()// Zoom in to global controls
    ]),
    layers: [// layer
        new ol.layer.Tile({
            source: new ol.source.XYZ({// Google Maps
                url:'http://www.google.cn/maps/vt/pb=!1m4!1m3!1i{z}!2i{x}!3i{y}!2m3!1e0!2sm!3i345013117!3m8!2szh-CN!3scn!5e1105!12m4!1e68!2m2!1sset!2sRoadmap!4e0'
            })
        })
    ],
    view: new ol.View({// Map view
        projection: 'EPSG:3857',// Projection
        center: ol.proj.fromLonLat([106, 35]),// The coordinate system of the initial center of the view is specified by the project option
        zoom: 4// Scaling levels are used to calculate the initial resolution of views
    })
});
The above code should be easy to interpret based on the code comments on each line plus the official API. Careful friends may have noticed an unofficial control: the graphViewControl control, which I customized to draw the topology on this control. The declarations and definitions are in the GraphViewControl.js file.
Custom control
Customizing OpenLayers controls is simply inheriting a class from the ol.control.Control class, and then rewriting parent methods or adding methods for different needs.
When I declare a class, I pass an option parameter, which sets the container element of the control when defining the class and renders the control outside the view port of the GIS map:
var view = graphView.getView();// Getting the div of the topological component
ol.control.Control.call(this, {
element: view,// Container elements of controls
target: options.target// Render controls out of the map's view
});
The graphView above is a new method added to the parent method by GraphViewControl and initialized to ht.graph.GraphView, HT's topological graphics component:
// Get the GraphView object
GraphViewControl.prototype.getGraphView = function() { return this._graphView; };
var graphView = this._graphView = new ht.graph.GraphView();// Topographic Component
I also added some event monitoring to the graphView topology component in the control. Because OpenLayers and HT are two different js libraries, they have their own interaction system and coordinate system. First, we will get some interactive events we need to do on HT and stop the event propagating to OpenLayers:
// Do not move the map when dragging node
var stopGraphPropagation = function(e) {
    var data = graphView.getDataAt(e);// Get the node under the graphView event
    var interaction = graphView.getEditInteractor();// Getting Editor Interactive
    if (data || e.metaKey || e.ctrlKey || interaction && interaction.gvEditing) {
        e.stopPropagation();// No more event dispatch This method stops event propagation and prevents it from being dispatched to other Document nodes
    }
}

/** pointerdown When the pointer becomes an active event
*    For a mouse, it is triggered when the device is switched from a pressed button to at least one pressed button.
*    For touch, it is triggered when it is physically contacted with the digitizer.
*    For a pen, it is triggered when the stylus is physically contacted with the digitizer.
**/
view.addEventListener('pointerdown', stopGraphPropagation, false);
view.addEventListener('touchstart', stopGraphPropagation, false);// Events when the touch point is placed on the touch panel
view.addEventListener('mousedown', stopGraphPropagation, false);// Mouse Down Event
The GraphViewControl class definition section also adds some interactive events about mobile and editing nodes, mainly converting the pixel coordinates of nodes into the coordinates in the ol.Cordinate map view projection of OpenLayers and storing them in the business attributes of nodes (an object that can store any value in HT), so we only need to obtain or set the business attributes coo of nodes. Rd. The pixel coordinates of the nodes on the map can be freely acquired and set.
var position = data.getPosition(),// Get the coordinates of the selected node
    x = position.x + graphView.tx(),// Horizontal translation value of node abscissa + graphView
    y = position.y + graphView.ty();// Vertical translation value of node ordinates + graphView

var coord = map.getCoordinateFromPixel([x, y]);// Getting coordinates in map view projection according to coordinate pixels
data.a('coord', coord);
Here I will mention some basic functions, the others will not be explained, just some extensions.
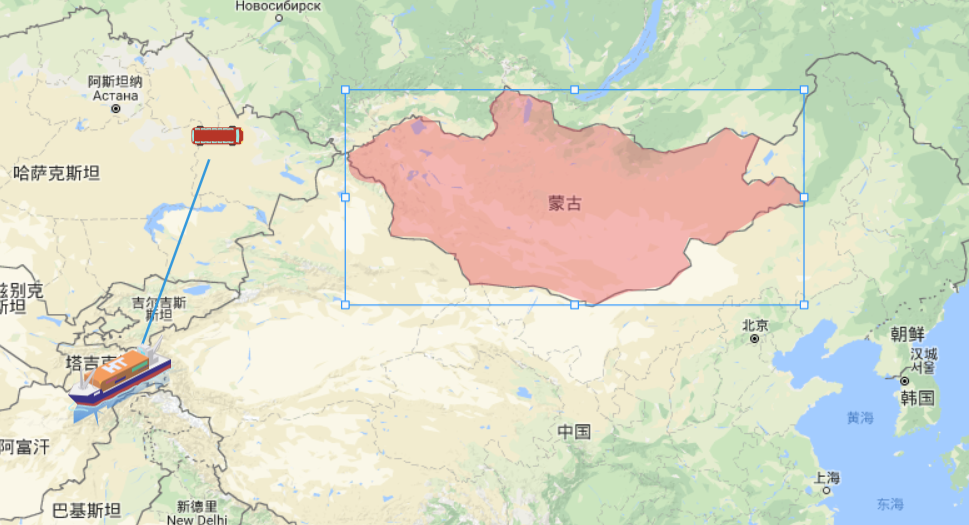
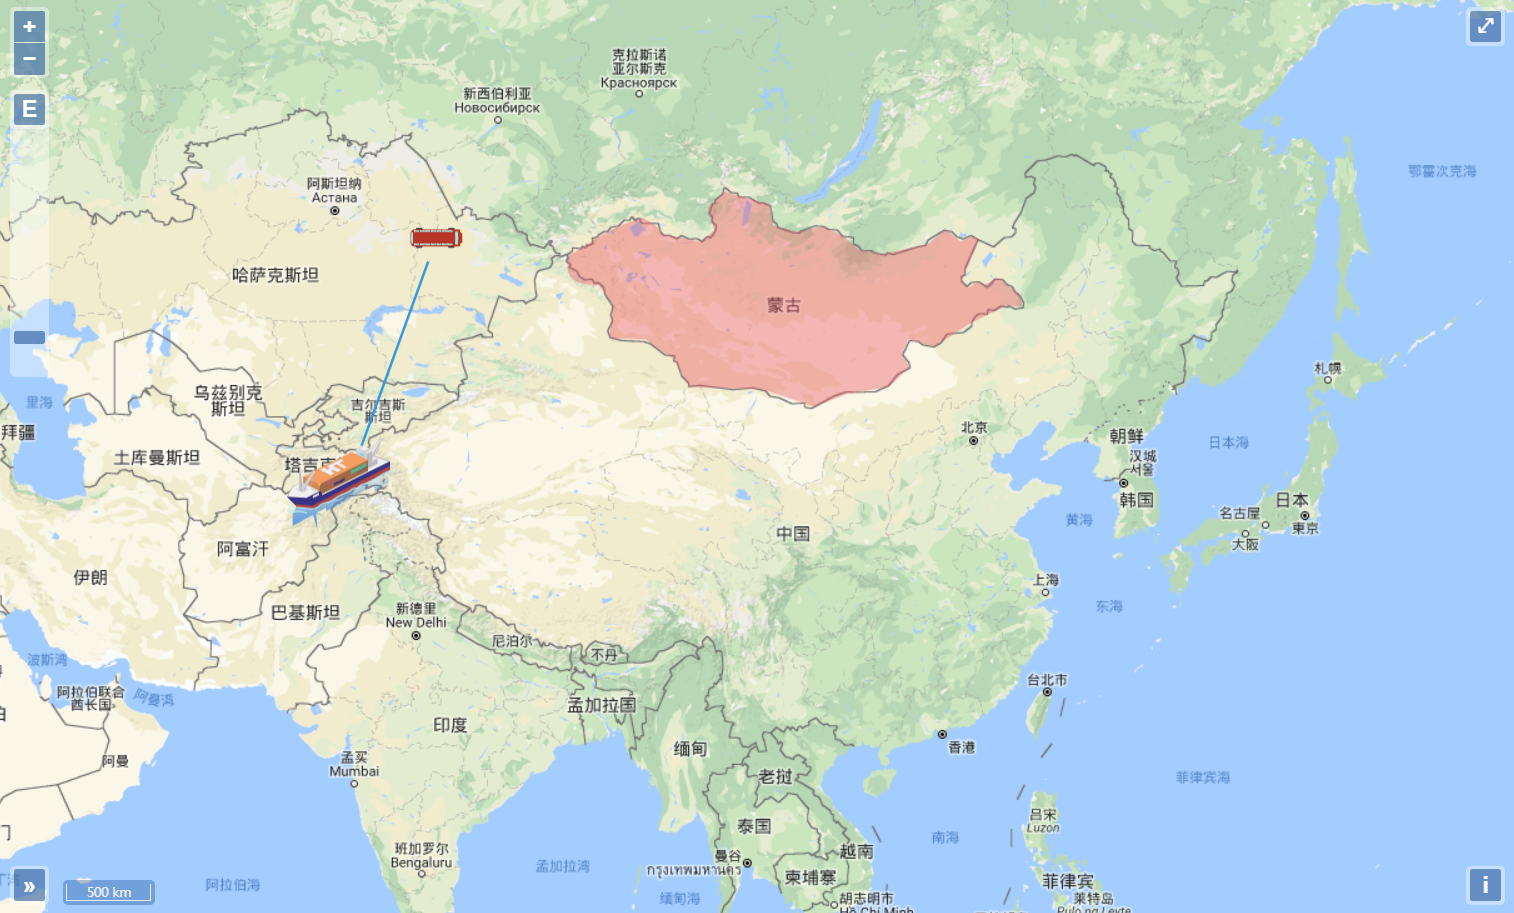
It is worth noting that we store the coordinates of nodes in the projection of map view of telecommunication GIS above, but this method is not suitable for Shape-type nodes, because the map is usually surrounded by points to draw the outline of a country or a city. When zooming, it does not keep the size in real time, but according to the map. To zoom and zoom in real-time, I traversed all the points in the Shape-type nodes and set the business attribute pointCoord to get the coordinates in the map view projection:
// Each point position of a shape-type node is set to latitude and longitude
if (e.kind === 'endEditPoint' || e.kind === 'endEditPoints' || e.kind === 'endEditResize' || e.kind === 'endMove') {
    if (data instanceof ht.Shape) {// Shape-type nodes
        data.getPoints().forEach(function(point, index) {
            var pointCoord = map.getCoordinateFromPixel([point.x, point.y]);// Getting coordinates of a given pixel
            data.a('pointCoord['+index+']', pointCoord);
        });
    }
}
Layer overlay
The structure of OpenLayers is relatively complex, while HT is relatively simple, so I superimpose HT into the viewport of OpenLayers Map. Here I overload the setMap method of the parent class ol.control.Control in the subclass GraphViewControl. In this method, the HT topology component graphView is added to the OpenLayers view port. We know that HT components are generally absolutely positioned, so we need to set the position and width attributes in the css:
var graphView = self._graphView;// = GraphViewControl.getGraphView()
var view = graphView.getView();// Get the div of the graphView component
var dataModel = graphView.getDataModel();// Get the data container for graphView
view.style.top = '0';
view.style.left = '0';
view.style.width = '100%';
view.style.height = '100%';

map.getViewport().insertBefore(view, map.getViewport().firstChild);// getViewPort gets the element insertBefore used as the map viewport to insert a new child node (parameter 1) before the specified existing child node (parameter 2)
By monitoring the type of node currently joined in the data container, the pixel coordinates of the current node are transformed into coordinates in the map view projection and stored on the business attribute coord of the node.
dataModel.addDataModelChangeListener(function(e) {// Data Container Add, Delete, Check, Change Monitor
    if (e.kind === 'add' && !(e.data instanceof ht.Edge)) {// Add Events & Event Objects are not ht.Edge Types
        if (e.data instanceof ht.Node) {
            var position = e.data.getPosition();
            var coordPosition = map.getCoordinateFromPixel([position.x, position.y]);// Getting coordinates of a given pixel
            e.data.a('coord', coordPosition);
        }

        if (e.data instanceof ht.Shape) {// Set latitude and longitude for each point on a shape-type node
            e.data.getPoints().forEach(function(point, index) {// For shape-type nodes, all coordinates are converted to latitude and longitude.
                var pointCoord = map.getCoordinateFromPixel([point.x, point.y]);// Getting coordinates of a given pixel
                e.data.a('pointCoord['+index+']', pointCoord);
            });
        }
    }
});
Finally, monitor the map update events and reset the topology:
map.on('postrender', function() { self.resetGraphView(); });
coordinate transformation
Resetting the topology here means that the coordinates of nodes in the topology map are set to the nodes from the pixel coordinates we set in HT at the beginning by zooming or moving the map view projection coordinates to the pixel coordinates. At this time, the business attribute coord stored in front of us is useful. Remember, Shape type nodes are exceptional, or should they be set to the nodes. The coordinates of each point are reset:
GraphViewControl.prototype.resetGraphView = function() {// Reset the status of the graphView component
    var graphView = this._graphView;
    graphView.tx(0);// grpahView horizontal translation value
    graphView.ty(0);// GraView vertical translation value

    graphView.dm().each(function(data) {// Traversing the data container in graphView
        var coord = data.a('coord');// Get the business attribute coord of the node
        if (coord) {
            var position = map.getPixelFromCoordinate(coord);// Gets the pixels of a given coordinate
            data.setPosition(position[0], position[1]);// Setting Pixel Coordinates for Nodes
        }
        if (data instanceof ht.Shape) {
            var points = data.toPoints();// Build a new set of Shape points and return
            data.getPoints().clear();// Clearing point set
            data._points = new ht.List();

            points.forEach(function(point, index) {// Reset the pixel coordinates of each point to shape
                point.x = map.getPixelFromCoordinate(data.a('pointCoord['+ index +']'))[0];
                point.y = map.getPixelFromCoordinate(data.a('pointCoord['+ index +']'))[1];
                data._points.add(point);
            });

            data.setPoints(data._points);
        }
    });

    graphView.validate();//Refresh Topology Components
}
Scene construction
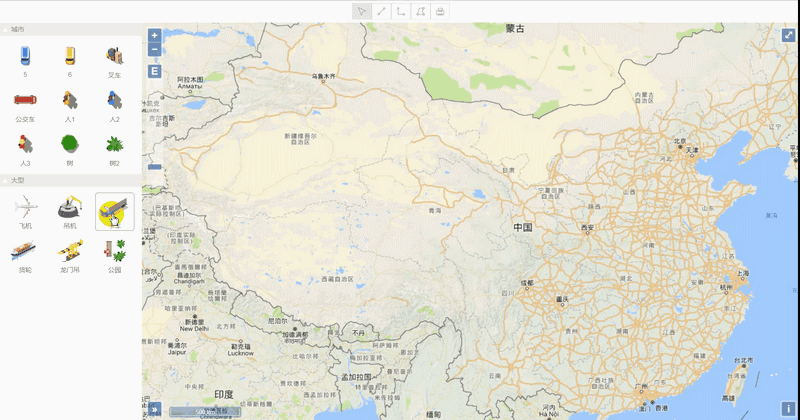
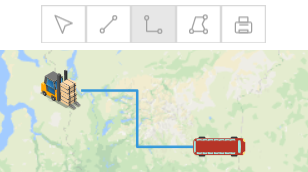
The Map part of OpenLayers is done, and then it's put into the scene. ~But as you can see from the screenshot above, besides the map, there's a toolbar at the top (but I made it with the formPane form component), and there's a drag-and-drop Palette panel component on the left, which lays out the whole scene through HT's borderPane border panel component:
raphViewControl = new GraphViewControl();// Custom controls, as custom controls on openlayers maps
graphView = graphViewControl.getGraphView();// Getting Topographic Components
dm = graphView.getDataModel();// Get the data container in the topology

palette = new ht.widget.Palette();// Create a Component Panel
formPane = createFormPane();// Form form of toolbar

borderPane = new ht.widget.BorderPane();// Border Panel Component
borderPane.setTopView(formPane);// Set the top component to formPane
borderPane.setLeftView(palette, 260);// Set the left component to palette parameter 2 to set the width of the view
borderPane.setCenterView(mapDiv);// Set the intermediate component to mapDiv

borderPane.addToDOM();// Add panel components to body
So the layout and display of the whole scene is completed, very easy.~
Toolbar
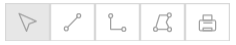
HT itself has its own toolbar, but because form forms can be more flexible in layout and style, this is adopted.
var fp = new ht.widget.FormPane();
fp.setVGap(0);// Set the default value of horizontal spacing of form components to 6
fp.setHGap(0);// Set the default value of the form's row vertical spacing to 6
fp.setHPadding(4);// Set the spacing between the left and right sides of the form and the content of the component, with a default value of 8
fp.setVPadding(4);// Set the spacing between the top and top of the form and component content, default value is 8
fp.setHeight(40);// Setting Form Height

var btBgColor = '#fff',
    btnIconColor = 'rgb(159, 159, 159)',
    btnSelectColor = 'rgb(231, 231, 231)';

fp.addRow([// Add a''at the beginning and end of each line, and the relative width is 0.1, which will center the middle part.
    '', {
        id: 'select',// ID uniquely identifies attributes that can be added to the corresponding item object through formPane.getItemById(id)
        button: {// ht.widget.Button is the button class
            background: btBgColor,// Set the background color
            icon: './symbols/icon/select.json',// Set icon
            iconColor: btnIconColor,// Setting icon color
            selectBackground: btnSelectColor,// Set the selected background color
            togglable: true,// Set whether the button is on or off
            groupId: 't',// Setting group number, togglable button belonging to the same group has mutually exclusive function
            toolTip: 'edit',// To set up text prompts, you can start and close text prompts by enableToolTip() and disableToolTip().
            onClicked: function() {// Button Click Trigger Function
                editableFunc();
            }
        }
    }, {
        id: 'pointLine',
        button: {
            background: btBgColor,
            icon: './symbols/icon/line.json',
            iconColor: btnIconColor,
            selectBackground: btnSelectColor,
            togglable: true,
            groupId: 't',
            toolTip: 'Connection',
            onClicked: function () {
                /** Combining Interactors through setInteractors
                * DefaultInteractor Achieve default double-click response of Group, Edge and SubGraph primitives, hand-grasp translation, roll zooming, keyboard response and other functions
                * TouchInteractor Implementing Touch Interaction on Mobile Devices
                * CreateEdgeInteractor Customized Line Interactor for CreateEdgeInteractor.js File
                * CreateShapeInteractor Customized Polygon Interactor for CreateShapeInteractor.js File
                **/
                graphView.setInteractors([new ht.graph.DefaultInteractor(graphView), new ht.graph.TouchInteractor(graphView, {
                    selectable: false
                }), new CreateEdgeInteractor(graphView)]);
            }
        }
    },''
], [0.1, 36, 36, 0.1]);
In the form form above, I only listed two functions, one for editing and the other for drawing wiring. formPane.addRow adds a row element with an array of elements. The element can be a component parameter information described in string, json format, html element or null empty. The second parameter is an array of width information for each element. The width value greater than 1 represents a fixed absolute value, less than or equal to 1 represents a relative value, or a combination of 80+0.3.
In order to show the part I want to display in the center of the toolbar, I set an empty space in the first and last item, which occupies a relative width of 0.1, and the proportion is the same, so the middle part will be displayed in the center.
The above code combines the interactors we need through setInteractors. Default Interactor implements the default double-click response of Group, Edge and SubGraph primitives, hand-grasp translation, wheel zooming, keyboard response and other functions; Touch Interactor implements Touch interaction on mobile devices. As for the CreateEdge Interactor at the end, it inherits from the ht.graph.Interactor Interactor to create a connection. This section is analyzed in detail here, and new interactors can be modified or customized later.
Custom Interactors
We define classes by ht.Default.def(className, superClass, methods) and declare methods and variables in methods objects.
The setUp method is called when the object is created, and some functions are set here according to the requirements. What I set is to clear all the selected nodes:
setUp: function () {// Functions called when the CreateEdgeInteractor object is created
    CreateEdgeInteractor.superClass.setUp.call(this);this._graphView.sm().cs();// Clear all selections
}
tearDown method is called at the end of the object call. What if the drawing is not finished when drawing the connection? Next drawing can't continue with the last drawing, so we have to clear the previous drawing points at the end of calling this class:
tearDown: function () {// Functions called when the CreateEdgeInteractor object ends the call
    CreateEdgeInteractor.superClass.tearDown.call(this);

    // Clear the starting point, the end point and the points in the middle of the connection
    this._source = null;
    this._target = null;
    this._logicalPoint = null;
}
With regard to mouse events and touch events, I hope that these two operations are the same, so the method of calling touch events directly in mouse events is the same.
Drawing a connection requires the left mouse button to select a node first, then drag the left mouse button to hold on, move the mouse to the end of the connection node, at this time a connection is created.
First, touch start selects a node:
handle_mousedown: function (e) {// Mouse Down Event
    this.handle_touchstart(e);
},
handle_touchstart: function (e) {// Start touch
    this._sourceNode = this.getNodeAt(e);// Get the node under the event
    if (this._sourceNode) {
        this._targetNode = null;// Initialize targetNode
        this.startDragging(e);
        this._graphView.addTopPainter(this);// Add top Painter and use Canvas's brush object to draw arbitrary shape freely. Top Painter is drawn at the top of the topology.
        this._graphView.sm().ss(this._sourceNode);// Set select
    }
},
getNodeAt: function(e){// Get the node under the event
    if (ht.Default.isLeftButton(e) && ht.Default.getTouchCount(e) === 1) {// Left mouse button pressed & Touch finger count is 1
        var data = this._graphView.getDataAt(e);// Get the node under the event

        if(data instanceof ht.Node) return data;// Nodes of type ht.Node
    }
    return null;
}
Then slide your finger to touch move:
handleWindowMouseMove: function (e) {
    this.handleWindowTouchMove(e);
},
handleWindowTouchMove: function (e) {// Finger sliding
    var graphView = this._graphView;// Topology component
    this.redraw();// If you don't redraw the rectangular area, it's easy to create dirty rectangles
    this._logicalPoint = graphView.getLogicalPoint(e);// Getting the logical coordinates of events
    this._targetNode = this.getNodeAt(e);// Get the end point of edge under the event

    if (this._targetNode) graphView.sm().ss([this._sourceNode, this._targetNode]);// Setting start and end nodes are selected
    else graphView.sm().ss([this._sourceNode]);// Select only the start node
},
redraw: function () {
    var p1 = this._sourceNode.getPosition(),// Getting the coordinates of the nodes at the beginning of the connection
        p2 = this._logicalPoint;

    if (p1 && p2) {
        var rect = ht.Default.unionPoint(p1, p2);// Combine points into rectangles
        ht.Default.grow(rect, 1);// Change the rect size and expand the extend size from top to bottom
        this._graphView.redraw(rect);// Redraw the topology. The rect parameter is all the elements in the space-time redraw topology. Otherwise, redraw the elements in the rectangular range.
    }
}
Finally touch end creates a connection:
handleWindowMouseUp: function (e) {
    this.handleWindowTouchEnd(e);
},
handleWindowTouchEnd: function (e) {
    if (this._targetNode) {
        var edge = new ht.Edge(this._sourceNode, this._targetNode);// Create a new connection node
        if (this._edgeType) edge.s('edge.type', this._edgeType);// Setting the type of connection

        this._graphView.dm().add(edge);// Add nodes to data containers
        this._graphView.sm().ss(edge);// Set up and select your current connection
    }
    editableFunc();// Select the Edit item in the toolbar after drawing
    this._graphView.removeTopPainter(this);// Remove the top brush
}
Before a connection is created (that is to say, to select the termination node), the mouse will create a connection during the drag process, which is drawn directly with canvas:
draw: function (g) {// Draw a line between the starting point and the mouse's moving position
    var p1 = this._sourceNode.getPosition(),
        p2 = this._logicalPoint;

    if(p1 && p2){
        g.lineWidth = 1;
        g.strokeStyle = '#1ABC9C';
        g.beginPath();
        g.moveTo(p1.x, p1.y);
        g.lineTo(p2.x, p2.y);
        g.stroke();
    }
}
In this way, the custom connection class ends!
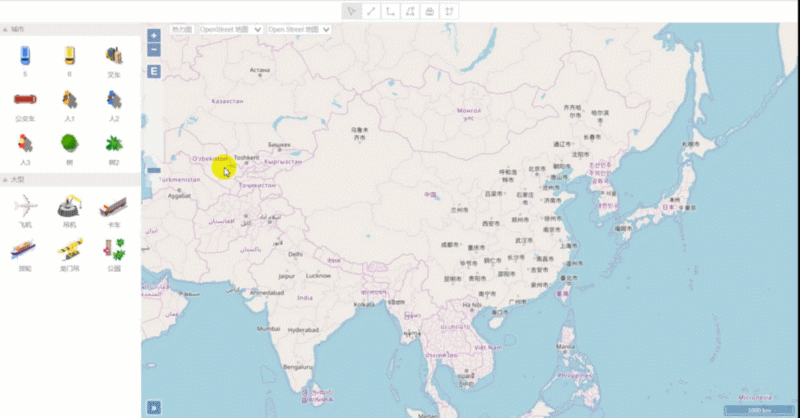
Panel module
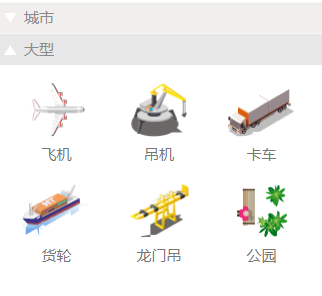
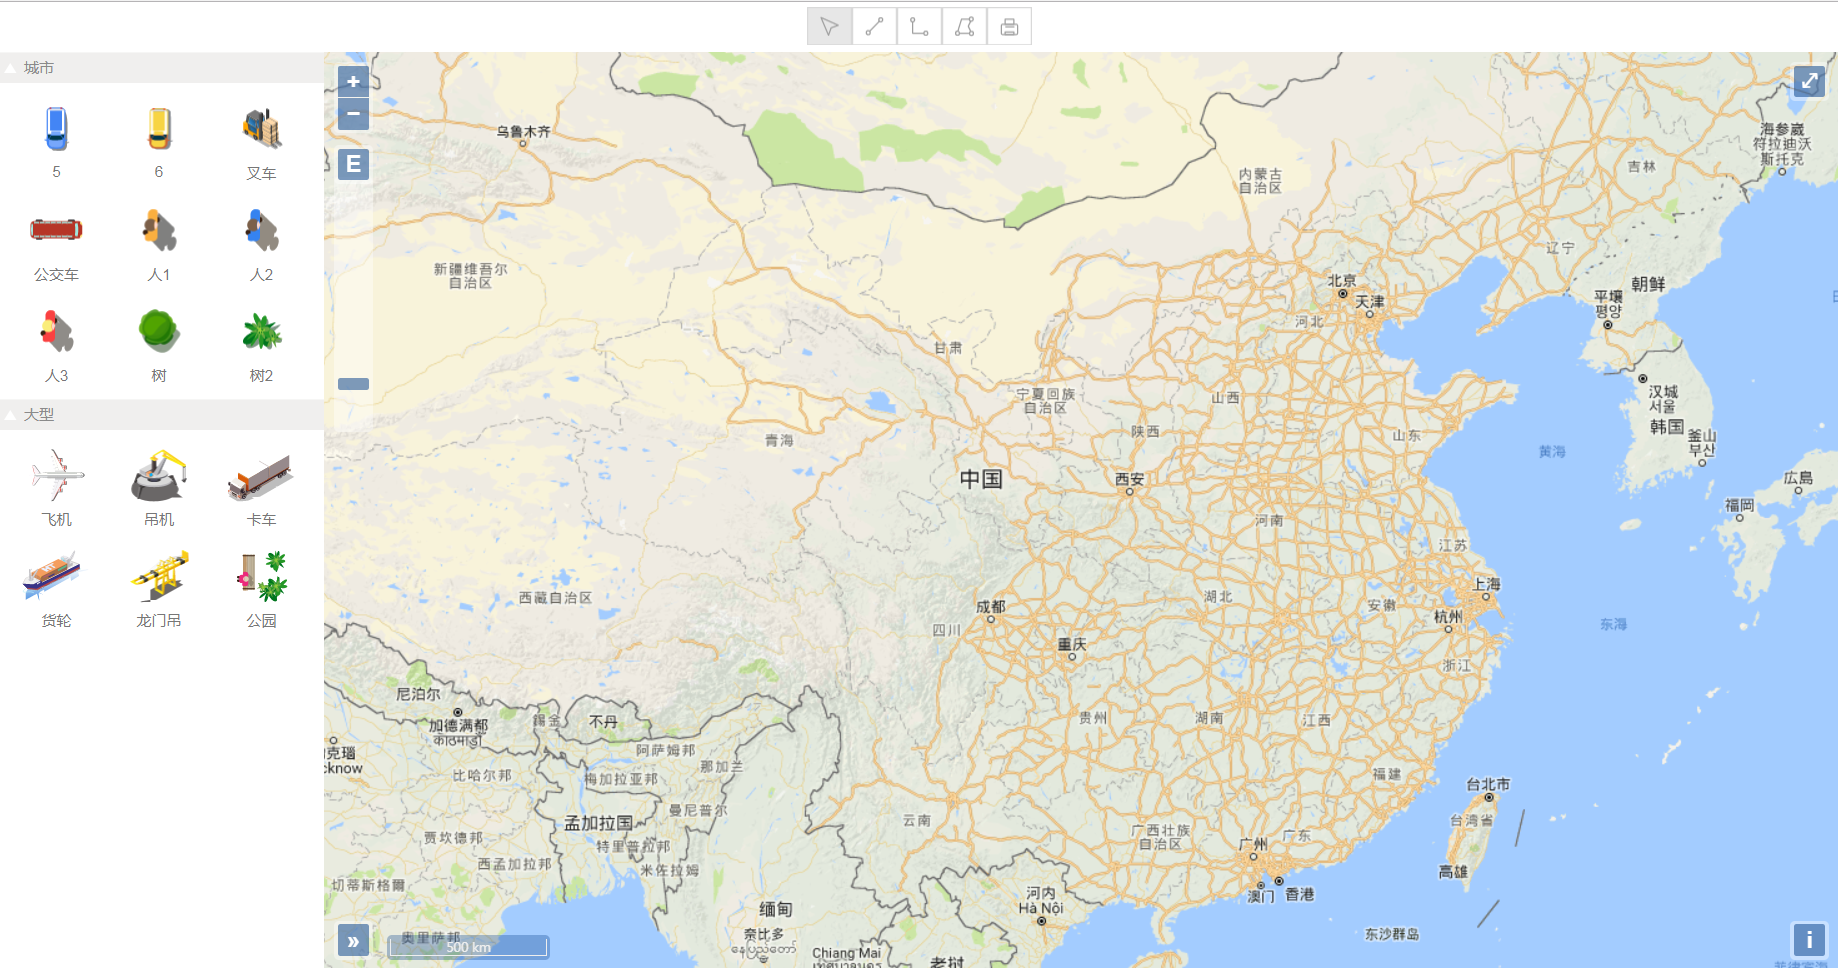
The left panel component ht.widget.Palette supports custom styles and radio and drag operations. It is driven by ht.DataModel, displaying groupings with ht.Group, and displaying button elements with ht.Node.
To show groupings, first create the button elements in groupings and groups:
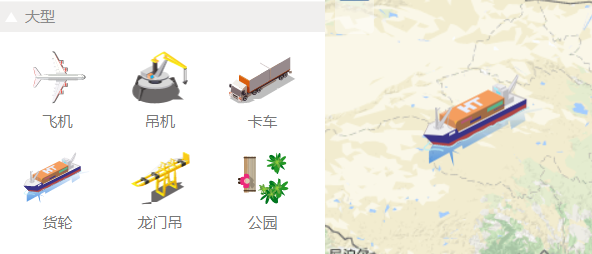
function initPalette(palette) {// Loading primitives in palette panel components
    var nodeArray = ['city', 'equipment'];
    var nameArray = ['City', 'large'];// One-to-one correspondence between index in arrNode and nameArr

    for (var i = 0; i < nodeArray.length; i++) {
        var name = nameArray[i];

        nodeArray[i] = new ht.Group();// The palette panel divides the primitives into groups, and then adds primitives to groups.
        palette.dm().add(nodeArray[i]);// Add group primitives to palette panel components
        nodeArray[i].setExpanded(true);// Set Grouping to Open State
        nodeArray[i].setName(name);// Set the name of the group

        var imageArray = [];
        switch(i){
            case 0:
                imageArray = ['symbols/5.json', 'symbols/6.json', 'symbols/Forklift.json', 'symbols/Bus.json', 'symbols/Man 1.json', 'symbols/Man 2.json', 'symbols/Man 3.json', 'symbols/tree.json', 'symbols/Tree 2.json'];
                break;
            case 1:
                imageArray = ['symbols/aircraft.json', 'symbols/Crane.json', 'symbols/Truck.json', 'symbols/Freighter.json', 'symbols/Gantry crane.json', 'symbols/Park.json'];
                break;
            default:
                break;
        }
        setPaletteNode(imageArray, nodeArray[i], palette);
    }
}

function setPaletteNode(imageArray, array, palette) {// Create node on palette and set name, display picture, parent-child relationship
    for (var i = 0; i < imageArray.length; i++) {
        var imageName = imageArray[i],
            name = imageName.slice(imageName.lastIndexOf('/')+1, imageName.lastIndexOf('.'));// Get the last / last. Intermediate text as the name of the node

        createNode(imageName, name, array, palette);// Create a node and display it on the palette panel
    }
}

function createNode(image, name, parent, palette) {// Create nodes on palette panel components
    var node = new ht.Node();
    palette.dm().add(node);// Add nodes to palette's data container
    node.setImage(image);// Set up pictures of nodes
    node.setName(name);// Setting Node Name
    node.setParent(parent);// Father Setting Node
    node.s({// Setting the properties of a node
        'draggable': true,// If Node's draggable is set to true, Palette can automatically handle dragstart, but dragover and drop events need to be handled by us.
        'image.stretch': 'centerUniform',// Pictures are rendered in a non-distorted way
    });
    return node;
}
Once created, we will enable the simulated drag event handleDrag AndDrop (e, state):
palette = new ht.widget.Palette();// Create a Component Panel

var data;
palette.handleDragAndDrop = function(e, state) {// Drag-and-drop function of left panel component
    if ( state === 'prepare' ) data = palette.getDataAt(e);
    else if( state === 'begin' || state === 'between' ) {}
    else {
        if (!ht.Default.containedInView(e, graphView)) return; // Determine whether interactive events are located on the graphView component

        var node = new ht.Node();// Drag onto the graphView to create a new node to display on the graphView
        node.setImage(data.getImage());// Setting Mapping on Nodes
        node.setName(data.getName());// Set the name (for display in the property bar)
        node.s('label', '');// The value in setName will not appear below the node in graphView, and label priority is higher than name.
        node.p(graphView.lp(e));// Set the location of the node to the logical coordinates of the topology graph under the graphView event, that is to say, set the location under the mouse point to the node coordinates.

        graphView.dm().add(node);// Add nodes to graphView
        graphView.sm().ss(node);// Select the node by default
        graphView.setFocus(node);// Settings focus on the node

        editableFunc();// Set the node to be editable and select Edit in the navigation bar
    }
}
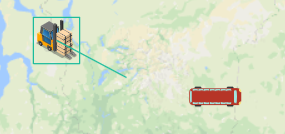
Well, first you can drag the node directly from the palette panel component on the left to the graphView topology on the map on the right.
We can edit drawing nodes, draw lines, draw right-angled lines and draw polygons on graphView.
Last
On the basis of the above GIS-based telecommunication resource management system, I tried to add the function of switching maps. At the same time, I added the "metro line map" on the navigation bar. This metro line map is also very powerful. Next time, I will give a detailed explanation of this metro line map. There will be no more explanation here to see the final results after I added it.
http://www.hightopo.com/demo/openlayers/
If you have any suggestions or comments, please leave a message or trust me personally. You can also go to HT for Web directly.( https://hightopo.com/ ) Access to relevant information on the official website.