Table of contents structure of this article
Scenario description
A product line is too laggy around January (end users 5W or so). When a customer manager feedback to a customer in the morning, the system uses a lot of cards, but there is no problem in a few minutes. The customer manager is too laggy to answer this question. 5 days later, the customer manager directly responded to the system's huge card, which was not directly available. It has been more than 20 minutes. Chrysanthemum Yijin, R & D Manager, heard the news: "how could this happen? How can I have problems sometimes and sometimes? How come there was no problem a few weeks ago and there is a problem today.
The R & D Manager contacted the O & M urgently, and checked whether it was a database problem or an application server problem. The O & M found that the database CPU was full, various threads were waiting, and the application server resources were normal, but the number of threads was particularly high. The operation and maintenance department found a slow SQL that took 35 seconds to fill the CPU of the database, and checked again and found that the slow SQL appeared more than 10 times today, and the time was very concentrated, with an interval of about 10 seconds. This slow SQL also appeared in the previous 5 days, but only once. According to this slow SQL, the R & D manager checks the SQL with the statistics function of "effective access" on the homepage, but this interface uses Redis cache.
Why does this interface use cache? Why does it connect a lot of slow SQL queries to the database? This phenomenon is
[cache breakdown] in high concurrency scenarios, concurrent threads do not get data from the cache, but all execute the process of fetching data from the DB. As a result, the cache does not work, and the cache is broken down, resulting in a great pressure on the DB, and the application above the DB is dragged to death.
Using code replication to solve the problem step by step
Repetition problem
We simulate an http interface. This interface first obtains data from the cache, and there is direct feedback on the cache data. If there is no cache data, it obtains data from the database, and then puts it into the cache and returns data. The sample code is as follows:
    /** Only use cache to get data */
    @RequestMapping("/getBookCategrouyCount/v2/useCache")
    public AjaxResponse getBookCategrouyCountUseCache(){

        /** Applicable to data acquisition by cache */
        List<BookCategrouyCount> categrouyCount = null ;
        categrouyCount = redisCache.getValue(CACHE_KEY_BOOK_CATEGROUY_COUNT,List.class);
        if(null == categrouyCount){
            //It is assumed that bookcategorycountserver. Getcategorycount(); will directly cause a slow SQL, which will cause the database CPU to soar to 50%
            categrouyCount = bookCategrouyCountServer.getCategrouyCount();
            redisCache.setValue(CACHE_KEY_BOOK_CATEGROUY_COUNT,categrouyCount,5*60);
        }
        return AjaxResponse.success(categrouyCount);
    }
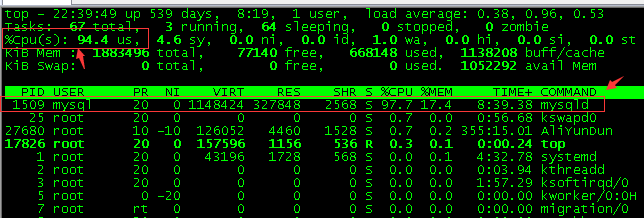
First, we call this interface once to view the CPU usage request of the database server (it takes 35 seconds):
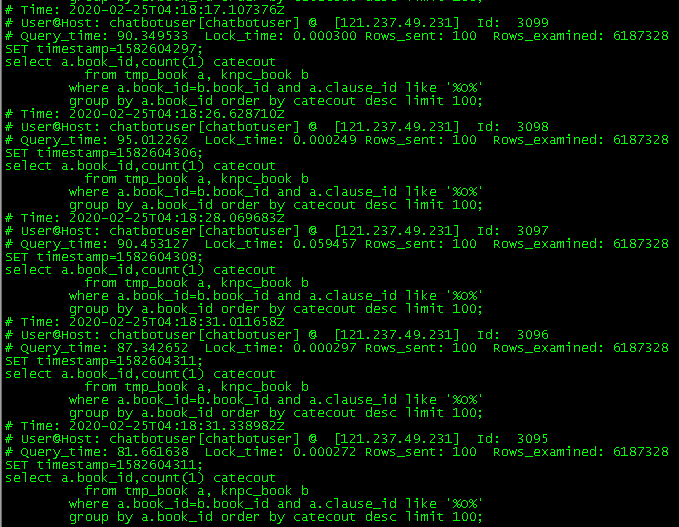
Once again, we use Jmeter to simulate 5 concurrent requests, and complete all requests (i.e. one request in 6 seconds) within 30 seconds (just within a slow SQL query time). According to the ideal expectation, we should see whether the CPU usage is about 50%, and only one more slow SQL. However, the actual CPU usage is over 90% (as shown in the figure below), and there are 5 more slow SQL databases

What's the reason? Let's analyze the code. If there are 10 interface requests between 8:30:05 and 8:30:25 at the same time, since the first interface request takes at least 35 seconds to put data into the cache after completion, all the 10 request threads will not get data from the cache, and all of them are connected to the database, which leads to service card death and cache breakdown.
In this case, some students gave a scheme to add synchronization code block, so that concurrency can be controlled, and the following code can be obtained:
    /** Using cache to get data, adding synchronization code block to get database data */
    @RequestMapping("/getBookCategrouyCount/v3/useCacheSync")
    public AjaxResponse getBookCategrouyCountUseCacheSync(){
        /** Applicable to data acquisition by cache */
        List<BookCategrouyCount> categrouyCount = null ;
        categrouyCount = redisCache.getValue(CACHE_KEY_BOOK_CATEGROUY_COUNT,List.class);
        if(null == categrouyCount){
            //Avoid cache to get no data, all of a sudden connect to the database too much pressure, increase synchronization control
            synchronized (this){
                categrouyCount = bookCategrouyCountServer.getCategrouyCount();
                redisCache.setValue(CACHE_KEY_BOOK_CATEGROUY_COUNT,categrouyCount,5*60);
            }
        }
        return AjaxResponse.success(categrouyCount);
    }
Execute the above code and find that the result is a bird like that of not adding synchronization code. What's the reason for this? It turns out that when the first thread arrives, it will execute at the query database level, and the other nine threads will be blocked by synchronized. Until the first thread finishes executing and releases the lock, the other nine threads will go to the code "categorycount = bookcategorycountserver. Getcategorycount();", which will still connect to the database level. At this time, we get a better solution. In the synchronization code block, we need to get data from the cache again and get the following code:
    /** Using cache to get data, adding synchronization code block to get database data, avoiding synchronization concurrency */
    @RequestMapping("/getBookCategrouyCount/v4/useCacheSyncDetail")
    public AjaxResponse getBookCategrouyCountUseCacheSyncDetail(){
        /** Applicable to data acquisition by cache */
        List<BookCategrouyCount> categrouyCount = null ;
        categrouyCount = redisCache.getValue(CACHE_KEY_BOOK_CATEGROUY_COUNT,List.class);
        if(null == categrouyCount){
            //Avoid cache to get no data, all of a sudden connect to the database too much pressure, increase synchronization control
            synchronized (this){
                //Get the cache data again in the synchronization code. You can use the result that the first thread is put into the cache during synchronization to avoid a large number of threads connecting to the database
                categrouyCount = redisCache.getValue(CACHE_KEY_BOOK_CATEGROUY_COUNT,List.class);
                if(null != categrouyCount){
                    return AjaxResponse.success(categrouyCount);
                }
                categrouyCount = bookCategrouyCountServer.getCategrouyCount();
                redisCache.setValue(CACHE_KEY_BOOK_CATEGROUY_COUNT,categrouyCount,5*60);
            }
        }
        return AjaxResponse.success(categrouyCount);
    }
From the results of the latest code interface, we can see that slow SQL is executed only once, and the effect is achieved.
PS: This is just an example. Of course, there are better solutions, such as caching data asynchronous thread preloading and other methods.
So far, the principle and solution of cache breakdown have been discussed. For the example project code in this article, see my Git address: https://github.com/yun19830206/javatechnicalsummary/tree/master/technology_experience / cachebreak down
Thinking about expanding problems
The example code used in the above cache is in the business code. Now the industry has a more elegant cache using architecture that does not invade the business code. See my blog Architect caching - how to make caching more elegant
There is also a "Redis hot key problem". We also make an extension:
- What is the hot key of Redis: in a Redis service, the hot key requests 10W (from 50 application servers) and the hot key, which directly causes the physical network card of the Redis machine where the hot key is located to be blocked, and finally the application is forced to use the DB mode to drag the application.
- Solution:
4.2.1: back up the hot key, so that the original key of one Redis can be converted into multiple Redis schemes.
42.2: local cache scheme. The more elegant solution is to transform Jedis, add asynchronous statistical hot key storage, and directly use local cache for subsequent hot key requests. These changes have no perception on the business side, great. (the memory cache speed of the same service is the fastest, followed by cache server and database)

