I. Introduction
The application of vector data has been done in the past, but some image processing has been done with AE during the internship of TIE 3 College. The main purpose is to obtain the elevation of the image for relevant analysis. Image service is to publish raster data and image data as services. At this time, the client can access the raster data. Examples include: viewing the band information of a grid, viewing the value of a pixel in the grid, and so on.
Imagine that the web should have similar functions, so just look for them directly and make a fuss of them.==
II. Publication of Video Services
1. Select the dataset and share as image service
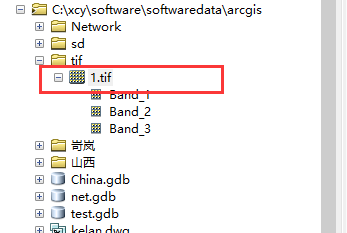
There are two things to note here: you can't publish it directly in the file-share as option, you can publish it in tree view in arcmap or arccatalog, or you can't distribute it correctly==
Also, mosaic and raster data can be released for image service.==
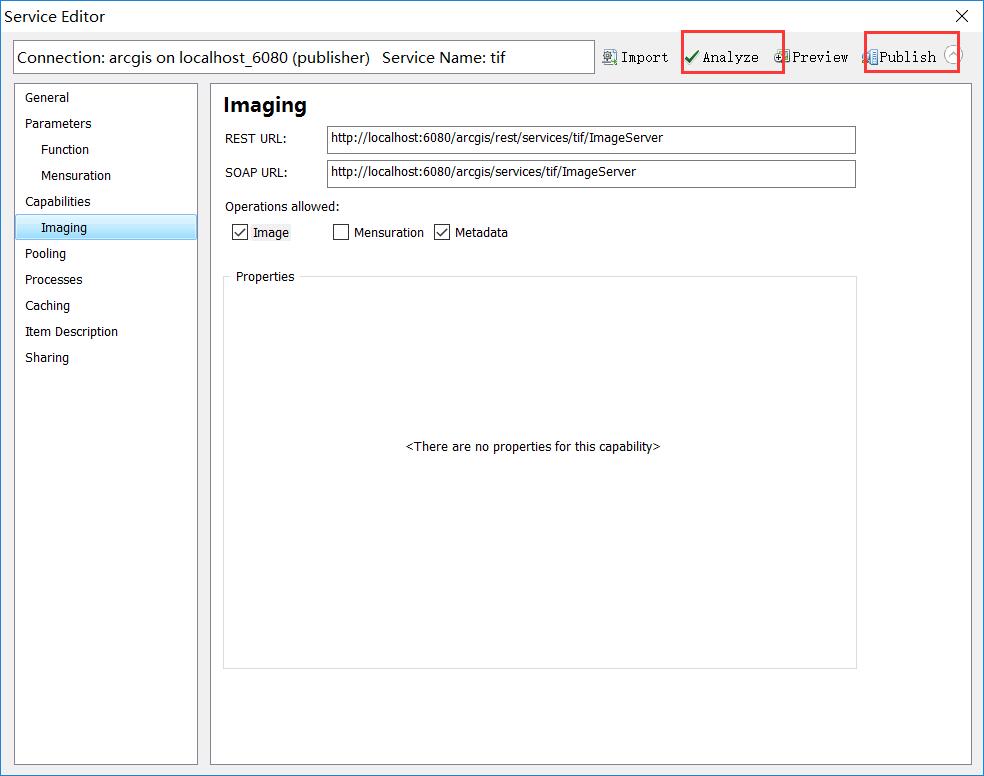
2. Publish according to the prompt process
This is very similar to the normal mapservice and started to be released.==

Select the server and service name

Analyse it and publish it directly, or you can slice it.
3. Service View

3. The Use of Image Services in Argis JS
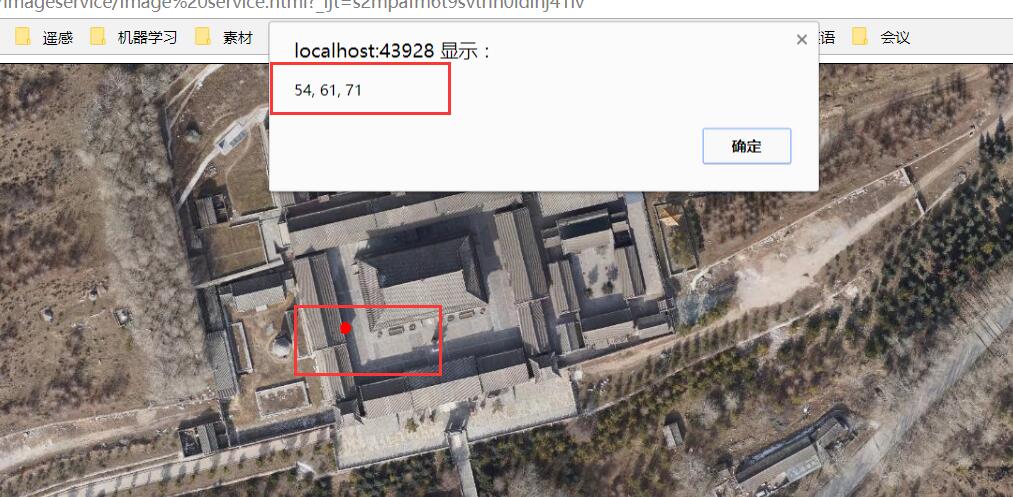
1. Demand
Getting rgb data or elevation data from image service, because the published data is color and the acquired data is rgb data.
2. Code
<!DOCTYPE html>
<html>
<head>
    <title>index.html</title>

    <meta http-equiv="keywords" content="keyword1,keyword2,keyword3">
    <meta http-equiv="description" content="this is my page">
    <meta http-equiv="content-type" content="text/html; charset=utf-8">
    <link  rel="stylesheet"  type="text/css" href="http://localhost/arcgis_js_api/library/3.17/3.17/dijit/themes/tundra/tundra.css"/>
    <link  rel="stylesheet"  type="text/css" href="http://localhost/arcgis_js_api/library/3.17/3.17/esri/css/esri.css" />
    <script  type="text/Javascript" src="http://localhost/arcgis_js_api/library/3.17/3.17/init.js"></script>
    <!--<link rel="stylesheet" type="text/css" href="./styles.css">-->
    <style>
        .MapClass{
            width:100%;
            height:500px;
            border:1px solid #000;
        }
    </style>
    <script>
        require(["esri/map","esri/layers/ArcGISImageServiceLayer","dojo/on",
            "dojo/dom","esri/toolbars/draw",
            "esri/tasks/ImageServiceIdentifyTask","esri/tasks/ImageServiceIdentifyParameters",
            "esri/symbols/SimpleLineSymbol","esri/graphic","esri/symbols/SimpleMarkerSymbol", "esri/symbols/SimpleFillSymbol",
            "esri/layers/MosaicRule",
            "dojo/domReady!"],function(Map,ArcGISImageServiceLayer,on,dom,Draw,ImageServiceIdentifyTask,
                                       ImageServiceIdentifyParameters,SimpleLineSymbol,
                                       Graphic,SimpleMarkerSymbol,SimpleFillSymbol,MosaicRule){
            var map=new Map("mapDiv");

            //Note that this is service impact.
            var layer=new ArcGISImageServiceLayer("http://localhost:6080/arcgis/rest/services/image/tif/ImageServer")
            map.addLayer(layer);
            //Used to draw points
            var toolbar =new Draw(map);

            //Creating Image Analysis Objects
            var task=new ImageServiceIdentifyTask("http://localhost:6080/arcgis/rest/services/image/tif/ImageServer");
            //Creating Image Analysis Parameter Objects
            var params=new ImageServiceIdentifyParameters();
            var lineSymbol = new SimpleLineSymbol(SimpleLineSymbol.STYLE_DASH, new dojo.Color([255, 0, 0]), 3);
            var marker= new SimpleMarkerSymbol(SimpleMarkerSymbol.STYLE_CIRCLE,10, lineSymbol, new dojo.Color([255, 0, 0]));
            var fill= new SimpleFillSymbol(SimpleFillSymbol.STYLE_SOLID, lineSymbol,  new dojo.Color([255, 0, 0]));
            //Binding events to draw polyline buttons
            on(dom.byId("drawp"),"click",function(){
                toolbar.activate(Draw.POINT, {
                    showTooltips:true
                })
            });
            //Drawing Event Binding Function for draw Tool
            on(toolbar,"draw-complete", function (result) {
                map.graphics.clear();
                var geometry=result.geometry;
                //Assignment of Geometric Attributes to Parametric Objects
                params.geometry =geometry;
                graphic= new Graphic(geometry, marker);
                map.graphics.add(graphic);
                toolbar.deactivate();

            })

            on(dom.byId("btn"),"click",function(){
                //Setting mask rules
                var mosaicRule=new MosaicRule();
                mosaicRule.ascending=false;
                mosaicRule.method=MosaicRule.METHOD_CENTER
                params.mosaicRule=mosaicRule
                params.pixelSizeX=layer.pixelSizeX;
                params.pixelSizeY=layer.pixelSizeY;
                task.execute(params,function(result){
                    //Elevation of Pop-up Change Point
                    alert(result.value)
                })
            })

        });
    </script>
</head>

<body>
<div id="mapDiv" class="MapClass"></div>
<button id="drawp">Drawing Points</button>
<button id="btn">query</button>
</body>
</html>
3. Effect
IV. SUMMARY
- Introduction to Image Services
- Video Service Publishing
- Use of Image Services