1. Question Settings
1. Data cleaning for column G is classified as None, 2000-3999, 4000-5999, 6000-7999, 8000-9999, and more than 10,000.
2. Data cleaning for AA columns requires three categories: Photoshop, CorelDRAW,AI; Contains one or two of them; Not at all.
3. The job applicant information can be classified into 4-5 categories according to the degree of matching and try to interpret the classification results verbally according to the data in columns G, AA, E and X after cleaning.
2. Getting data
2.1 Importing data
# Import data
import pandas as pd
df = pd.read_excel('data.xlsx')
2.2 Viewing data
# View data types and total data for each column
df.info()
<class 'pandas.core.frame.DataFrame'>
RangeIndex: 1430 entries, 0 to 1429
Data columns (total 27 columns):
Resume number 1430 non-null int64
 Applicant position 1430 non-null object
 Gender 1430 non-null object
 Birth date 1430 non-null datetime64[ns]
Age 1430 non-null int64
 Residence 1430 non-null object
 Expected salary 1407 non-null object
 Location 1409 non-null object
 Function/position 1430 non-null object
 Industry 1149 non-null object
 Working type 1430 non-null object
 School 1430 non-null object
 Type 1430 non-null object
 Professional 1420 non-null object
 Working experience 1348 non-null object
 Working time 1430 non-null object
 Company name 1430 non-null object
 Company size 1430 non-null object
 Company Industry 1430 non-null object
 Property 1430 non-null object
 Department 1430 non-null object
 Position 1430 non-null object
 Number of working companies 1430 non-null int64
 Working life 1430 non-null object s
 Working stability 1430 non-null int64
 Is 1430 non-null object stable
 Skill/Language 578 non-null object
dtypes: datetime64[ns](1), int64(4), object(22)
memory usage: 301.7+ KB
The results of the query show that there are 1430 rows and 27 fields, of which 6 are missing.
3. Data Processing
3.1 Question 1:
Data cleaning for column G is classified as None, 2000-3999, 4000-5999, 6000-7999, 8000-9999, and more than 10,000.
3.1.1 Duplicate Value Processing
# Remove duplicate values
print('Size before deleting duplicate values',df.shape)

# Delete duplicate records
df = df.drop_duplicates()

print('Size after deleting duplicate values',df.shape)
Indicates that there are no duplicate values for the dataset.
3.1.2 Missing Value Handling
According to df.info() query result: expected salary is missing 1430-1407=23, missing rate 23/1430=1.6%
Column G does not meet the criteria for Nan and None, so fill in column G Nan with'None', so there will be no missing values.
new_data = df.fillna({'Salary Expectation':'nothing'})
new_data['Salary Expectation']
3.1.2 Unification Processing
First look at each unit type:
# Convert salary formats from different units into a unified format
print(new_data['Salary Expectation'].str[-6:].value_counts())
Query found that there are unit types: yuan/month, ten thousand yuan/year, none, less than ten thousand yuan/year, less than ten thousand yuan/month

print(new_data['Salary Expectation'].str[-10:].value_counts())
# Convert irregular salary formats to uniform formats
new_data.loc[new_data['Salary Expectation'].str[-6:]=='Ten thousand yuan or less/year','Salary Expectation']= '0-2 Ten thousand yuan/year'
new_data.loc[new_data['Salary Expectation'].str[-5:]=='The following Yuan/month','Salary Expectation']='0-1500 element/month'
Unit into four units: yuan/month, yuan/month, yuan/year, none
# Unify the above four units into an average monthly salary (Yuan/Month)
import re
def salary_p(salary):
    if salary == 'nothing':
        return 0
    elif re.search('element/month',salary):
        s = re.findall('(\d+)-(\d+)element/month',salary)
        # s=[('1000','10000')]
        mi,ma = int(s[0][0]),int(s[0][1])
        return (mi+ma)*0.5
    elif re.search('Ten thousand yuan/year',salary):
        s = re.findall('(\d+)-(\d+)Ten thousand yuan/year',salary)
        mi,ma = int(s[0][0]),int(s[0][1])
        return (mi+ma)*0.5*10000/12
    elif re.search('element/year',salary):
        s = re.findall('(\d+)-(\d+)element/year',salary)
        mi,ma = int(s[0][0]),int(s[0][1])
        return (mi+ma)*0.5/12
    else:
        return -1
# New column saves average monthly pay new_data['mean_salary'] = new_data['Salary Expectation'].apply(salary_p) # Make a slice bins = [0,2000,4000, 6000, 8000,10000,1000000] labels =['0-2000','2000-3999','4000-5999','6000-7999','8000-9999','>10000'] new_data['salary_class']=pd.cut (new_data['mean_salary'], bins, labels=labels, right=False) new_data['salary_class'].value_counts()
The results are as follows:


3.2 Question 2:
Data cleaning for AA columns requires three categories: Photoshop, CorelDRAW,AI; Contains one or two of them; Not at all.
3.2.1 Missing Value Handling
new_data['Skill/language'].fillna('nothing',inplace=True)
new_data.info()
3.2.2 Skill keyword processing
new_data['skill'] = new_data['Skill/language'].str.findall('[a-zA-Z0-9\s#.\+/]+')

# Handle spaces before and after skill words and convert them to lowercase
new_data['skill2']=''
for i in new_data['skill'].index:
    new_data.loc[i,'skill2']=",".join(map(lambda x:x.strip().lower(),new_data.loc[i,'skill']))
3.2.3 Skill Statistics
new_data['skill_class']=0
s = ['photoshop','corel draw','ai']
for i in new_data['skill2'].index:
    skill = new_data['skill2'].iloc[i]
    b = 0
    for j in s:
        if j in skill:
            b+=1
    new_data.loc[i,'skill_class']=b

new_data['skill_class'].value_counts()

new_data['skill_class'].map({0:'Include None',1:'Include one or two of them',2:'Include one or both of them',3:'All three skills are included'})
The results are as follows:

3.2.4 Visual Display
import matplotlib.pyplot as plt

#Define the label for the pie chart, the label is a list
labels =[ '0','1 Or 2','3']

x = [1120,307,3]
explode = (0.3,0,0.1)

# Draw pie chart
plt.pie(x,labels=labels,autopct='%.0f%%',explode=explode)
plt.axis('equal')
plt.show()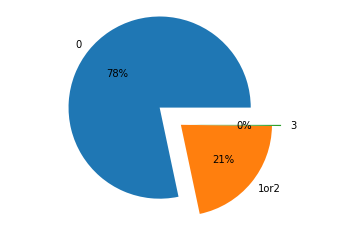
The results show that 78% of them are not included at all, 21% are included at 1 or 2, and 0% are all included at all.
3.3 Question 3:
The job applicant information can be classified into 4-5 categories according to the degree of matching and try to interpret the classification results verbally according to the data in columns G, AA, E and X after cleaning.
3.3.1 Data cleaning
G/AA/E, numeric type after cleaning, column X needs cleaning
def work_proc(work_y):

    if work_y == 'No work experience yet':
        return 0
    elif re.search('year',work_y):
        s = re.findall('(\d+)year',work_y)
        # s=['8'], converting data types
        s=int(s[0])
        return s

new_data['work_years'] = new_data['Work life'].apply(work_proc)

new_data['work_years']
# Wages are replaced by average pay
new_data = new_data.rename(columns={'Age':'age'})
new_data2 = new_data[['work_years','age','mean_salary','skill_class']]
new_data2
3.3.2 Modeling Analysis
# Introducing kmeans algorithm model
from sklearn.cluster import KMeans

# Call KMeans algorithm for clustering, set to 4 categories
clf = KMeans(n_clusters=4,random_state=0)

# Fitting the data, training the model
clf.fit(new_data2)
# View classification results
print(len(clf.labels_))

se = pd.Series(clf.labels_)
print(se.value_counts())
The results are as follows:

3.2.3 Visual Display
new_data2['label']=clf.labels_
new_data2.head()
Column chart:
xl_cnt2 = new_data2.groupby('label')['label'].count()
xl_cnt2 = xl_cnt2.sort_values()
fig = plt.figure(figsize=(12,5))
plt.bar(xl_cnt2.index,xl_cnt2.values)
plt.xlabel('clusters')
plt.xticks(rotation=90)
plt.title('K-means')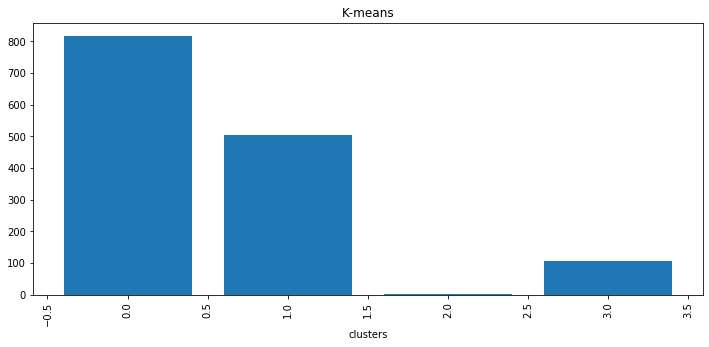
Sector:
import matplotlib.pyplot as plt


labels =[ '0','1','2','3']

x = [818,504,3,105]
explode = (0.3,0,0,0)

plt.pie(x,labels=labels,autopct='%.0f%%',explode=explode)
plt.axis('equal')
plt.show()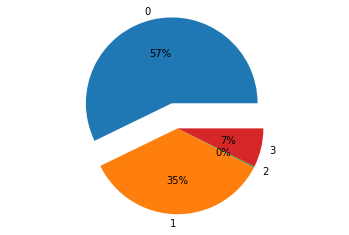
The results show that:
Matching degree 0 is 818, accounting for 57%;
Matching degree 1 is 505, accounting for 35%;
Matching degree 2 accounts for about 0% of the total.
Matching degree 3 of 105 accounts for about 7%.