In the process of performance test, we often encounter the performance bottleneck of Mysql. For the database, the so-called performance bottleneck is nothing more than slow SQL, high CPU, high IO, and high memory. The first three examples are used for performance analysis. Finally, the high memory is only the method description (not encountered in the actual test project):
First of all, we need to ensure that there are no performance problems in database configuration. After all, before performance testing, we need to roll up some basic configurations to avoid making low-level errors.
1, Slow SQL positioning analysis
First of all, the slow business system must be reflected in the response time. Therefore, in the performance test, if it is found to be slow, we will split it from the response time, and finally split it to mysql, which is to analyze the slow SQL. Similarly, if it is found that the mysql process accounts for a high percentage of the CPU in the high concurrency, it is also a priority to analyze whether there is slow SQL, and judge whether the slow SQL is relatively simple. For Mysq, it is to see Slow log query.
1. The first sum is to enable slow log query:
#Check whether it is opened and storage path
show variables like '%slow_query_log%';

#open
set global slow_query_log = 1;

#Time to log slow logs, 10 seconds by default
show variables like '%long_query_time%'

#View the number of slow logs
show global status like '%slow_queries%'
Using set global slow_query_log=1; enable slow query log is only valid for the current database. If MySQL is restarted, it will fail. If you want to take effect permanently, you have to modify the configuration file. In fact, it's not necessary. We just turn it on temporarily and analyze the performance problems (after analysis, we have to turn it off).
2. Get slow SQL during test
To manually analyze logs, find and analyze SQL, it is obviously an individual activity. MySql provides the log analysis tool mysqldumpslow
#Get up to 10 SQL returned recordsets
Mysqldumpslow –s r –t 10 /usr/local/mysql/data/localhost-slow.log
#Get the top 10 SQL accesses
Mysqldumpslow –s c –t 10 /usr/local/mysql/data/localhost-slow.log
#Get the top 10 queries with left connections sorted by time
Mysqldumpslow –s t –t 10 –g "left join" /usr/local/mysql/data/localhost-slow.log
#It is also recommended to combine| and more when using these commands, otherwise blasting may occur
Mysqldumpslow –s r –t 10 /usr/local/mysql/data/localhost-slow.log | more
Parameter meaning
 s: Indicates how to sort
 c: Number of visits
 l: Lock time
 r: Return record
 t: Query time
 al: average locking time
 t: How many pieces of data are returned
 g: Followed by a regular expression
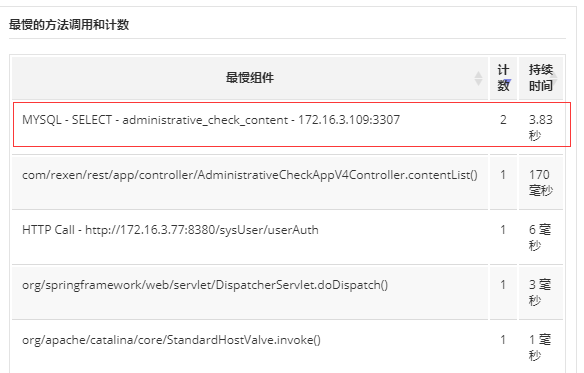
In addition, you can also monitor through APM (full link monitoring) and slow SQL (of course, it is not recommended to rely on some heavy tools during pressure test):
3. Preliminary Explain analysis
This is the most basic function. To obtain slow SQL, of course, you need to actually verify how slow it is and whether the index is configured. Take a SQL statement of the actual test project to analyze:
explain SELECT count(c.id)
        FROM administrative_check_content c
        LEFT JOIN administrative_check_report_enforcers e ON c.report_id=e.report_id
        LEFT JOIN administrative_check_report r ON c.report_id = r.id
        WHERE e.enforcer_id= 'ec66d95c8c6d437b9e3a460f93f1a592';
We can analyze this statement, 86% of the time is spent in Sending data (the so-called "Sending data" is not simply Sending data, but includes "collect [retrieve] + send data"):
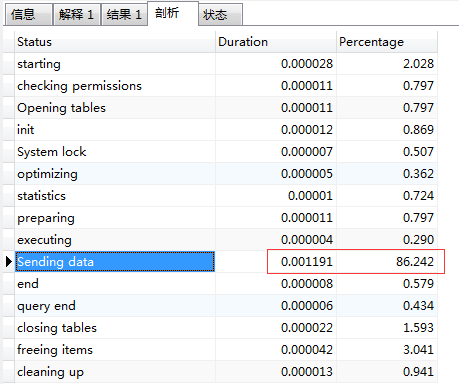
It can also be seen from Explain that the index has been enhanced_ Id_ Index), and through the index almost the whole table, 30084 pieces of data are retrieved, as follows:

Generally, if the index is not added or is unreasonable, it can be seen immediately through such an analysis. It can be said that the index problem is one of the main reasons for slow SQL.
In the explanation statement, we mainly focus on the following columns related to index:
(1)type
This column is important to show which categories are used by the connection and whether indexes are used. Generally, the best to worst connection types are const and eq_reg, ref, range, indexhe, and ALL.
(2)possible_keys
possible_ The keys column indicates which index MySQL can use to find rows in the table. Note that the column is completely independent of the order of the tables shown in the EXPLAIN output. This means that at possible_ Some of the keys in keys cannot actually be used in the order of the generated tables.
If the column is NULL, there is no relevant index. In this case, you can improve your query performance by checking the WHERE clause to see if it references certain columns or columns that are suitable for indexing. If so, create an appropriate index and check the query again with EXPLAIN.
(3) key
The key column shows the key (index) that MySQL actually decides to use. If no index is selected, the key is NULL. To force Mysql to use or ignore possible_ The index in the keys column, using FORCE INDEX, USE INDEX, or IGNORE INDEX in the query.
(4)key_len
key_ The len column shows the key length that MySQL determines to use. If the key is NULL, the length is NULL. Using the length of the index, the shorter the length, the better without losing accuracy.
(5)ref
The ref column shows which column or constant is used to select rows from the table with the key. This column involves fields associated with multiple tables. const represents constant Association. Refs are often associated with indexes.
4. sql analysis with show profile
It is also very simple to enable analysis, just use the temporary enable to execute set profiling=1 (this function will cache the analysis statements of the latest query, 15 by default, and 100 at most, which is suitable for sql analysis after the end of the pressure test, and then set 0 to close after use), as follows:
#Shows whether Profiling is on and how many profiles can be stored at most
show variables like '%profil%';

#Open Profiling
set profiling=1;

#Execute your SQL
#Here we mainly execute the slow SQL found earlier

#View analysis
show profiles;
Through show profiles, we can see the SQL (query) executed above_ ID=18):

Execution: show profile cpu,memory,block io for query 18;
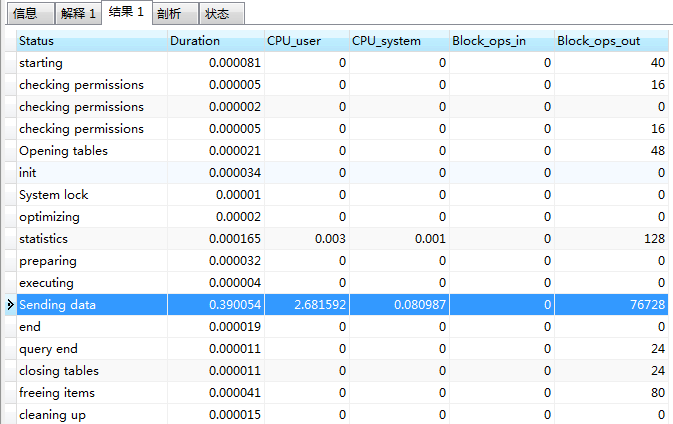
It can be seen that Sending data takes the most CPU time (even if a simple SQL statement takes up a lot of time), and the IO cost of this SQL can also be seen (because queries are ops out output).
In addition, the show profile statement is described as follows:
show profile cpu, block io, memory,swaps,context switches,source for query [Query_ID];

# Some parameters after Show profile:
# -All: display all overhead information
# -cpu: display cpu related overhead
# -Block io: display Block io related overhead
# -Context switches: context switching related overhead
# -Memory: display memory related costs
# -Source: display and source_function,source_file,source_line related overhead information
Conclusion: we can trace the origin of a slow SQL to find the cause of its slowness, so that we can guide the performance tuning very well (the performance test engineer can not tune, but can't analyze the performance is really not good, once encountering a problem, he can only say slowly, but can't tell the developer which slow test engineer is, it should be difficult for the developer to admire, or even gain respect Heavy!).
2, High CPU positioning analysis
1. High CPU caused by SQL
In the process of performance pressure test, there are many reasons for the high CPU of database, which are generally related to slow SQL (because each SQL accounts for either high CPU or high IO, which is generally the case), so how to analyze some SQL?
(1) First, locate the process with high CPU consumption
Find out the high CPU usage of MySQL through the TOP command, and then see how many threads in the MySQL process are high CPU usage:
# top -p [pid] H
top -p 44662 H

It can be seen that there are 6 Running CPUs, 36 Sleeping CPUs and 2 Sleeping CPUs.
(2) We use SHOW FULL PROCESSLIST; query in mysql (through FULL, we can not only display all connected threads, but also display the complete SQL statement being executed), as follows:

We can see that many of them are in Sending data status. We select the most complex statement to analyze:
(SELECT r.id,c.check_action_name,check_date,check_end_date,c.id AS check_content_id,c.check_object_name AS checkObjectName,c.update_time,c.verify
        FROM administrative_check_content c
        LEFT JOIN administrative_check_report r ON c.report_id=r.id
        LEFT JOIN administrative_check_report_enforcers e ON r.id=e.report_id
        WHERE e.enforcer_id= 'ec66d95c8c6d437b9e3a460f93f1a592'
        )
            UNION ALL
            (
            SELECT r.id,r.check_action_name,check_date,check_end_date,'0','nothing' AS checkObjectName,r.update_time,false
            FROM administrative_check_report r
            LEFT JOIN administrative_check_report_enforcers e ON r.id=e.report_id
            WHERE e.enforcer_id= 'ec66d95c8c6d437b9e3a460f93f1a592'
            AND r.check_content_id='0'

            )
        ORDER BY update_time DESC,check_content_id
        LIMIT 0, 15
(3) Analyze this statement with show profile mentioned earlier:
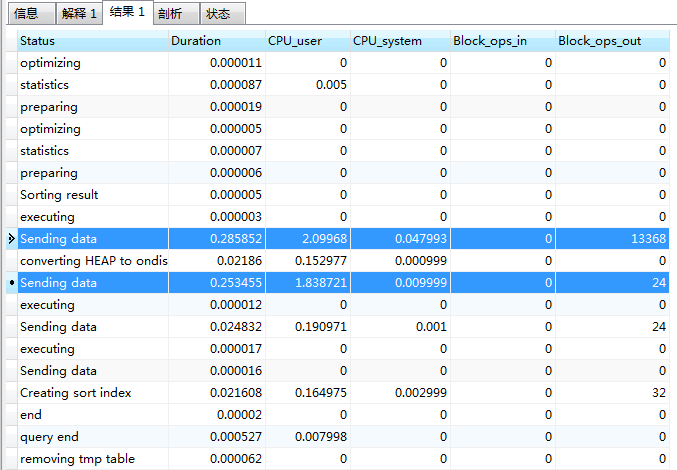
We can see that two Sending data take up a lot of time and take a lot of time. In fact, this statement uses a joint query. We can split the SQL statement for further analysis (complex statements are composed of simple statements, and sometimes the separated sentences are very slow). We can split one statement for further analysis:
SELECT r.id,c.check_action_name,check_date,check_end_date,c.id AS check_content_id,c.check_object_name AS checkObjectName,c.update_time,c.verify
        FROM administrative_check_content c
        LEFT JOIN administrative_check_report r ON c.report_id=r.id
        LEFT JOIN administrative_check_report_enforcers e ON r.id=e.report_id
        WHERE e.enforcer_id= 'ec66d95c8c6d437b9e3a460f93f1a592'
To execute this statement, the query time needs more than 0.8 seconds, as follows:

After performing the EXPLAIN analysis, you can see that the content queried through the index is up to 30084 lines, as follows:

In general, when a system like this is used for pressure testing, most of the data distribution is unreasonable. The test data does not reflect the real business scenarios. Obviously, the data distribution is unbalanced. An ID number is associated with 30000 pieces of data, and the efficiency of using indexes is not reflected.
Summary: through SHOW PROCESSLIST, we can know the current thread status of Mysql and where the main resources are consumed. Combined with show profile, we can analyze the specific SQL with high CPU consumption, and further locate the cause of high CPU caused by SQL, which will undoubtedly guide the optimization direction of developers.
2. High CPU due to other reasons
Basically, it's similar to the above analysis idea. Exclude the SQL cause (the problems caused by SQL mainly focus on CPU or IO, and sometimes high IO indirectly results in high CPU). The high CPU caused by other causes can be located by mysql show processlist + show status + kill Id.
(1) First, through SHOW PROCESSLIST to query mysql thread State, we need to focus on the meaning of different states in the State column:
Checking table
 Checking data table (this is automatic).
Closing tables
 Refreshing the modified data in the table to disk and closing the exhausted tables. This is a quick operation. If not, you should make sure whether the disk space is full or whether the disk is under heavy load.
Connect Out
 Replication slave is connecting to the master server.
Copying to tmp table on disk
 Because the temporary result set is larger than tmp_table_size, the temporary table is being converted from memory storage to disk storage to save memory (if the temporary table is too large, mysql will write the temporary table to the hard disk for too long, which will affect the overall performance).
Creating tmp table
 Creating temporary table to hold partial query results.
deleting from main table
 The server is performing the first part of a multi table deletion, just dropping the first table.
deleting from reference tables
 The server is performing the second part of a multi table deletion, deleting records for other tables.
Flushing tables
 Executing FLUSH TABLES, waiting for other threads to close the tables.
Killed
 If a kill request is sent to a thread, the thread will check the kill flag bit and give up the next kill request. MySQL checks the kill flag bit in each main loop, but in some cases, the thread may take a short time to die. If the thread is locked by another thread, the kill request will take effect as soon as the lock is released.
Locked
 Locked by other queries.
Sending data
 The record of the SELECT query is being processed and the result is being sent to the client.
Sorting for group
 Sorting GROUP BY.
 Sorting for order
 Sorting ORDER BY.
Opening tables
 The process should be quick, unless it is interrupted by other factors. For example, a data table cannot be opened by another thread until the end of executing an ALTER TABLE or LOCK TABLE statement row. Attempting to open a table.
Removing duplicates
 A query in SELECT DISTINCT mode is being executed, but MySQL cannot optimize those duplicate records in the previous stage. Therefore, MySQL needs to remove the duplicate records again, and then send the results to the client.
Reopen table
 A lock on a table is obtained, but the lock can only be obtained after the table structure is modified. Lock released, data table closed, attempting to reopen.
Repair by sorting
 The repair directive is sorting to create an index.
Repair with keycache
 The repair instruction is using the index cache to create new indexes one by one. It will be slower than Repair by sorting.
Searching rows for update
 Matching records are being found for UPDATE. It must be done before the UPDATE modifies the related records.
Sleeping
 Waiting for clients to send new requests. (too many sleepings are also a problem, such as wait_ The timeout setting is too large, which causes a large number of SLEEP processes in MySQL to be released in time, which slows down system performance, but it cannot be set too small, otherwise you may encounter problems such as "MySQL has gone away".
System lock
 Waiting to acquire an external system lock. If multiple mysqld servers are not running to request the same table at the same time, you can disable the external system lock by adding the -- skip external locking parameter.
Upgrading lock
 INSERT DELAYED is trying to get a lock table to insert a new record.
Updating
 Searching for matching records and modifying them.
User Lock
 Waiting for GET_LOCK().
Waiting for tables
 The thread is informed that the data table structure has been modified and needs to be reopened to get the new structure. Then, in order to reopen the data table, you must wait until all other threads close the table. This notification occurs when FLUSH TABLES tbl_name, ALTER TABLE, RENAME TABLE, REPAIR TABLE, ANALYZE TABLE, or OPTIMIZE TABLE.
waiting for handler insert
 INSERT DELAYED has processed all pending insert operations and is waiting for new requests.
Most of the above states correspond to fast operations. As long as a thread keeps the same state for several seconds, there may be a problem. You need to check it.
There are other statuses that are not listed above, but most of them are only used to check whether the server has errors.
(2) Second, query the current running status of Mysql through show status
Understand the following status values and their meanings. If there is a record in the daily operation and maintenance process, when the system has abnormal performance, you can make a comparison of the status values. If the deviation is too large, you need to pay attention to the points (in fact, you can add these parameter values to the operation and maintenance monitoring system as the focus index), as follows:
Aborted_clients the number of connections that have been dropped because the connection has died because the client did not close properly.
Aborted_ The number of times connections have been attempted to a MySQL server that has failed.
The number of times Connections attempted to connect to the MySQL server.
Created_tmp_tables the number of implicit temporary tables that have been created when the statement is executed.
Delayed_ insert_ The number of deferred insert processor threads in use by threads.
Delayed_ The number of rows written by writes with INSERT DELAYED.
Delayed_errors the number of rows that were written with INSERT DELAYED with some errors (possibly duplicate key values).
Flush_commands the number of times the FLUSH command was executed.
Handler_ The number of times a delete request has deleted a row from a table.
Handler_ read_ The number of first requests to read the first row in the table.
Handler_ read_ The key request number is based on the key read line.
Handler_ read_ The number of next requests to read a row based on a key.
Handler_ read_ The number of times RND requests to read a row based on a fixed location.
Handler_ The number of update requests to update a row in the table.
Handler_ The number of times a write request has inserted a row into the table.
Key_ blocks_ The number of blocks used for keyword caching.
Key_read_requests the number of times a request to read a key value from the cache.
Key_reads the number of times a key value was physically read from the disk.
Key_write_requests requests the number of times a key block was written to the cache.
Key_writes the number of times a key block has been physically written to disk.
Max_ used_ The maximum number of simultaneous connections used by the connections server after startup.
Not_flushed_key_blocks are key blocks that have changed in the key cache but have not been emptied to disk.
Not_ flushed_ delayed_ The number of rows waiting to be written in the INSERT DELAY queue.
Open_ The number of tables currently open.
Open_files the number of open files.
Open_ Number of streams open (mainly for logging)
Opened_ The number of tables that have been opened by tables.
The number of queries sent to the server by Questions.
Slow_queries cost more than long_ query_ Number of queries at time.
Threads_connected the number of connections currently open.
Threads_ The number of threads that are not sleeping (active).
How many seconds did the Uptime server work.
Uptime_since_flush_status the last time FLUSH STATUS was used (in seconds)
(3) Finally, you can try to kill id (id is displayed in SHOW PROCESSLIST) and turn off the thread that is suspected to occupy high CPU to confirm whether the CPU can be lowered.
For mysql, the CPU problems other than slow SQL and deadlock are not easy to locate, which requires a good understanding of the database system and performance. For our performance test, what we can do is to analyze layer by layer and narrow the problem range, which is really not good. We can only use the kill id method to test and troubleshoot.
3, High IO positioning analysis
In fact, high IO may also cause high CPU, because disk I/O is slow, which will cause CPU to wait for disk I/O requests all the time. Analyzing database IO is a basic skill (after all, most databases are tuned to the extreme, and the final bottleneck may also be IO, and IO tuning is more difficult).
(1) First, use the universal top command to view the process
[root@localhost ~]# top
top - 11:53:04 up 702 days, 56 min,  1 user,  load average: 7.18, 6.70, 6.47
Tasks: 576 total,   1 running, 575 sleeping,   0 stopped,   0 zombie
Cpu(s):  7.7%us,  3.4%sy,  0.0%ni, 77.6%id, 11.0%wa,  0.0%hi,  0.3%si,  0.0%st
Mem:  49374024k total, 32018844k used, 17355180k free,   115416k buffers
Swap: 16777208k total,   117612k used, 16659596k free,  5689020k cached

  PID USER      PR  NI  VIRT  RES  SHR S %CPU %MEM    TIME+  COMMAND
14165 mysql     20   0 8822m 3.1g 4672 S 162.3  6.6  89839:59 mysqld
40610 mysql     20   0 25.6g  14g 8336 S 121.7 31.5 282809:08 mysqld
49023 mysql     20   0 16.9g 5.1g 4772 S  4.6 10.8   34940:09 mysqld
It is obvious that the first two mysqld processes result in high overall load. Moreover, it can be seen from the statistical results of Cpu(s) that the values of% us and% wa are relatively high, indicating that the current bottleneck may be the CPU consumed by the user process and the disk I/O waiting.
(2) Let's first analyze the disk I/O
Execute the command sar-d 1 or (iostat-d-x-k1) (refresh per second) to confirm whether the disk I/O is really large:
[root@localhost ~]# sar -d 1
Linux 2.6.32-431.el6.x86_64 (localhost.localdomain)     06/05/2020  _x86_64_        (8 CPU)
11:54:31 AM       DEV       tps    rd_sec/s     wr_sec/s     avgrq-sz     avgqu-sz     await        svctm      %util
11:54:32 AM    dev8-0   5338.00 162784.00   1394.00     30.76      5.24      0.98      0.19    100.00
11:54:33 AM    dev8-0   5134.00 148032.00  32365.00     35.14      6.93      1.34      0.19    100.10
11:54:34 AM    dev8-0   5233.00 161376.00    996.00     31.03      9.77      1.88      0.19    100.00
11:54:35 AM    dev8-0   4566.00 139232.00   1166.00     30.75      5.37      1.18      0.22    100.00
11:54:36 AM    dev8-0   4665.00 145920.00    630.00     31.41      5.94      1.27      0.21    100.00
11:54:37 AM    dev8-0   4994.00 156544.00    546.00     31.46      7.07      1.42      0.20    100.00
%util reaches or approaches 100%, indicating that there are too many I/O requests and the I/O system is full.
(3) Then use iotop to confirm which processes consume the most disk I/O resources:
[root@localhost ~]# iotop
Total DISK READ: 59.52 M/s | Total DISK WRITE: 598.63 K/s
TID  PRIO  USER     DISK READ  DISK WRITE  SWAPIN     IO>    COMMAND
16397 be/4 mysql       7.98 M/s    0.00 B/s  0.00 % 95.67 % mysqld --basedir=/usr/local/mysql5.7 --datadir=/usr/local/mysql5.7/data --port=3306
 7295 be/4 mysql      9.95 M/s    0.00 B/s  0.00 % 93.72 % mysqld --basedir=/usr/local/mysql5.7 --datadir=/usr/local/mysql5.7/data --port=3306
14295 be/4 mysql      9.86 M/s    0.00 B/s  0.00 % 94.53 % mysqld --basedir=/usr/local/mysql5.7 --datadir=/usr/local/mysql5.7/data --port=3306
14288 be/4 mysql      13.38 M/s    0.00 B/s  0.00 % 92.21 % mysqld --basedir=/usr/local/mysql5.7 --datadir=/usr/local/mysql5.7/data --port=3306
14292 be/4 mysql      13.54 M/s    0.00 B/s  0.00 % 91.96 % mysqld --basedir=/usr/local/mysql5.7 --datadir=/usr/local/mysql5.7/data --port=3306
You can see that the instance with port number 3306 consumes a lot of disk I/O resources. Let's see what queries are running in this instance.
(4) You can use the SHOW PROCESSLIST method mentioned above, or you can use the mysqladmin command tool
We need to see which SQL is currently running:
(in the following way, mysqladmin is used. The command comes with mysql, which can create a soft link for easy calling. ln -s /usr/local/mysql/bin/mysqladmin /usr/bin):
[root@localhost ~]# mysqladmin -uroot -p123456 pr|grep -v Sleep
+----+----+----------+----+-------+-----+--------------+-----------------------------------------------------------------------------------------------+
| Id |User| Host     | db |Command|Time | State        | Info                                                                                          |
+----+----+----------+----+-------+-----+--------------+-----------------------------------------------------------------------------------------------+
| 25 |root| 172.16.1.133:45921 | db | Query | 68  | Sending data | select max(Fvideoid) from (select Fvideoid from t where Fvideoid>404612 order by Fvideoid) t1 |
| 26 |root| 172.16.1.133:45923 | db | Query | 65  | Sending data | select max(Fvideoid) from (select Fvideoid from t where Fvideoid>484915 order by Fvideoid) t1 |
| 28 |root| 172.16.1.133:45928 | db | Query | 130 | Sending data | select max(Fvideoid) from (select Fvideoid from t where Fvideoid>404641 order by Fvideoid) t1 |
| 27 |root| 172.16.1.133:45930 | db | Query | 167 | Sending data | select max(Fvideoid) from (select Fvideoid from t where Fvideoid>324157 order by Fvideoid) t1 |
| 36 |root| 172.16.1.133:45937 | db | Query | 174 | Sending data | select max(Fvideoid) from (select Fvideoid from t where Fvideoid>324346 order by Fvideoid) t1 |
+----+----+----------+----+-------+-----+--------------+-----------------------------------------------------------------------------------------------+
It can be seen that many slow queries have not been completed, and it can also be found from slow query log that the frequency of such SQL is very high.
This is a very inefficient SQL writing method, which leads to the need to scan the entire primary key, but in fact, only one maximum value is needed. From the slow query log, you can see:
Rows_sent: 1 Rows_examined: 5413058
More than 5 million rows of data are scanned each time, but only to read a maximum value, which is very inefficient.
After analysis, this SQL can be completed in one digit millisecond level with a little simple transformation, which improves the power of N.
The transformation method is to sort the query results in reverse order and get the first record. The original method is to sort the results in positive order and take the last record.
Summary: the IO analysis idea of mysql is quite simple. First, pay attention to whether the fluctuation of% wa (the time when the CPU waits for the disk to be written, usually 0, the higher the disk is busier); second, analyze the disk I/O situation, and find out which processes occupy the most IO resources; finally, use SHOW PROCESSLIST or mysqladmin to see which statements occupy IO frequently.
4, High memory location analysis
It's not easy for novices to analyze the memory usage under linux, because the concepts of MemFree, Swap, Buffers and Cached are not as intuitive as windows. In addition, mysql does not turn on memory / cache monitoring by default (only performance monitoring)_ Schema makes the statistics of memory cost), and the general mysql monitoring software is difficult to expose the problems intuitively.
(1) First, we can use the universal TOP command to analyze the memory to see if the mysql process occupies a high memory:
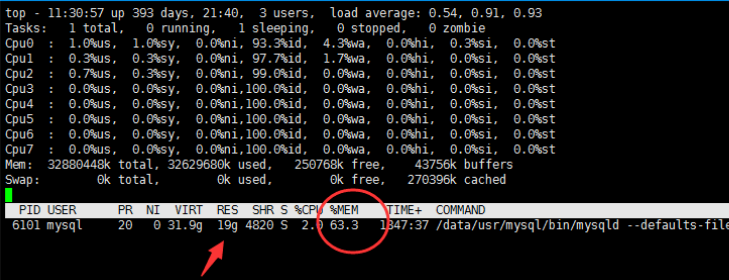
In the above figure, it is easy to see that the memory occupation is high. Because free, buffers and cached are not high, most of the used memory is occupied by the process, and there is no swap (it is disabled. Generally speaking, if the used value of swap swap partition is changing constantly, it means that the kernel is constantly exchanging memory and swap data, most likely within Now mysql occupies 63.3% of the memory.
(2) Check whether a large number of SQL operations occupy a high memory
Check the threads in mysql to see if there is a long-running or blocked sql. The universal show full processlist is also used. If there is no abnormal phenomenon of related threads (refer to the above mentioned State column for different State meanings), the reason can be excluded.
(3) Check the related configuration of mysql memory / cache, so as to check whether the memory is not really released after mysql connection is used
The memory consumption of Mysql is generally divided into two types: global level shared memory and session level private memory.
Execute the following command to query the global level shared memory allocation:
show variables where variable_name in (
'innodb_buffer_pool_size','innodb_log_buffer_size','innodb_additional_mem_pool_size','query_cache_size'
);
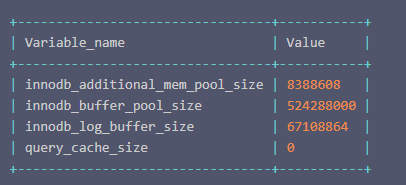
session level private memory is mainly used for database connection private memory. The query command is as follows:
show variables where variable_name in (
'tmp_table_size','sort_buffer_size','read_buffer_size','read_rnd_buffer_size','join_buffer_size','thread_stack', 'binlog_cache_size'
);
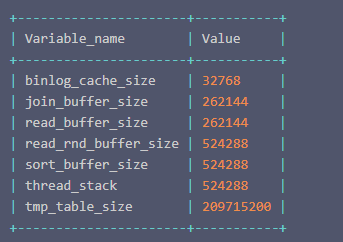
By using mysql query command reasonably, you can find the current usage of each memory or cache, but mysql does not turn on memory monitoring by default. You can find out that most of the monitoring items are not turned on through the following statements:
SELECT * FROM performance_schema.setup_instruments
       WHERE  NAME LIKE '%memory%' and NAME not LIKE '%memory/performance_schema%';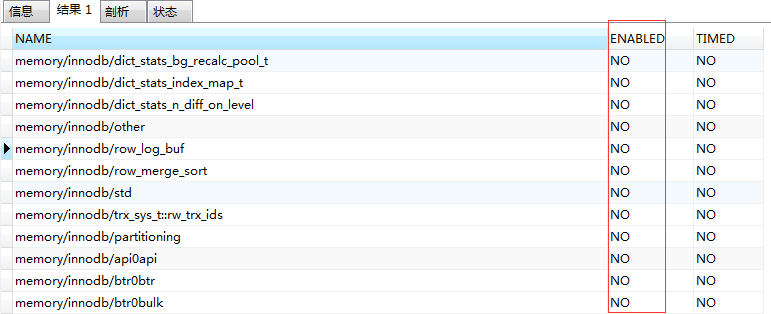
We can use the update statement to start in batch (it belongs to temporary start, and it is restored to close after restarting mysql):
mysql> update performance_schema.setup_instruments set enabled = 'yes'
       WHERE  NAME LIKE '%memory%' and NAME not LIKE '%memory/performance_schema%';
> Affected rows: 310
> time: 0.002s
Then you can find out the use of all the memory of mysql through the following statements:
SELECT SUBSTRING_INDEX(event_name,'/',2) AS
       code_area, sys.format_bytes(SUM(current_alloc))
       AS current_alloc
       FROM sys.x$memory_global_by_current_bytes
       GROUP BY SUBSTRING_INDEX(event_name,'/',2)
       ORDER BY SUM(current_alloc) DESC;
It is found that the highest memory occupied is memory/innodb, as follows:
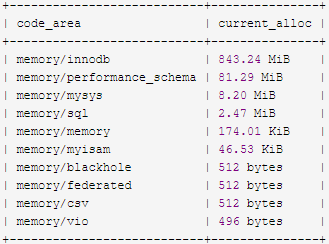
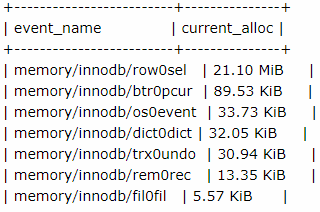
You can further refine the query memory/innodb:
SELECT * FROM sys.memory_global_by_current_bytes WHERE event_name LIKE 'memory/innodb%';
For memory usage estimation, someone recommended a memory calculator on the Internet. The website is: http://www.mysqlcalculator.com/
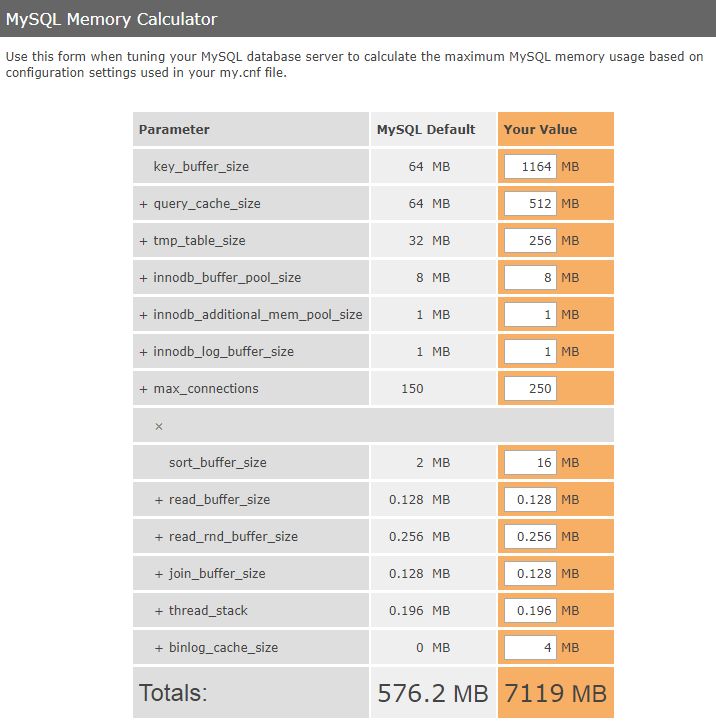
(Note: the left column of the figure above is the default configuration of mysql, and the right column is the configuration of the current database [which can be found by show variables], and the maximum memory usage can be estimated. As shown in the figure above, slightly increase the configuration to 7119MB. If the expected result does not meet the requirements, the current configuration is unreasonable and needs to be adjusted).
mysql's database memory / cache optimization is really inexperienced. The following is an optimization process configuration item provided on the Internet (the actual setting size depends on the memory size of your machine, which is calculated with the memory calculator to see if it exceeds the standard):
key_buffer_size = 32M //key_buffer_size specifies the size of the index buffer, which determines the speed of index processing, especially index reading. Works only on the MyISAM table. Even if you do not use the MyISAM table, but the internal temporary disk table is the MyISAM table, use this value. Since my database engine is innodb and most tables are innodb, the default value is half 32M.
query_cache_size = 64M //Query the cache size. When the query is opened, the execution of the query statement will cache. Reading and writing will bring extra memory consumption. If the next query hits the cache, the result will be returned immediately. The default option is off. If it is on, you need to adjust the parameter item query_cache_type=ON.  The default value of 64M is used here.
tmp_table_size = 64M //Setting the range to 64-256M is the best. When you need to do something similar to the size of the temporary table generated by group by operation, improve the effect of query speed of join, adjust the value until created_ tmp_ disk_ tables / created_ tmp_ Tables * 100% < = 25%, in such a state, the effect is good. If most of the website is static content, it can be set to 64M, if it is dynamic page, it can be set to over 100M, which should not be too large, resulting in insufficient memory I/O blocking. Here we set it to 64M.
innodb_buffer_pool_size = 8196M //The main function of this parameter is to cache the index, data and buffer when inserting data of innodb table. Size of dedicated mysql server settings: 70% - 80% of operating system memory is the best. As there are other applications deployed on our server, it is estimated that this is set to 8G. In addition, this parameter is non dynamic. To change this value, you need to restart mysqld service. If the setting is too large, the swap space of the system will be occupied, which will slow down the operating system and reduce the efficiency of sql query.
innodb_additional_mem_pool_size = 16M //It is used to store the internal directory of Innodb. This value does not need to be assigned too much. The system can adjust it automatically. Don't set it too high. It is usually enough to set 16M for big data. If there are many tables, you can increase them appropriately. If this value increases automatically, it will be displayed in the error log. Here we set it to 16M.
innodb_log_buffer_size = 8M //InnoDB writes data to the log cache in memory. Because InnoDB does not write changed logs to disk before transaction commit, it can reduce the pressure of disk I/O in large transactions. In general, 4MB-8MB is enough without writing a lot of huge blobs. Here we set it to 8M.
max_connections = 800 //The maximum number of connections. Set a comprehensive number according to the number of people online at the same time. The maximum number is no more than 16384. Here we set it to 800 according to the comprehensive evaluation of system usage.
sort_buffer_size = 2M //Is a connection level parameter. When each connection needs to use this buffer for the first time, it allocates the set memory at one time. It is not that the larger the better. Because it is a connection level parameter, too large setting + high concurrency may exhaust the system memory resources. The recommended range of official documents is 256KB~2MB. Here we set it to 2M.
read_buffer_size = 2M //(data file storage order) is the size of MySQL read buffer. The request that scans the table in order will allocate a read buffer. MySQL will allocate a memory buffer for it_ buffer_ The size variable controls the size of this buffer. If the sequential scanning of the table is very frequent and you think the frequent scanning is too slow, you can improve its performance by increasing the value of this variable and the size of the memory buffer_ buffer_ The size variable controls the order of data files in order to improve the efficiency of table sequential scanning. Here we set it a little higher than the default value, 2M.
read_rnd_buffer_size = 250K //It is the random read buffer size of MySQL. When reading rows in any order (such as columns in the order of sorting), a random read buffer will be allocated. When sorting queries, MySQL will scan the buffer first to avoid disk search and improve the query speed. If a large amount of data is needed, the value can be adjusted appropriately, but MySQL will allocate the buffer for each customer connection To set the value as appropriate as possible to avoid excessive memory overhead. The random sequential buffering of tables improves the efficiency of reading. This is set to be similar to the default value, 250KB.
join_buffer_size = 250K //When multiple tables participate in join operation, allocate cache appropriately to reduce memory consumption. Here we set it to 250KB.
thread_stack = 256K //The amount of memory MySQL allocates to each connection thread when it is created. When MySQL creates a new connection thread, it needs to allocate a certain amount of memory stack space to it, so as to store the Query requested by the client and its various states and processing information. Thread Cache hit rate: Thread_Cache_Hit = (Connections - Threads_created) / Connections * 100%; the normal configuration is only when the hit rate is 90%. This value needs to be increased when the error prompt "MySQL debug: thread stack overrun" appears. Here we configure it as 256K.
binlog_cache_size = 250K // The memory allocated for each session is used to store the cache of binary logs during the transaction. The function is to improve the efficiency of recording bin log. There is no big transaction, and dml can be set to be smaller when it is not very frequent. If the transaction is large and many, and dml operation is frequent, you can increase it appropriately. The former is 1048576 – 1M; the latter is 2097152 – 4194304, i.e. 2 – 4M. Here, we configure it as 250KB according to the actual situation of the system.
table_definition_cache = 400 // Development mode: from 1400 to 400, memory from 150M to 90M; service mode: from 1400 to 400, memory from 324M to 227M
Summary: according to the default configuration, there is seldom insufficient memory (after all, the current database products are quite mature in managing memory). Because according to the default configuration, the memory accounts for 576.2MB in total, but in the use process, many people have configured unreasonable parameters (in order to pursue high performance, the relationship between configuration and hardware is not well balanced) or running reality Exception, causing memory corruption.