pidstat 1 information
You can see if the process with pid 12186 is occupying CPU 0 and using CPU 0 at 100%, or if system consumes CPU 0 at 100%.
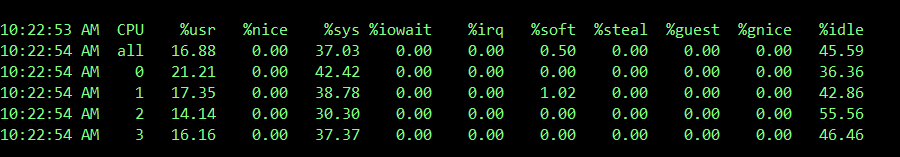
Mpstat-P ALL 1 Information
Use the ps command to view the cpu consumption of threads in the process
ps -mp 12186 -o THREAD,tid,time
USER %CPU PRI SCNT WCHAN USER SYSTEM TID TIME
actiont+ 176 - - - - - - 43-18:00:43
actiont+ 0.0 19 - futex_ - - 12186 00:00:00
actiont+ 0.1 19 - poll_s - - 12187 00:48:52
actiont+ 0.0 19 - futex_ - - 12188 00:00:00
actiont+ 0.0 19 - futex_ - - 12189 00:00:00
actiont+ 14.0 19 - - - - 12190 3-11:26:12
actiont+ 0.0 19 - futex_ - - 12191 00:00:00
actiont+ 0.0 19 - futex_ - - 12192 00:02:23
actiont+ 13.0 19 - futex_ - - 12193 3-05:45:42
actiont+ 14.1 19 - futex_ - - 12194 3-12:11:30
actiont+ 14.0 19 - futex_ - - 12195 3-11:34:00
actiont+ 14.1 19 - futex_ - - 12196 3-12:14:18
actiont+ 14.1 19 - ep_pol - - 12197 3-12:19:48
actiont+ 13.1 19 - futex_ - - 12198 3-06:23:27
actiont+ 14.1 19 - futex_ - - 12199 3-12:28:19
actiont+ 0.0 19 - do_wai - - 12421 00:00:13
actiont+ 13.7 19 - futex_ - - 27303 3-09:20:12
actiont+ 13.4 19 - futex_ - - 7804 3-07:34:37
actiont+ 0.0 19 - do_wai - - 6723 00:00:11
actiont+ 12.6 19 - futex_ - - 826 3-02:25:45
actiont+ 13.2 19 - - - - 31261 2-22:07:06
actiont+ 15.8 19 - futex_ - - 7988 3-11:18:01
It can be seen that threads with TID of 7988 consume cpu of 12186 15.8% of the process.
Use strace to view system calls for 7988 threads in the process
strace -cp 7988
>strace: Process 7988 attached
^Cstrace: Process 7988 detached
% time     seconds  usecs/call     calls    errors syscall
 74.32   55.526790       20214      2747       519 futex
 14.29   10.680398          11    937750    937750 openat
 11.36    8.490304       58153       146           epoll_wait
  0.02    0.011516         104       111           sched_yield
  0.00    0.001953          36        55           write
  0.00    0.000962          64        15         8 read
  0.00    0.000888          63        14           pselect6
  0.00    0.000860          13        67        46 stat
  0.00    0.000396          99         4           close
  0.00    0.000302         101         3         3 connect
  0.00    0.000238          11        21        21 mkdirat
  0.00    0.000233          11        21        21 lstat
  0.00    0.000181          12        15           setsockopt
  0.00    0.000092          13         7           epoll_ctl
  0.00    0.000083          14         6           getpeername
  0.00    0.000074          12         6           getsockopt
  0.00    0.000058          10         6           getsockname
  0.00    0.000047          16         3           socket
As you can see, the longest call time is the futex system call
Use pstack to view process stack information
Installing gdb will install pstack
yum -y install gdb
pstack 12186
Thread 14 (Thread 0x7f510d756700 (LWP 12194)):
#0 0x0000000000461bd3 in runtime.futex ()
#1 0x0000000000430230 in runtime.futexsleep ()
#2 0x0000000001178280 in runtime.timers ()
#3 0x0000000000000000 in ?? ()
Thread 13 (Thread 0x7f510cf55700 (LWP 12195)):
#0 0x0000000000461bd3 in runtime.futex ()
#1 0x00000000004301bb in runtime.futexsleep ()
#2 0x000000c420099948 in ?? ()
#3 0x0000000000000000 in ?? ()
Thread 12 (Thread 0x7f50f7fff700 (LWP 12196)):
#0 0x0000000000461bd3 in runtime.futex ()
#1 0x00000000004301bb in runtime.futexsleep ()
#2 0x000000c42004f548 in ?? ()
#3 0x0000000000000000 in ?? ()
Thread 11 (Thread 0x7f50f77fe700 (LWP 12197)):
#0 0x0000000000461bd3 in runtime.futex ()
#1 0x00000000004301bb in runtime.futexsleep ()
#2 0x000000c42007f148 in ?? ()
#3 0x0000000000000000 in ?? ()
Thread 10 (Thread 0x7f50f6ffd700 (LWP 12198)):
#0 0x0000000000461bd3 in runtime.futex ()
#1 0x0000000000430230 in runtime.futexsleep ()
#2 0x0000000001178100 in runtime.timers ()
#3 0x0000000000000000 in ?? ()
Thread 9 (Thread 0x7f50f67fc700 (LWP 12199)):
#0 0x0000000000461bd3 in runtime.futex ()
#1 0x00000000004301bb in runtime.futexsleep ()
...
Thread 2 (Thread 0x7f50e67fc700 (LWP 7988)):
#0 0x0000000000461d79 in runtime.epollwait ()
#1 0x000000000043006c in runtime.netpoll ()
#2 0x00007f5000000004 in ?? ()
#3 0x00007f50e67fb768 in ?? ()
#4 0xffffffff00000080 in ?? ()
#5 0x0000000000000000 in ?? ()
Thread 1 (Thread 0x7f5111cd3740 (LWP 12186)):
#0 0x0000000000461bd3 in runtime.futex ()
#1 0x00000000004301bb in runtime.futexsleep ()
#2 0x0000000001174c88 in runtime.m0 ()
#3 0x0000000000000000 in ?? ()
It can be seen that the most cpu-consuming threads in process 12186 are calling futex, futexsleep.