background
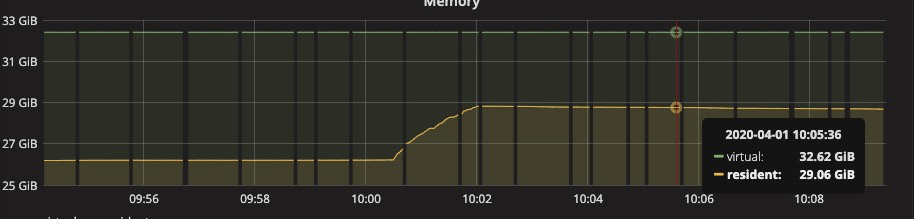
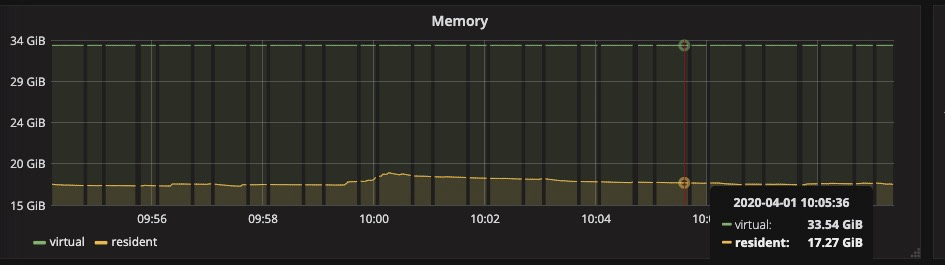
From the perspective of monitoring, Secondary uses about 11GB more physical memory than Primary,
For basic memory analysis, you can read this written by another student of the team first Troubleshooting documents,
The user is not set to read in the standby database. There is basically no traffic in the Secondary database, only the traffic of replication, and the number of connections is not large. It is basically ruled out that the business behavior causes high memory in the Secondary database, so it is suspected that it is related to the caching behavior of the tcmalloc allocator.
Troubleshooting
View the serverStatus.tcmalloc output of Primary and Secondary,
Primary,
mgset-25489817:PRIMARY> db.serverStatus().tcmalloc
{
        "generic" : {
                "current_allocated_bytes" : NumberLong("16296822448"),
                "heap_size" : NumberLong("34201272320")
        },
        "tcmalloc" : {
                "pageheap_free_bytes" : 933314560,
                "pageheap_unmapped_bytes" : NumberLong("15870619648"),
                "max_total_thread_cache_bytes" : NumberLong(1073741824),
                "current_total_thread_cache_bytes" : 543050048,
                "total_free_bytes" : NumberLong(1100498976),
                "central_cache_free_bytes" : 557461008,
                "transfer_cache_free_bytes" : 4096,
                "thread_cache_free_bytes" : 543031184,
                "aggressive_memory_decommit" : 0,
                "pageheap_committed_bytes" : NumberLong("18330652672"),
                "pageheap_scavenge_count" : 22937964,
                "pageheap_commit_count" : 31247638,
                "pageheap_total_commit_bytes" : NumberLong("218141866151936"),
                "pageheap_decommit_count" : 23394903,
                "pageheap_total_decommit_bytes" : NumberLong("218123535499264"),
                "pageheap_reserve_count" : 9872,
                "pageheap_total_reserve_bytes" : NumberLong("34201272320"),
                "spinlock_total_delay_ns" : NumberLong("113428202936"),
Secondary,
mgset-25489817:SECONDARY> db.serverStatus().tcmalloc
{
        "generic" : {
                "current_allocated_bytes" : NumberLong("16552694552"),
                "heap_size" : NumberLong("33373687808")
        },
        "tcmalloc" : {
                "pageheap_free_bytes" : NumberLong("11787452416"),
                "pageheap_unmapped_bytes" : NumberLong("4039823360"),
                "max_total_thread_cache_bytes" : NumberLong(1073741824),
                "current_total_thread_cache_bytes" : 113279256,
                "total_free_bytes" : 993717480,
                "central_cache_free_bytes" : 879823248,
                "transfer_cache_free_bytes" : 614976,
                "thread_cache_free_bytes" : 113279256,
                "aggressive_memory_decommit" : 0,
                "pageheap_committed_bytes" : NumberLong("29333864448"),
                "pageheap_scavenge_count" : 2605518,
                "pageheap_commit_count" : 4694997,
                "pageheap_total_commit_bytes" : NumberLong("672231747584"),
                "pageheap_decommit_count" : 3544502,
                "pageheap_total_decommit_bytes" : NumberLong("642897883136"),
                "pageheap_reserve_count" : 25284,
                "pageheap_total_reserve_bytes" : NumberLong("33373687808"),
                "spinlock_total_delay_ns" : NumberLong("3132393632"),
We focus on the output items of *'free'bytes, where,
- Page heap_free_bytes: number of bytes in free, mapped pages in page heap. These bytes can be used to fully allocate requests. They always count towards virtual memory usage, and unless the underlying memory is swap ped out by the OS
- Total ﹐ free ﹐ bytes = Central ﹐ cache ﹐ free ﹐ bytes + transfer ﹐ cache ﹐ free ﹐ bytes + thread ﹐ cache ﹐ free ﹐ bytes. Note that this total ﹐ free ﹐ bytes does not contain pageheap ﹐ free ﹐ bytes. See tcmalloc Code
- So if you want to see how much memory tcmalloc cache has, you need to see pageheap ﹣ free﹣ bytes + total ﹣ free﹣ bytes
Finally, by comparing the serverStatus output of Secondary and Primary, we can see that the total free bytes are about 1GB, but pageheap free bytes is about 11GB more than Primary, which is consistent with the RSS difference observed at the previous OS level.
The meaning of central ﹐ cache ﹐ free ﹐ bytes, thread ﹐ cache ﹐ free ﹐ bytes, thread ﹐ cache ﹐ free ﹐ bytes is also listed. There is no explanation in this code. It can be found elsewhere,
- central_cache_free_bytes, Number of free bytes in the central cache that have been assigned to size classes. They always count towards virtual memory usage, and unless the underlying memory is swapped out by the OS, they also count towards physical memory usage. This property is not writable.
- transfer_cache_free_bytes, Number of free bytes that are waiting to be transfered between the central cache and a thread cache. They always count towards virtual memory usage, and unless the underlying memory is swapped out by the OS, they also count towards physical memory usage. This property is not writable.
- thread_cache_free_bytes, Number of free bytes in thread caches. They always count towards virtual memory usage, and unless the underlying memory is swapped out by the OS, they also count towards physical memory usage. This property is not writable.
optimization
Alibaba cloud MongoDB implements a tcmalloc release command (which can be executed at the back end and is not provided to external users). Behind it is to call the release freememory() of tcmalloc to recycle the PageHeap. However, this command will lock the entire PageHeap during execution, which may cause other requests to allocate memory to hang. Be careful when executing online. In addition, if the memory of this cache is not particularly sensitive, it is not recommended to execute. After all, it is not really wasted, and it also reduces the number of subsequent calls to the system.
In addition, this method does not affect Central Cache and Thread Cache. As for the strategy and timing of memory return operation system of tcmalloc cache, it is quite complicated. Please refer to this for details Article.
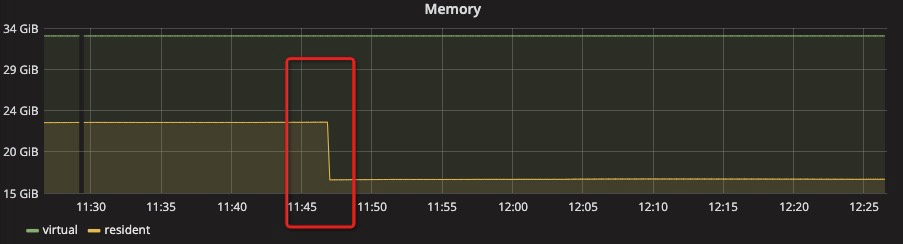
When we execute the command db.adminCommand({tcmallocRelease: 1}) on the Hidden node of the above example, we can see that pageheap ﹣ free ﹣ bytes has decreased by more than 90%,
before,
mgset-25489817:SECONDARY> db.serverStatus().tcmalloc
{
        "generic" : {
                "current_allocated_bytes" : NumberLong("16549856240"),
                "heap_size" : NumberLong("34105942016")
        },
        "tcmalloc" : {
                "pageheap_free_bytes" : NumberLong("7499571200"),
                "pageheap_unmapped_bytes" : NumberLong("9387900928"),
                "max_total_thread_cache_bytes" : NumberLong(1073741824),
                "current_total_thread_cache_bytes" : 133710112,
                "total_free_bytes" : 668613648,
                "central_cache_free_bytes" : 534325360,
                "transfer_cache_free_bytes" : 578176,
                "thread_cache_free_bytes" : 133710112,
after,
mgset-25489817:SECONDARY> db.serverStatus().tcmalloc
{
        "generic" : {
                "current_allocated_bytes" : NumberLong("16546167280"),
                "heap_size" : NumberLong("34105942016")
        },
        "tcmalloc" : {
                "pageheap_free_bytes" : 38395904,
                "pageheap_unmapped_bytes" : NumberLong("16852795392"),
                "max_total_thread_cache_bytes" : NumberLong(1073741824),
                "current_total_thread_cache_bytes" : 134981800,
                "total_free_bytes" : 668583440,
                "central_cache_free_bytes" : 533437608,
                "transfer_cache_free_bytes" : 164032,
                "thread_cache_free_bytes" : 134981800,
Official JIRA Issue
We checked several of them, but we focused on this, https://jira.mongodb.org/browse/SERVER-37541 This issue is actually a summary of the issues discussed here today, mainly including two reasons,
- Fragmentation, which is caused by fragmentation, is a big problem Bruce Lucas Opened one. jira , but the mongodb team reported that it was not on the high priority list, so it was backlog (PS: optimizing the memory fragmentation rate is a worldwide problem, tcmalloc/jemalloc can't be perfect, it may be very difficult to optimize).
- Another is the cache behavior of the memory allocator. When tcmalloc returns memory to the operating system, it is relatively "reductant", and sometimes it will reach a critical point to suddenly return memory, resulting in Performance jitter , you can configure server parameter tcmallocaggregativememorydencommit for more radical memory recycling, but MongoDB team test found that there was a performance problem, so it was not turned on by default.