In many scenarios, the zookeeper cluster is used. For example, it uses its consistency ability and node monitoring ability to realize a variety of business functions.
The problem encountered this time is that the zookeeper disk util is too high.
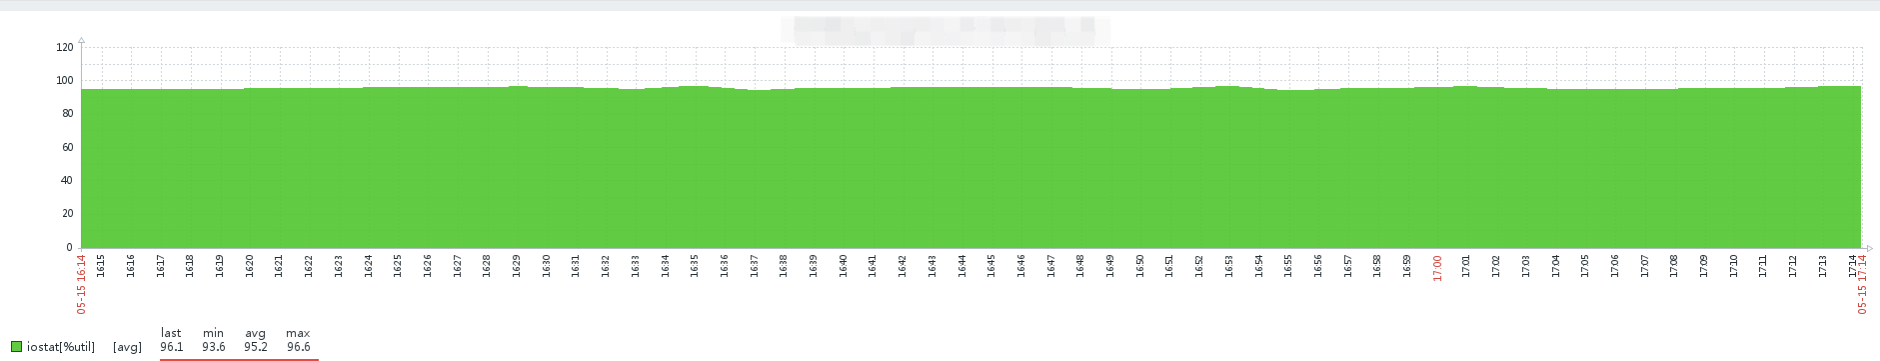
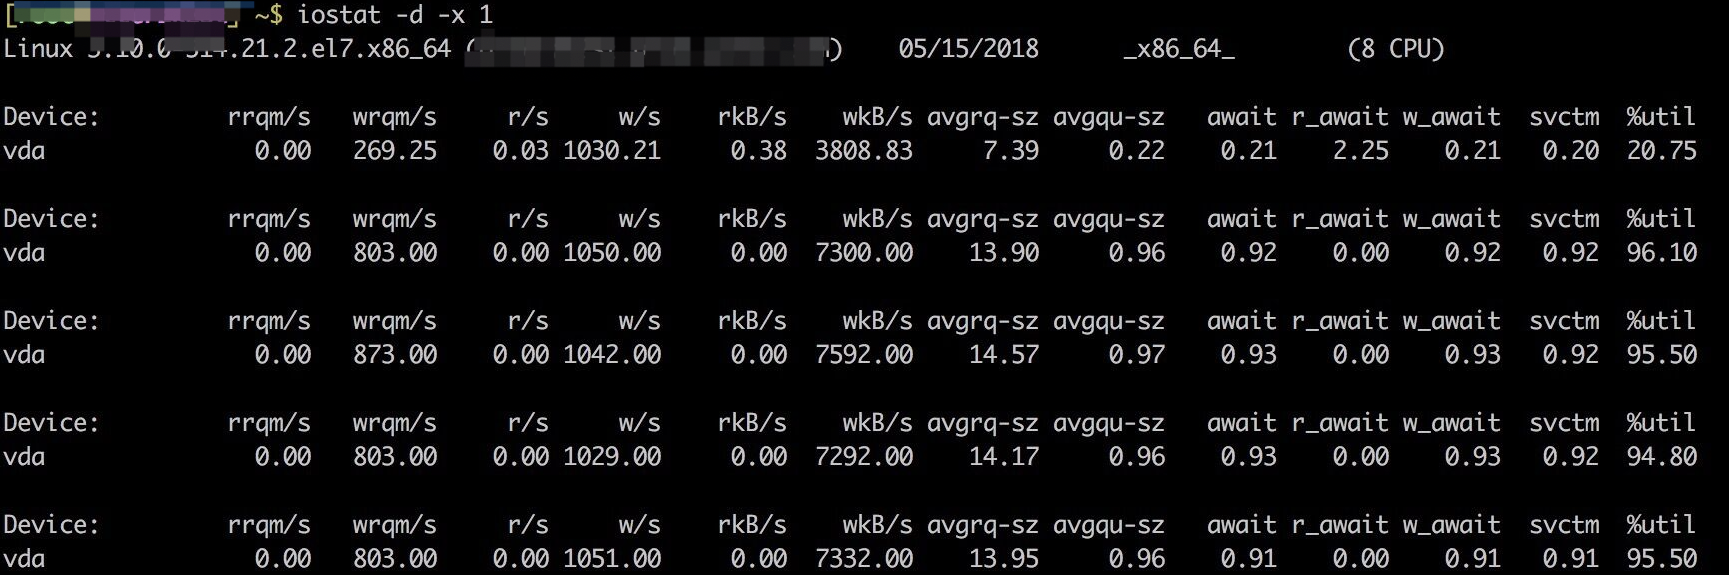
First view the await index and util index of the disk through iostat, as shown in the following figure: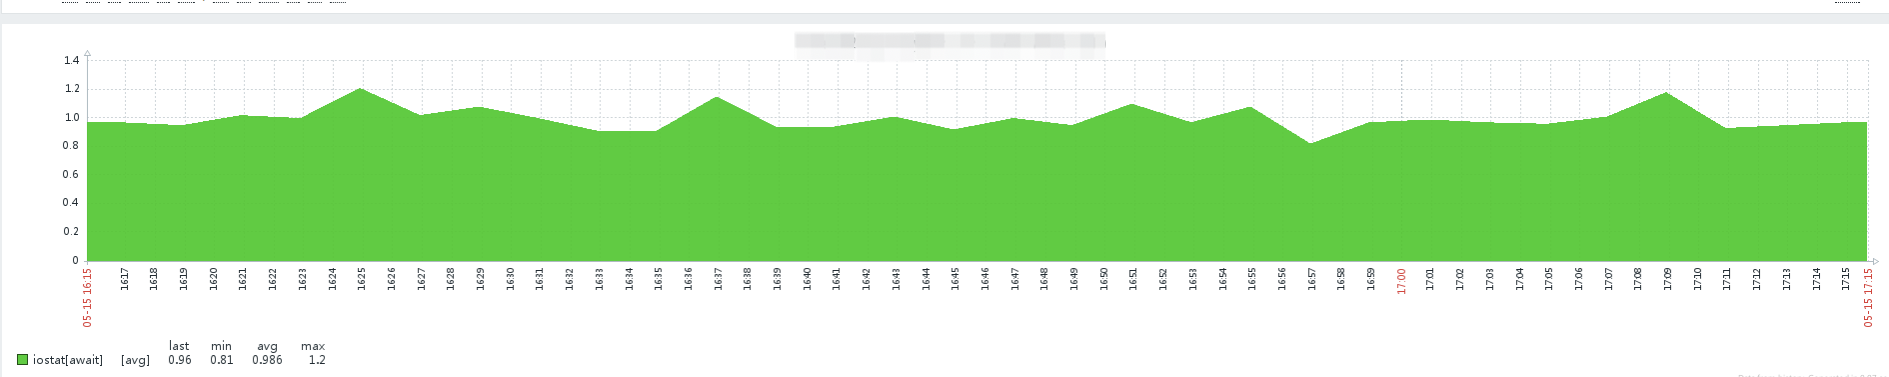
await: the average processing time (in microseconds and milliseconds) of each IO request. It can be understood here as the IO response time. Generally, the system IO response time should be less than 5ms. If it is greater than 10ms, it is relatively large.
%Util: all processing IO time in the statistical time, divided by the total statistical time. For example, if the statistics interval is 1 second, the device is processing io for 0.8 seconds and idle for 0.2 seconds, then the% util = 0.8/1 = 80% of the device, so this parameter implies the busy degree of the device. Generally, if the parameter is 100%, it means that the device is close to full load (of course, if there are multiple disks, even if% util is 100%, the disk usage may not reach the bottleneck because of the concurrency of the disks).
To view the machine configuration on the line:
~$ echo conf | nc xxx 2181
clientPort=2181
dataDir=/data0/zookeeper/version-2
dataLogDir=/data0/zookeeper/version-2
tickTime=2000
maxClientCnxns=60
minSessionTimeout=4000
maxSessionTimeout=40000
serverId=22
initLimit=10
syncLimit=5
electionAlg=3
electionPort=3888
quorumPort=2888
peerType=0
Solution ideas
dataDir=/data
dataLogDir=/datalog
If dataLogDir is not provided, dataDir is used. The persistence of zookeeper is stored in both directories. dataLogDir is the sequential log (WAL) that is placed in the. In the dataDir, there is a snapshot of the memory data structure, which is convenient for rapid recovery. In order to maximize performance, it is generally recommended to divide dataDir and dataLogDir into different disks, so as to make full use of the sequential write feature of disks.
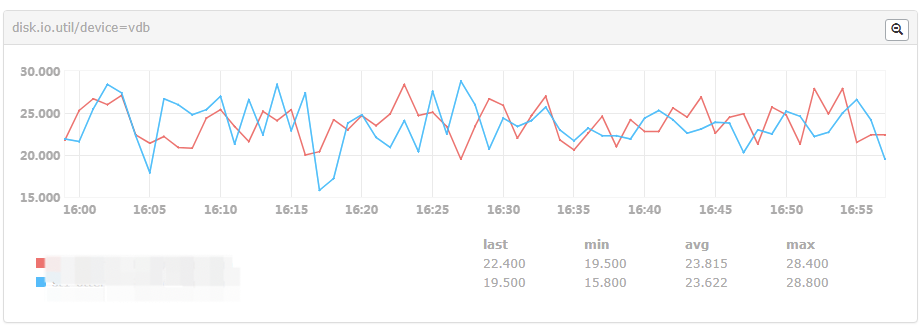
Hang one more disk and separate the snapshot and log. The change was made at 17:36, and util decreased by 3 percentage points. The effect is not ideal, as shown in the following figure
The main pressure is on the transaction log dataLogDir, as shown in the following figure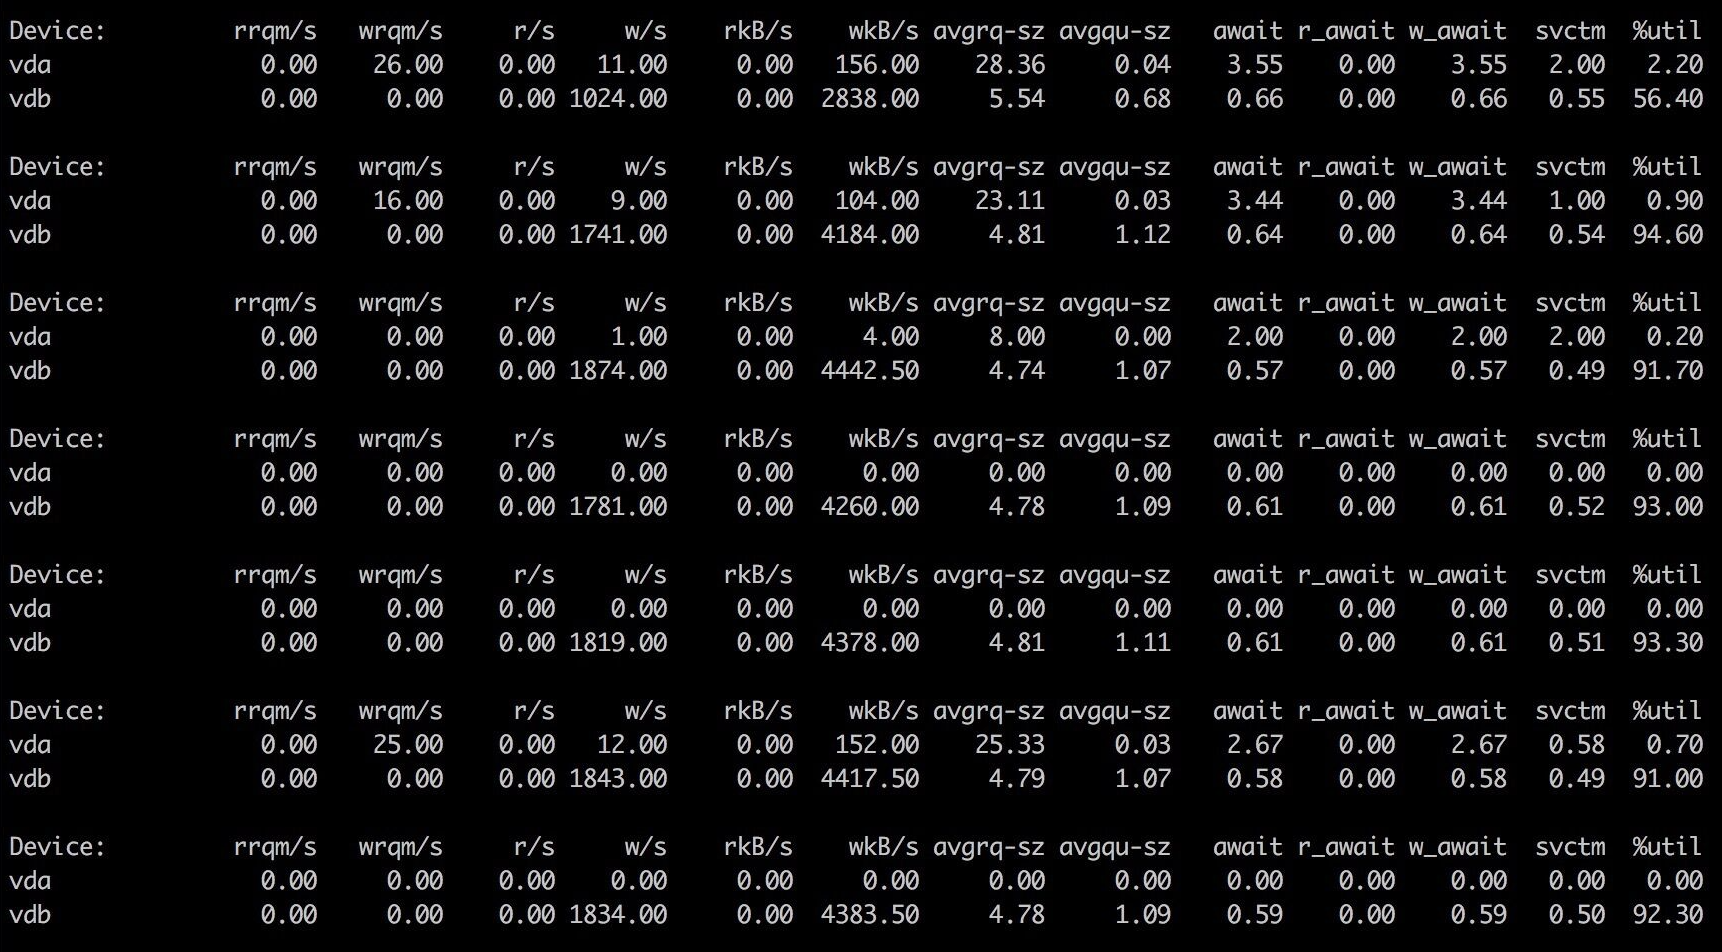
Where vda corresponds to / data0 and vdb corresponds to / data1
In fact, the list of log files under the zk data path in the test environment can be predicted
total 219M
-rw-r--r-- 1 root root  65M May 15 18:39 log.18ddb6a1
-rw-r--r-- 1 root root  65M May 15 18:45 log.18deff56
-rw-r--r-- 1 root root  65M May 15 18:47 log.18e073c0
-rw-r--r-- 1 root root  65M May 15 18:49 log.18e18db7
-rw-r--r-- 1 root root  65M May 15 18:53 log.18e28415
-rw-r--r-- 1 root root  65M May 15 18:55 log.18e401c6
-rw-r--r-- 1 root root  65M May 15 18:58 log.18e520c8
-rw-r--r-- 1 root root  65M May 15 19:00 log.18e62b32
-rw-r--r-- 1 root root  65M May 15 19:05 log.18e71067
-rw-r--r-- 1 root root  65M May 15 19:09 log.18e870b7
-rw-r--r-- 1 root root  65M May 15 19:15 log.18e9d86a
-rw-r--r-- 1 root root  65M May 15 19:18 log.18eb58bb
-rw-r--r-- 1 root root  65M May 15 19:20 log.18ec98ef
-rw-r--r-- 1 root root  65M May 15 19:23 log.18ed7fe9
-rw-r--r-- 1 root root  65M May 15 19:25 log.18ee9709
-rw-r--r-- 1 root root  65M May 15 19:28 log.18ef6b2a
-rw-r--r-- 1 root root 164K May 15 18:39 snapshot.18deff54
-rw-r--r-- 1 root root 164K May 15 18:45 snapshot.18e073bd
-rw-r--r-- 1 root root 164K May 15 18:47 snapshot.18e18db5
-rw-r--r-- 1 root root 165K May 15 18:49 snapshot.18e28411
-rw-r--r-- 1 root root 165K May 15 18:53 snapshot.18e401c4
-rw-r--r-- 1 root root 165K May 15 18:55 snapshot.18e520c3
-rw-r--r-- 1 root root 164K May 15 18:58 snapshot.18e62b2c
-rw-r--r-- 1 root root 165K May 15 19:00 snapshot.18e71065
-rw-r--r-- 1 root root 165K May 15 19:05 snapshot.18e870b4
-rw-r--r-- 1 root root 164K May 15 19:09 snapshot.18e9d867
-rw-r--r-- 1 root root 164K May 15 19:15 snapshot.18eb58b9
-rw-r--r-- 1 root root 165K May 15 19:18 snapshot.18ec98ec
-rw-r--r-- 1 root root 164K May 15 19:20 snapshot.18ed7fe7
-rw-r--r-- 1 root root 165K May 15 19:23 snapshot.18ee9705
-rw-r--r-- 1 root root 165K May 15 19:25 snapshot.18ef6b28
It can be seen that the log file size accounts for more than 90%.
| parameter | explain |
|---|---|
| dataDir | That is, the data in memory is stored in the directory of the snapshot file snapshot, and myid is also stored in this directory (the content in myid is the ID of the local server service). Writing snapshots does not require a separate disk, and background threads are used to asynchronously write data to disk, so it will not affect memory data. By default, the transaction log is also stored here. It is recommended to configure the parameter dataLogDir at the same time. The write performance of transaction log directly affects zk performance. |
| dataLogDir | Transaction log output directory. Try to configure a separate disk or mount point for the transaction log output, which will greatly improve ZK performance. Since the transaction log output is written to the disk sequentially and synchronously, the follower and leader will be triggered to send back the transaction log confirmation message only after the log is written from the disk (zk transaction is committed in two stages), a separate disk is required to avoid slow writing of the transaction log or no writing stored in the cache due to random reading and writing and disk cache. |
This path does not solve the problem, but another solution is mentioned in Article 2 - write memory:
Zookeeper has two kinds of logs, one is snapshot and the other is log. The problem lies in the transaction log.
Write memory, / dev/shm is an area divided by the system memory. The default size is half of the system memory, which can be seen through df -h.
We can write the transaction log here and mount a single SSD. That's not enough. It's a matter of money.
Here I finally choose the way to write memory.
Since our system is a basic component, data cannot be lost, so we can't use the way of writing memory.
At present, our machine comes from Tencent cloud. The machine disk is attached to the cloud disk. We plan to attach an additional SSD disk to store zk's transaction log.
View disk write performance
~$ time dd if=/dev/zero of=/data/test.dbf bs=1M count=10000
10000+0 records in
10000+0 records out
10485760000 bytes (10 GB) copied, 48.5508 s, 216 MB/s

real    0m48.552s
user    0m0.007s
sys     0m13.156s
Check whether the disk is an SSD disk
cat /sys/block/sda/queue/rotational
be careful:
sba in the command is your disk name. You can view the disk through the df command, and then modify it to what you want.
result:
Return 0: SSD disk
Return 1: SATA disk
Or, use the following command to look at the fourth column, but there is no output on Tencent cloud machine
# lsscsi
[0:0:0:0] disk SEAGATE ST3300657SS ES62 -
[0:0:1:0] disk ATA INTEL SSDSA2CW16 0362 /dev/sda
[0:0:2:0] disk ATA INTEL SSDSA2CW16 0362 /dev/sdb
[0:0:3:0] disk ATA INTEL SSDSA2CW16 0362 /dev/sdc
[0:1:0:0] disk Dell VIRTUAL DISK 1028 /dev/sdd
[3:0:0:0] cd/dvd TEAC DVD-ROM DV-28SW R.2A /dev/sr0
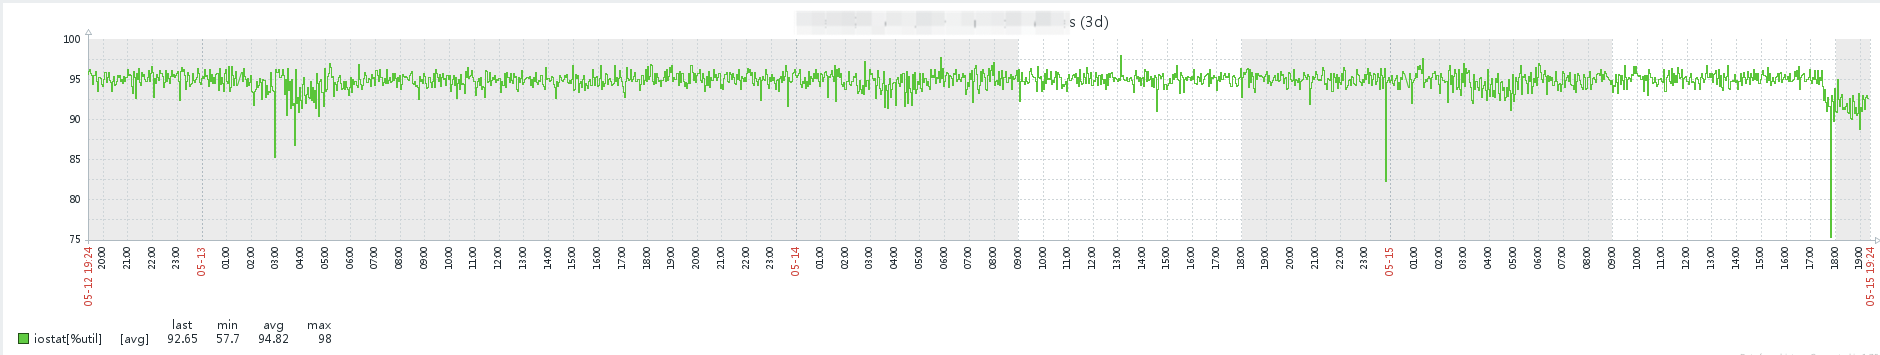
After replacing with SSD disk, the util index of zk machine is as follows, which has been controlled to a reasonable range:
Quoted articles:
Linux iostat monitors IO status http://www.orczhou.com/index.php/2010/03/iostat-detail/
Solve the problem that Zookeeper occupies too much IO https://www.good21.com/2017/03/01/fix-zookeeper-io/
Why does zookeeper cause high disk IO http://woodding2008.iteye.com/blog/2327100
Configuration of Zookeeper http://www.cnblogs.com/yuyijq/p/3438829.html
ZooKeeper configuration details https://my.oschina.net/xiaotian120/blog/194820
Introduction and evaluation of SATA SAS SSD hard disk https://blog.csdn.net/chen_fly2011/article/details/56665537
linux checks whether the disk is an SSD disk http://www.linuxdiyf.com/linux/21437.html
Check whether it is a solid state drive (SSD) in Linux https://blog.csdn.net/justlinux2010/article/details/10333921