Source: https://zhenbianshu.github.io/
Some time ago, our service encountered a performance bottleneck. Due to the urgent demand in the early stage, we didn't pay attention to the optimization in this regard. It's very painful to pay off the technical debt.
Under very low QPS pressure, the server load can reach 10-20, the CPU utilization rate is more than 60%, and a large number of errors will be reported by the interface at each traffic peak. Although the service fusing framework Hystrix is used, the service cannot be recovered after fusing. Every time I change the online, I am worried that it will become the last straw to crush the camel, leading to a service avalanche.
After the demand finally slowed down, the leader set a goal for us to completely solve the service performance problem within two weeks. In the past two weeks of troubleshooting and combing, several performance bottlenecks were found and solved, and the system fusing scheme was modified. Finally, the QPS that the service can handle was doubled, the service can fuse normally under extremely high QPS (3-4 times) pressure, and can quickly return to normal after the pressure was reduced. The following is the troubleshooting and solution process of some problems.
Server high CPU, high load
The first problem to be solved is that the service leads to high overall load and high CPU of the server.
Our service as a whole can be summarized as obtaining a batch of data from a storage or remote call, then performing various fancy transformations on this batch of data, and finally returning. Due to the long process of data transformation and many operations, it will be normal for the system CPU to be higher, but it is still exaggerated that the CPU us is more than 50% under normal circumstances.
As we all know, you can use the top command to query the CPU and memory usage of each process in the system on the server. However, the JVM is the domain of Java applications. What tools should be used to check the resource occupation of each thread in the JVM?
jmc is OK, but it is cumbersome to use. It requires a series of settings. Another option is to use jtop. Jtop is just a jar package. Its project address is yujikiriki/jtop. We can easily copy it to the server. After obtaining the pid of the java application, use java -jar jtop.jar [options] to output the JVM internal statistics.
jtop will use the default parameter - stack n to print out the five thread stacks that consume the most CPU.
The shape is as follows:
Heap Memory: INIT=134217728  USED=230791968  COMMITED=450363392  MAX=1908932608
NonHeap Memory: INIT=2555904  USED=24834632  COMMITED=26411008  MAX=-1
GC PS Scavenge  VALID  [PS Eden Space, PS Survivor Space]  GC=161  GCT=440
GC PS MarkSweep  VALID  [PS Eden Space, PS Survivor Space, PS Old Gen]  GC=2  GCT=532
ClassLoading LOADED=3118  TOTAL_LOADED=3118  UNLOADED=0
Total threads: 608  CPU=2454 (106.88%)  USER=2142 (93.30%)
NEW=0  RUNNABLE=6  BLOCKED=0  WAITING=2  TIMED_WAITING=600  TERMINATED=0

main  TID=1  STATE=RUNNABLE  CPU_TIME=2039 (88.79%)  USER_TIME=1970 (85.79%) Allocted: 640318696
    com.google.common.util.concurrent.RateLimiter.tryAcquire(RateLimiter.java:337)
    io.zhenbianshu.TestFuturePool.main(TestFuturePool.java:23)

RMI TCP Connection(2)-127.0.0.1  TID=2555  STATE=RUNNABLE  CPU_TIME=89 (3.89%)  USER_TIME=85 (3.70%) Allocted: 7943616
    sun.management.ThreadImpl.dumpThreads0(Native Method)
    sun.management.ThreadImpl.dumpAllThreads(ThreadImpl.java:454)
    me.hatter.tools.jtop.rmi.RmiServer.listThreadInfos(RmiServer.java:59)
    me.hatter.tools.jtop.management.JTopImpl.listThreadInfos(JTopImpl.java:48)
    sun.reflect.NativeMethodAccessorImpl.invoke0(Native Method)

    ... ...
By observing the thread stack, we can find the code points to be optimized.
In our code, we found many CPU consuming points in json serialization and deserialization and Bean replication. Then, through code optimization, we greatly reduced the CPU pressure by improving the reuse rate of beans and using PB instead of json.
Fuse frame optimization
For the service fusing framework, we chose Hystrix. Although it has announced that it will no longer be maintained, resilience4j and Alibaba's open source sentinel are more recommended. However, because the technology stack in the Department is Hystrix and it has no obvious shortcomings, we continue to use it.
First, let's introduce the basic situation. We added the Hystrix annotation at the outermost and inner RPC calls of the controller interface. The isolation mode is thread pool mode. The timeout time at the interface is set to 1000ms, the maximum number of threads is 2000, the timeout time of internal RPC calls is set to 200ms, and the maximum number of threads is 500.
Abnormal response time
The first problem to be solved is that the response time of the interface is abnormal. When observing the access log of the interface, it can be found that the interface has requests that take 1200ms, and some even reach more than 2000ms. In the thread pool mode, Hystrix will use an asynchronous thread to execute real business logic, while the main thread is always waiting. Once the waiting times out, the main thread can return immediately. Therefore, the interface takes more time than the timeout. The problem is likely to occur in the Hystrix framework layer, Spring framework layer or system layer.
Recommend a basic Spring Boot tutorial and practical example: https://github.com/javastacks/spring-boot-best-practice
At this time, the runtime thread stack can be analyzed. I use jstack to print the thread stack, and make the results of multiple printing into a flame diagram (see application debugging tool - Flame diagram) for observation.
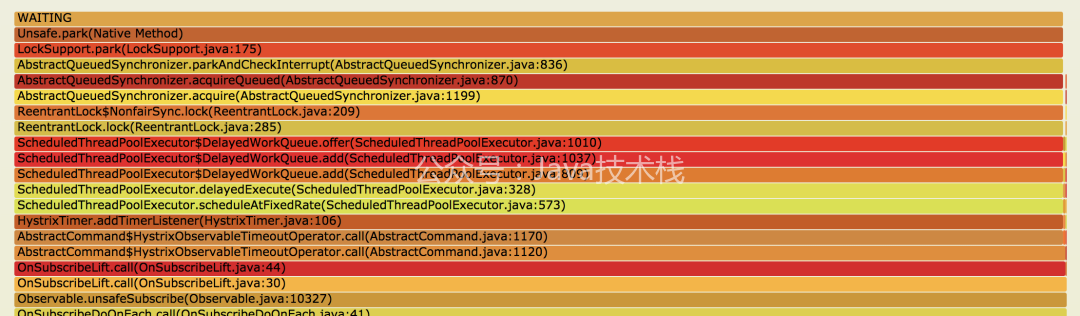
As shown in the figure above, we can see that many threads stop at LockSupport.park(LockSupport.java:175), and these threads are locked. Looking down, we find that the source is HystrixTimer.addTimerListener(HystrixTimer.java:106), and then down is our business code.
The Hystrix annotation explains that these timerlisteners are used by Hystrix command to handle asynchronous thread timeout. They will execute when the call times out and return the timeout result. When the number of calls is large, setting these timerlisteners will be blocked due to locks, resulting in the timeout set by the interface not taking effect.
Then check why TimerListener has a large number of calls.
Because the service depends on the same RPC return value in multiple places, the average interface response will obtain the same value 3-5 times, so LocalCache is added to the RPC return value in the interface. After checking the code, it is found that the HystrixCommand is added to the get method of LocalCache. Therefore, when the stand-alone QPS is 1000, the method will be called 3000-5000 times through the Hystrix, resulting in a large number of Hystrix timerlisteners.
The code is similar to:
@HystrixCommand(
        fallbackMethod = "fallBackGetXXXConfig",
        commandProperties = {
                @HystrixProperty(name = "execution.isolation.thread.timeoutInMilliseconds", value = "200"),
                @HystrixProperty(name = "circuitBreaker.errorThresholdPercentage", value = "50")},
        threadPoolProperties = {
                @HystrixProperty(name = "coreSize", value = "200"),
                @HystrixProperty(name = "maximumSize", value = "500"),
                @HystrixProperty(name = "allowMaximumSizeToDivergeFromCoreSize", value = "true")})
public XXXConfig getXXXConfig(Long uid) {
    try {
        return XXXConfigCache.get(uid);
    } catch (Exception e) {
        return EMPTY_XXX_CONFIG;
    }
}
Modify the code and modify the HystrixCommand to the load method of localCache to solve this problem. In addition, in order to further reduce the impact of the Hystrix framework on performance, the isolation strategy of the Hystrix is changed to the semaphore mode, and then the maximum time consumption of the interface is stable. Moreover, because the methods are executed in the main thread, the maintenance of the Hystrix thread pool and the context switching between the main thread and the Hystrix thread are less, and the CPU utilization of the system is further reduced.
However, when using the semaphore isolation mode, we should also pay attention to a problem: semaphores can only limit whether the method can enter the execution. After the method returns, we can judge whether the interface times out and process the timeout, but we can't interfere with the methods that are already executing. This may lead to a request timeout and occupy a semaphore all the time, but the framework can't process it.
Service isolation and degradation
Another problem is that the service cannot be degraded and fused in the expected way. We believe that the traffic should continue to fuse under very large circumstances, while the Hystrix is occasionally fused.
When we first debugged the fuse parameters of Hystrix, we used the log observation method. Because the log is set to asynchronous, we can't see the real-time log, and there are a lot of error information interference, so the process is inefficient and inaccurate. Later, the visual interface of Hystrix was introduced to improve the debugging efficiency.
The Hystrix visualization mode is divided into server and client. The server is the service we want to observe. We need to introduce the Hystrix Metrics event stream package into the service and add an interface to output Metrics information, then start the Hystrix dashboard client and fill in the server address.
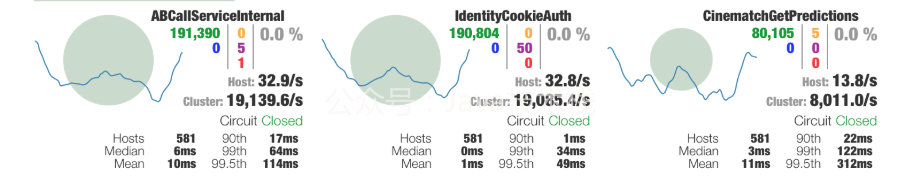
Through the visual interface similar to the above figure, the overall state of Hystrix is displayed very clearly.
Due to the above optimization, the maximum response time of the interface has been completely controllable. The fusing strategy of the interface can be modified by strictly limiting the concurrency of interface methods. Assuming that the maximum interface average response time that we can tolerate is 50ms and the maximum QPS that the service can accept is 2000, we can get the appropriate semaphore limit through 2000 * 50 / 1000 = 100. If there are too many rejected errors, we can add some redundancy.
In this way, in case of sudden change of traffic, the total number of requests accepted by the interface can be controlled by rejecting some requests. In these total requests, the maximum time consumption is strictly limited. If the number of errors is too large, it can also be degraded by fusing. Multiple strategies can be carried out at the same time to ensure the average response time of the interface.
Failure to recover due to high load during fusing
Next, we need to solve the problem that the service load continues to rise when the interface is blown, but the service cannot be recovered after the QPS pressure is reduced.
When the server load is particularly high, it is unreliable to use various tools to observe the internal state of the service, because the observation generally adopts the way of management and collection, and the service has been changed while observing the service. For example, when jtop is used to view the thread with the highest CPU consumption under high load, the result obtained is always the stack related to JVM TI.
However, by observing the outside of the service, it can be found that a large number of error logs will be output at this time. The service has been stable for a long time, and the previous error logs are printed. The delay unit is even in minutes. A large number of error logs not only cause I/O pressure, but also the acquisition of thread stack and the allocation of log memory will increase the pressure on the server. Moreover, because of the large amount of logs, the service has been changed to asynchronous logs, which makes the barrier of blocking threads through I/O disappear.
Then modify the log record point in the service, no longer print the exception stack when printing the log, and then rewrite the exception handler of the Spring framework to completely reduce the output of the log. The results are in line with expectations. When the number of errors is very large, the log output is also controlled in the normal range. In this way, after fusing, the log will not increase the pressure on the service. Once the QPS pressure drops and the fusing switch is turned off, the service can quickly return to the normal state.
Spring data binding exception
In addition, when looking at the thread stack output by jstack, I accidentally found a strange stack.
at java.lang.Throwable.fillInStackTrace(Native Method)
at java.lang.Throwable.fillInStackTrace(Throwable.java:783)
  - locked <0x00000006a697a0b8> (a org.springframework.beans.NotWritablePropertyException)
  ...
org.springframework.beans.AbstractNestablePropertyAccessor.processLocalProperty(AbstractNestablePropertyAccessor.java:426)
at org.springframework.beans.AbstractNestablePropertyAccessor.setPropertyValue(AbstractNestablePropertyAccessor.java:278)
  ...
at org.springframework.validation.DataBinder.doBind(DataBinder.java:735)
at org.springframework.web.bind.WebDataBinder.doBind(WebDataBinder.java:197)
at org.springframework.web.bind.ServletRequestDataBinder.bind(ServletRequestDataBinder.java:107)
at org.springframework.web.method.support.InvocableHandlerMethod.getMethodArgumentValues(InvocableHandlerMethod.java:161)
 ...
at org.springframework.web.servlet.DispatcherServlet.doDispatch(DispatcherServlet.java:991)
In one output of jstack, you can see that the top of the stack of multiple threads stays in Spring's exception handling, but at this time, there is no log output and there is no exception in the business. After looking at the follow-up code, Spring secretly caught the exception and did not handle it.
List<PropertyAccessException> propertyAccessExceptions = null;
List<PropertyValue> propertyValues = (pvs instanceof MutablePropertyValues ?
  ((MutablePropertyValues) pvs).getPropertyValueList() : Arrays.asList(pvs.getPropertyValues()));
for (PropertyValue pv : propertyValues) {
try {
  // This method may throw any BeansException, which won't be caught
  // here, if there is a critical failure such as no matching field.
  // We can attempt to deal only with less serious exceptions.
  setPropertyValue(pv);
}
catch (NotWritablePropertyException ex) {
  if (!ignoreUnknown) {
    throw ex;
  }
  // Otherwise, just ignore it and continue...
}
... ...
}
Combined with the code context, it turns out that Spring is processing our controller data binding, and the data to be processed is one of our parameter classes, ApiContext.
The controller code is similar to:
@RequestMapping("test.json")
public Map testApi(@RequestParam(name = "id") String id, ApiContext apiContext) {}
According to the normal routine, we should add a parameter parser (HandlerMethodArgumentResolver) to the ApiContext class, so that Spring will call the parameter parser to generate a parameter of the corresponding type for the method when parsing the parameter. But what would Spring do without such a parameter parser?
The answer is to use the "strange" code above. First create an empty ApiContext class and try to set all the incoming parameters into this class in turn. If set fails, catch the exception and continue to execute. After set succeeds, the parameter binding of an attribute in the ApiContext class is completed.
Unfortunately, the upper layer of our interface will uniformly pass us thirty or forty parameters, so a large number of "binding attempts" will be carried out every time. The resulting exceptions and exception handling will lead to a large number of performance losses. After using the parameter parser to solve this problem, the interface performance has been improved by nearly one tenth.
Summary
Performance optimization does not happen overnight. It is by no means a good choice to pile up technical debts to the last. Usually pay more attention to some code writing methods. When using black technology, pay attention to whether there are any hidden holes in its implementation. You can also conduct regular performance tests to find and solve the unstable factors recently introduced in the code in time.
Recent hot article recommendations:
1.1000 + Java interview questions and answers (2021 latest version)
2.Stop playing if/ else on the full screen. Try the strategy mode. It's really fragrant!!
3.what the fuck! What is the new syntax of xx ≠ null in Java?
4.Spring Boot 2.6 was officially released, a wave of new features..
5.Java development manual (Songshan version) is the latest release. Download it quickly!
Feel good, don't forget to like + forward!