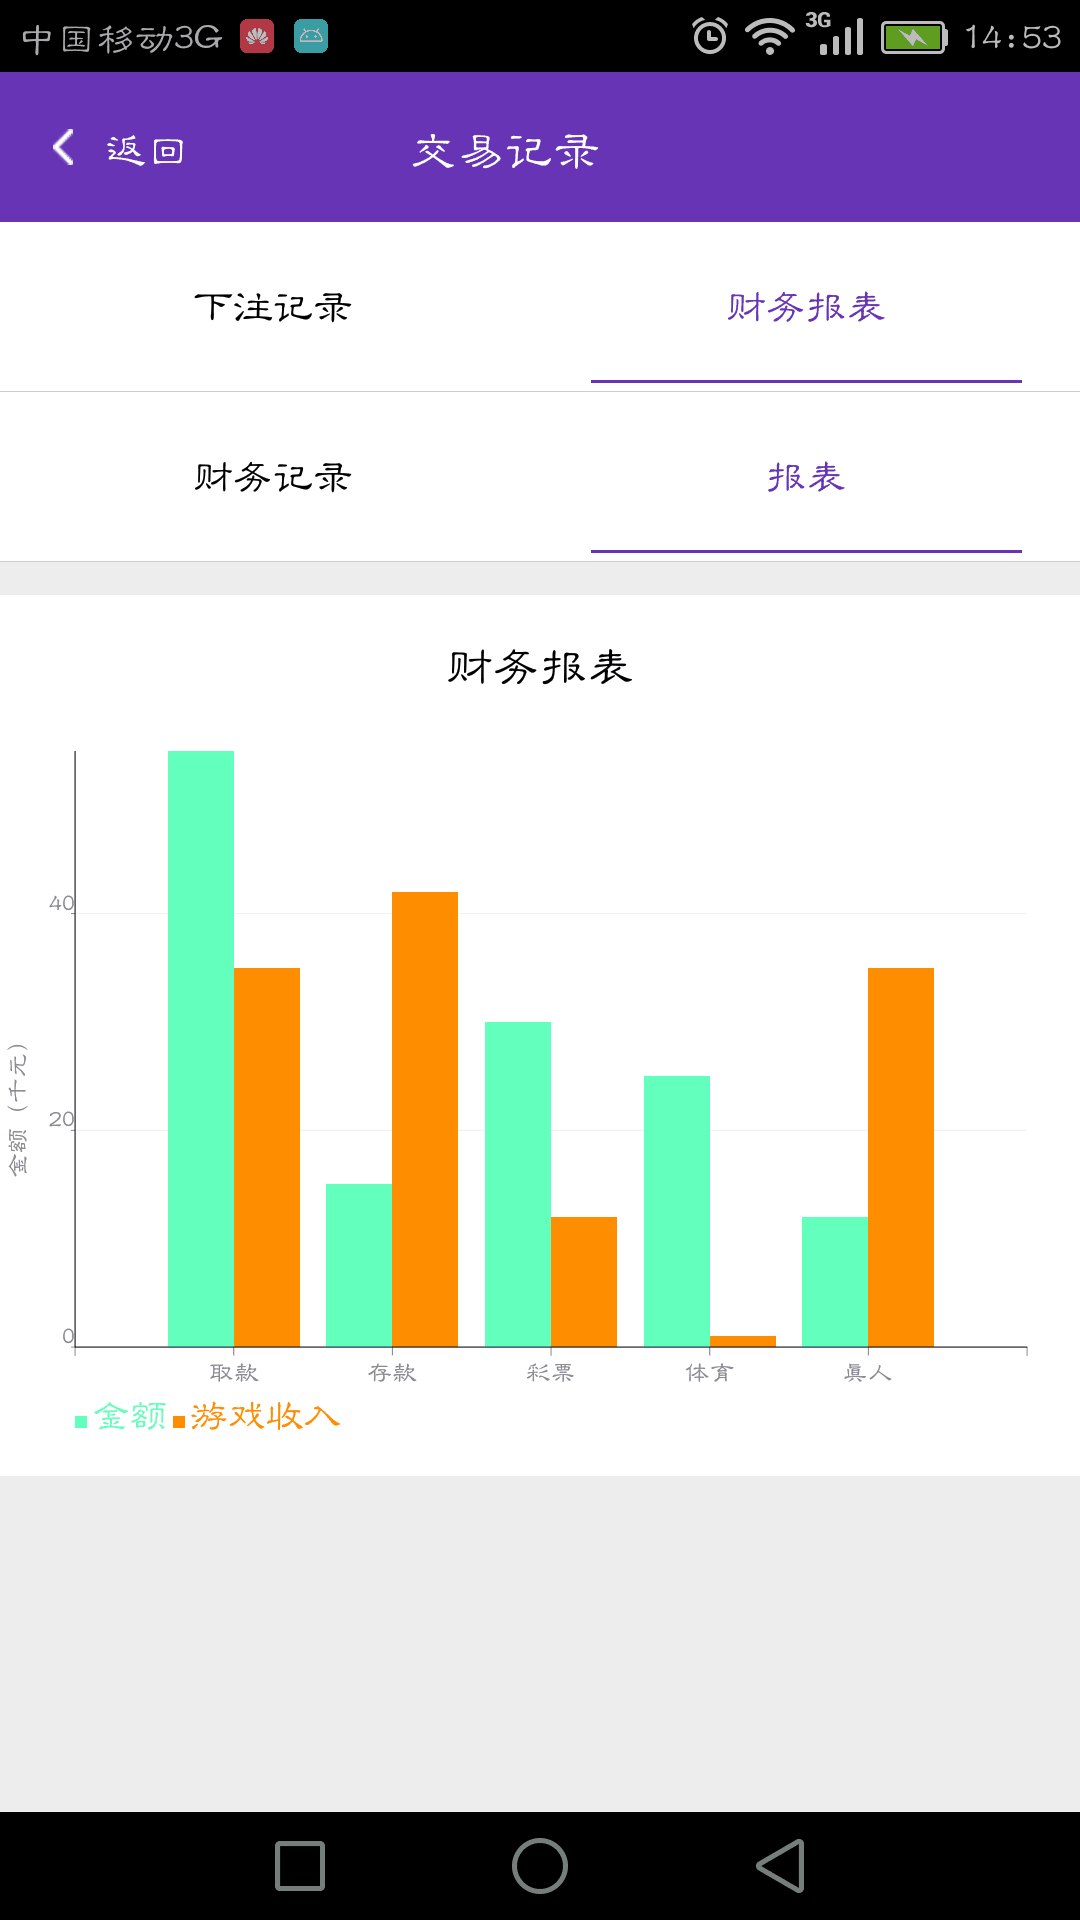
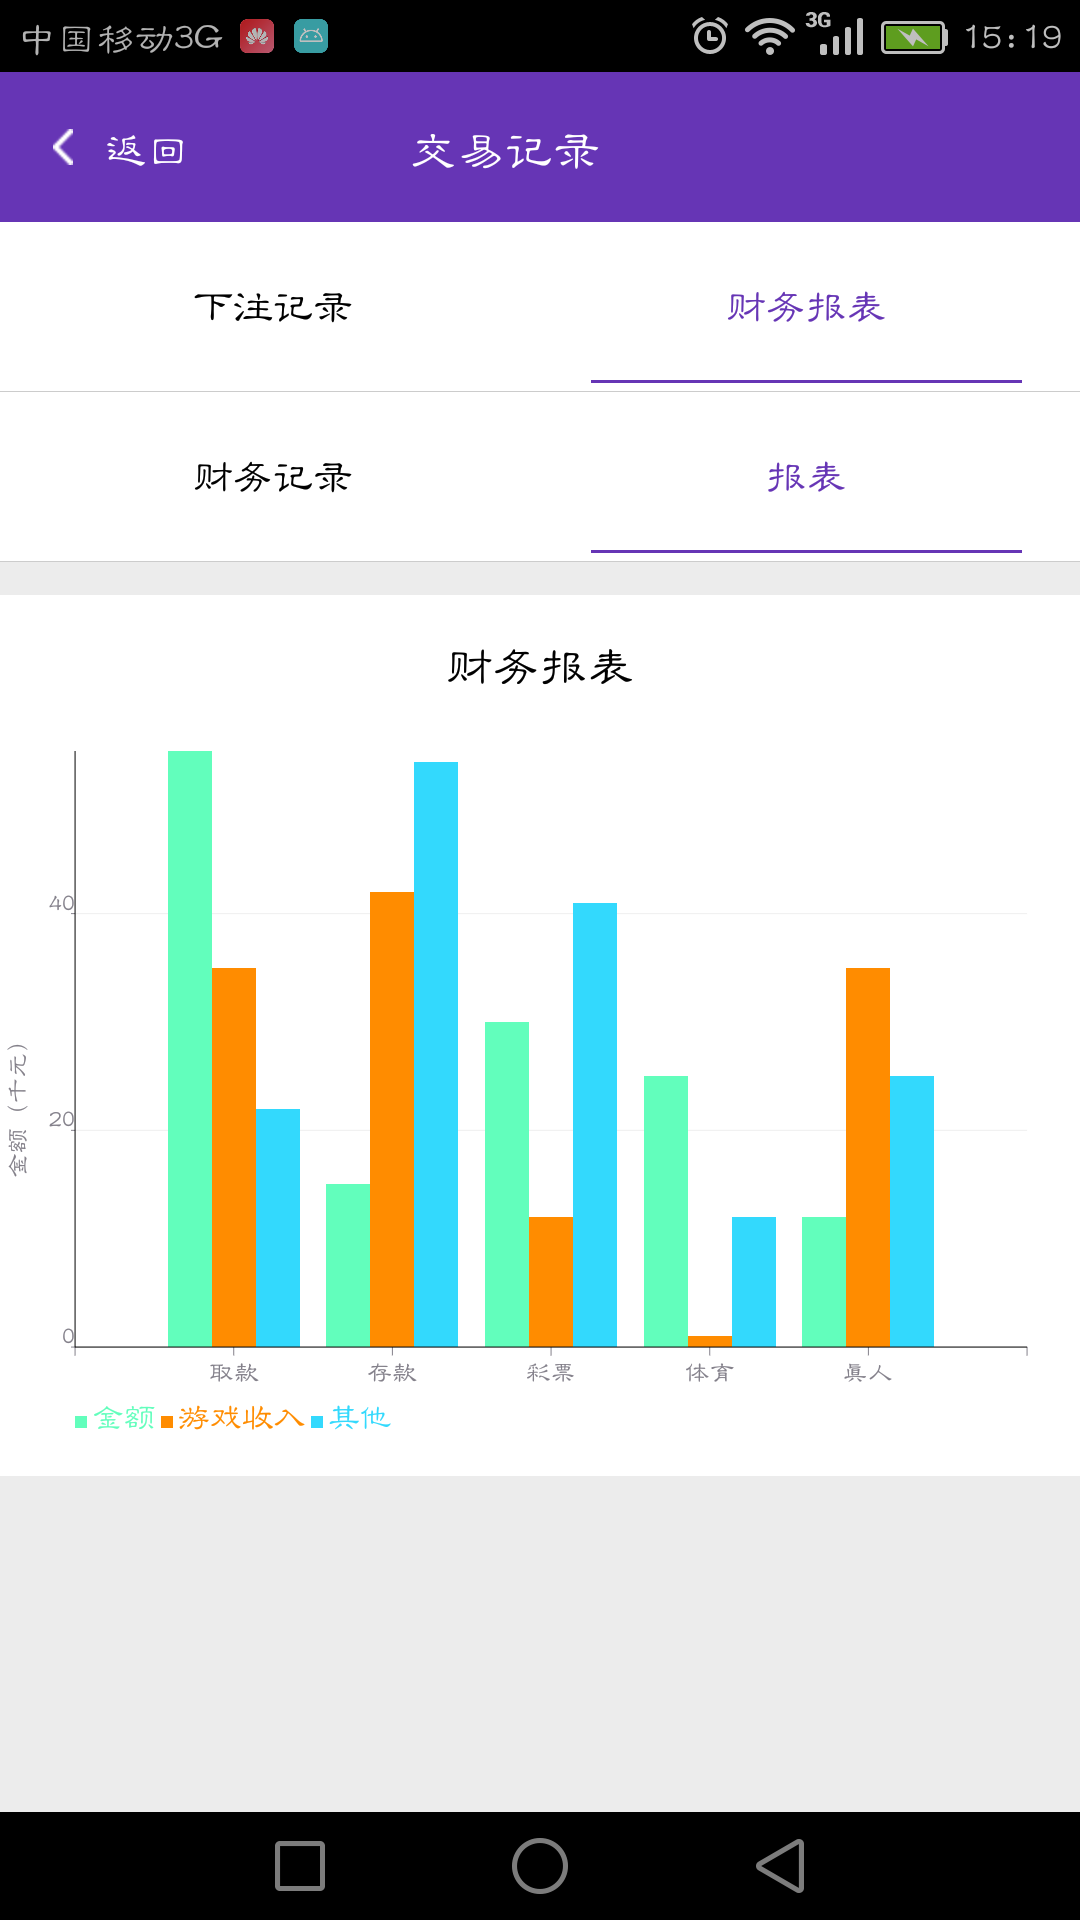
Use achartengine to draw a polygon graph with the following interface effects:
achartengine1.0.0 to 1.2.0 jar package download: Click to open the link
Key code: (copy available after jar import)
//Names of multiple sequences of a histogram
String[] titles = new String[] { "Amount of money", "Game revenue","Other" };
//Store values for multiple series of columns
ArrayList<double[]> value = new ArrayList<double[]>();
double[] d1 = new double[] {0,55,15, 30, 25, 12,0 };
double[] d2 = new double[] {0,35,42, 12, 1, 35,0 };
double[] d3 = new double[] {0,22,54, 41, 12, 25,0 };
value.add(d1);
value.add(d2);
value.add(d3);
//int maxVal1 = ChartUtil.getMaxVal(d1);
//int maxVal2 = ChartUtil.getMaxVal(d2);
//Colors for Multiple Shapes
int[] colors = { R.color.color_reseda, R.color.color_orange2,R.color.color_blue};
//Set the maximum and minimum values for x and y axes
//double[] val = new double[] { 1,
//		7, 0, maxVal1 > maxVal2 ?maxVal1:maxVal2};
int[] xVal = new int[] {1, 2, 3,4,5,6,7};
//Customize the data displayed on the X-axis
String[] xLableVal = new String[]{"","Withdraw money","deposit","lottery","Sports","Real person",""};
//Generate Column view
GraphicalView mGraphicalView = ChartUtil.xychar(titles, value, colors, xLableVal, 5, val, xVal, "", true);
//Add the generated mGraphicalView to the layout you need to display
mLayoutChart.addView(mGraphicalView);

//Call Method
public static GraphicalView xychar(String[] titles, ArrayList<double[]> value,
	int[] colors, String[] xlableVal, int y,double[] range, int []xLable ,String xtitle, boolean f) {
//Multiple Rendering
XYMultipleSeriesRenderer renderer = new XYMultipleSeriesRenderer();
//Layout (top left bottom right) margin
renderer.setMargins(new int[] { 10, 35,20,25 });

//Datasets of multiple sequences
XYMultipleSeriesDataset dataset = new XYMultipleSeriesDataset();
//Building datasets and rendering
for (int i = 0; i < titles.length; i++) {

	XYSeries series = new XYSeries(titles[i]);
	double [] yLable= value.get(i);
	for (int j=0;j< yLable.length;j++) {
		series.add(xLable[j],yLable[j]);
	}
	dataset.addSeries(series);
	XYSeriesRenderer xyRenderer = new XYSeriesRenderer();
	// Set Colors
	xyRenderer.setColor(MyApplication.getCurrentActivity().getResources().getColor(colors[i]));
	// Style points//
	xyRenderer.setPointStyle(PointStyle.SQUARE);
	// Add points to coordinate drawing
	renderer.addSeriesRenderer(xyRenderer);
}
//To display custom labels on the X-axis, first set renderer.setXLabels(0); then we add the renderer.addXTextLabel loop
//Set the number of x-axis labels
renderer.clearXTextLabels();
for (int i = 0; i < xlableVal.length; i++) {
	renderer.addXTextLabel(i+1, xlableVal[i]);;
}
renderer.setXLabels(0);
//Set the number of Y-axis labels
renderer.setYLabels(y);
//Set maximum x-axis
//		renderer.setXAxisMax(x - 0.5);
//Set the color of the axis
renderer.setAxesColor(Color.BLACK);
//Set label alignment for x-axis and y-axis
renderer.setXLabelsAlign(Align.CENTER);
renderer.setYLabelsAlign(Align.RIGHT);
// Set up a realistic grid
renderer.setShowGrid(true);
renderer.setYTitle("Amount (1000 Yuan)");
renderer.setShowAxes(true);
// Set the distance between bars
renderer.setBarSpacing(0.2);
renderer.setInScroll(false);
renderer.setPanEnabled(false, false);
renderer.setClickEnabled(false);
//Set the color of the x- and y-axis labels
renderer.setXLabelsColor(R.color.color_gray);
renderer.setYLabelsColor(0,R.color.color_gray);

int length = renderer.getSeriesRendererCount();
//Set the title of the icon
renderer.setChartTitle(xtitle);
renderer.setChartTitleTextSize(15);
renderer.setLabelsColor(R.color.color_gray);

//Set the font size of the legend
renderer.setLegendTextSize(15);
renderer.setLabelsTextSize(12);
renderer.setShowLegend(true);
// Set Legend Text Size
renderer.setLegendHeight(40);
// Set Axis Label Font Size
renderer.setAxisTitleTextSize(12);

//Set the maximum and minimum values for x and y axes
renderer.setMarginsColor(0x00888888);

GraphicalView mChartView = ChartFactory.getBarChartView(MyApplication.getCurrentActivity(),
		dataset, renderer, Type.DEFAULT);

return mChartView;

}1. Modify the background color or set the background picture
Background color settings require two setMarginsColor and setBackgroundColor.
2. setAxisTitleTextSize(16); //Set the text size of the axis title
3. setChartTitleTextSize(20); //Set chart title text size
4. setLabelsTextSize(15); //Set axis label text size
5. setLegendTextSize(15); //Set Legend Text Size
6. renderer.setChartTitle("Set column name"); //Set column name
7. renderer.setXTitle ("XX"); //Set X-axis name
8. renderer.setYTitle ("YY"); //Set Y axis name
9. renderer.setXAxisMin(0.5); //Set X-axis minimum value to 0.5
10. renderer.setXAxisMax(5.5); //Set maximum X-axis value to 5
11. renderer.setYAxisMin(0); //Set the minimum value of Y axis to 0
12. renderer.setYAxisMax(500); //Set Y-axis maximum to 500
13. renderer.setDisplayChartValues(true); //Set whether the value is displayed above the column
14. renderer.setShowGrid(true); //Set whether to display the grid in the chart
15. renderer.setXLabels(0); //Set the number of scale labels displayed on the X-axis
16. If you want to display custom labels on the X-axis, first set renderer.setXLabels(0); then we want renderer.addTextLabel() to add in a loop
17. renderer.setXLabelsAlign(Align.RIGHT); //Set the relative position relationship between the scale lines and the X-axis
18. renderer.setYLabelsAlign(Align.RIGHT); //Set the relative position relationship between the scale line and the Y axis
19. renderer.setZoomButtonsVisible(true); //Set scalable
20. renderer.setPanLimits (newdouble[] {0, 20, 0, 140}); //Set the pull range
21. renderer.setZoomLimits (newdouble[] {0.5, 20, 1, 150}); //Set zoom range
22. renderer.setRange(newdouble[]{0d, 5d, 0d, 100d}); //Set chart's view range
23. renderer.setFitLegend(true); //Set whether to show legend
24. renderer.setClickEnabled(true)//Set whether sliding, zooming in and out is possible;
25.ChartView.repaint(); redraw
26. For AChartEngine click events, double-click events, and sliding events, all can be resolved with custom events, but it is important to note that renderer.setClickEnabled(false) is set first;
27. If the graphics are distorted after they are added, renderer.setInScroll(true) can be set;
28.renderer.setGridColor(); //Set grid color
29.renderer.setAxesColor();//Set axis color
30.Renderer.setShowLegend(true); //Show bottom description
31.Renderer.setShowLabels(false); //Do not display labels
32.renderer.setLegendTextSize(20); //Set the text size of the lower left corner annotation
33.renderer.setZoomButtonsVisible(true); //Set display zoom in and out button
34.renderer.setZoomEnabled(false); //Settings do not allow zooming in or out.
35.renderer.setChartTitleTextSize(30); //Set the text size of the chart title
36.renderer.setChartTitle("Statistical Results"); //Set the title of the chart to show at the top center by default
37.renderer.setLabelsTextSize(20); //font size of marker text on pie charts
38.renderer.setLabelsColor(Color.WHITE); //Color of marker text on pie charts
39.renderer.setPanEnabled(false); //Set whether panning is possible
40.renderer.setDisplayValues(true); //Whether to display values
41.renderer.setClickEnabled(true); //Set whether clickable