AAChartKit
AAChartKit project is based on the popular open source front-end graph library Highcharts, encapsulated object-oriented, a group of simple, easy-to-use, extremely beautiful chart drawing controls.
Adapt iOS 7, support ARC, support OC language, simple configuration.
Powerful, support columnar graph, bar graph, polyline graph, filling graph, radar chart, sector chart, bubble chart and other graphics
The animation effect is delicate and delicate, smooth and graceful.
Support Masonry Chain Programming Syntax
AAChartView + AAChartModel = Chart, in the AAChartKit package library, follows a minimalist formula: Chart View Control + Chart Model = the chart you want.
Honey, if you feel satisfied when using it, please reward a star, your encouragement will be a great motivation for me to continue to work hard.
Portal
https://github.com/AAChartMod...
Usage method
Dead work
Drag the folder AAChartKitFiles in the project demo into the required project.
Add in your project's. pch global macro definition file
#import "AAGlobalMacro.h"
Official Start
1. Add it to your View Controller file
#import "AAChartView.h"
2. Create view AAChartView
AAChartView *chartView = [[AAChartView alloc]init];
self.view.backgroundColor = [UIColor whiteColor];
chartView.frame = CGRectMake(0, 60, self.view.frame.size.width, self.view.frame.size.height-220);
chartView.contentHeight =self.view.frame.size.height-220;//Set the content height of the chart view (the default content height is the same as that of the AChartView)
[self.view addSubview:chartView];
3. Configuration view model AAChartModel
AAChartModel *chartModel= AAObject(AAChartModel)
.chartTypeSet(AAChartTypeColumn)//Set the type of chart (for example, bar chart)
.titleSet(@"Programming language heat")//Setting the title of the chart
.subtitleSet(@"Virtual data")//Setting Subtitle of Chart
.categoriesSet(@[@"Java",@"Swift",@"Python",@"Ruby", @"PHP",@"Go",@"C",@"C#",@" C++"]// Set the contents of the horizontal axis of the chart
.yAxisTitleSet(@"Centigrade")//Units that set the y axis of a chart
.seriesSet(@[
AAObject(AASeriesElement)
.nameSet(@"2017")
.dataSet(@[@45,@56,@34,@43,@65,@56,@47,@28,@49]),

AAObject(AASeriesElement)
.nameSet(@"2018")
.dataSet(@[@11,@12,@13,@14,@15,@16,@17,@18,@19]),

AAObject(AASeriesElement)
.nameSet(@"2019")
.dataSet(@[@31,@22,@33,@54,@35,@36,@27,@38,@39]),

AAObject(AASeriesElement)
.nameSet(@"2020")
.dataSet(@[@21,@22,@53,@24,@65,@26,@37,@28,@49]),
])
;
4. Drawing Graphics
[chartView aa_drawChartWithChartModel:chartModel];//Chart View Object Calls Chart Model Object to Draw Final Graph
5. Special description
In AAChartKit, fan and bubble diagrams belong to special types, so if you want to draw fan and bubble diagrams, the setting of AAChartModel is slightly different. Examples are as follows.
To draw a sector chart, you need to configure the AAChartModel in this way
AAChartModel *chartModel= AAObject(AAChartModel)
        .chartTypeSet(AAChartTypePie)
        .titleSet(@"Programming language heat")
        .subtitleSet(@"Virtual data")
        .dataLabelEnabledSet(true)//Whether to display sector chart data directly
        .yAxisTitleSet(@"Centigrade")
        .seriesSet(
                   @[AAObject(AASeriesElement)
                     .nameSet(@"The proportion of language fever")
                     .dataSet(@[
                                @[@"Java"  , @67],
                                @[@"Swift" , @44],
                                @[@"Python", @83],
                                @[@"OC"    , @11],
                                @[@"Ruby"  , @42],
                                @[@"PHP"   , @31],
                                @[@"Go"    , @63],
                                @[@"C"     , @24],
                                @[@"C#"    , @888],
                                @[@"C++"   , @66],
                                ]),
                     ]

                   )
        ;
Draw bubble charts. You need to configure the AAChart Model in this way
 AAChartModel *chartModel= AAObject(AAChartModel)
        .chartTypeSet(AAChartTypeBubble)
        .titleSet(@"Programming language heat")
        .subtitleSet(@"Virtual data")
        .yAxisTitleSet(@"Centigrade")
        .seriesSet(
                   @[
                     AAObject(AASeriesElement)
                     .nameSet(@"2017")
                     .dataSet(
                              @[
                                @[@97, @36, @79],
                                @[@94, @74, @60],
                                @[@68, @76, @58],
                                @[@64, @87, @56],
                                @[@68, @27, @73],
                                @[@74, @99, @42],
                                @[@7,  @93, @87],
                                @[@51, @69, @40],
                                @[@38, @23, @33],
                                @[@57, @86, @31]
                                ]),

                     AAObject(AASeriesElement)
                     .nameSet(@"2018")
                     .dataSet(
                              @[
                                @[@25, @10, @87],
                                @[@2, @75, @59],
                                @[@11, @54, @8],
                                @[@86, @55, @93],
                                @[@5, @3, @58],
                                @[@90, @63, @44],
                                @[@91, @33, @17],
                                @[@97, @3, @56],
                                @[@15, @67, @48],
                                @[@54, @25, @81]
                                ]),

                     AAObject(AASeriesElement)
                     .nameSet(@"2019")
                     .dataSet(
                              @[
                                @[@47, @47, @21],
                                @[@20, @12, @4],
                                @[@6, @76, @91],
                                @[@38, @30, @60],
                                @[@57, @98, @64],
                                @[@61, @17, @80],
                                @[@83, @60, @13],
                                @[@67, @78, @75],
                                @[@64, @12, @10],
                                @[@30, @77, @82]
                                ]),

                     ]
                   )
        ;
A graphical example of some important AAChartModel attributes after configuration is as follows
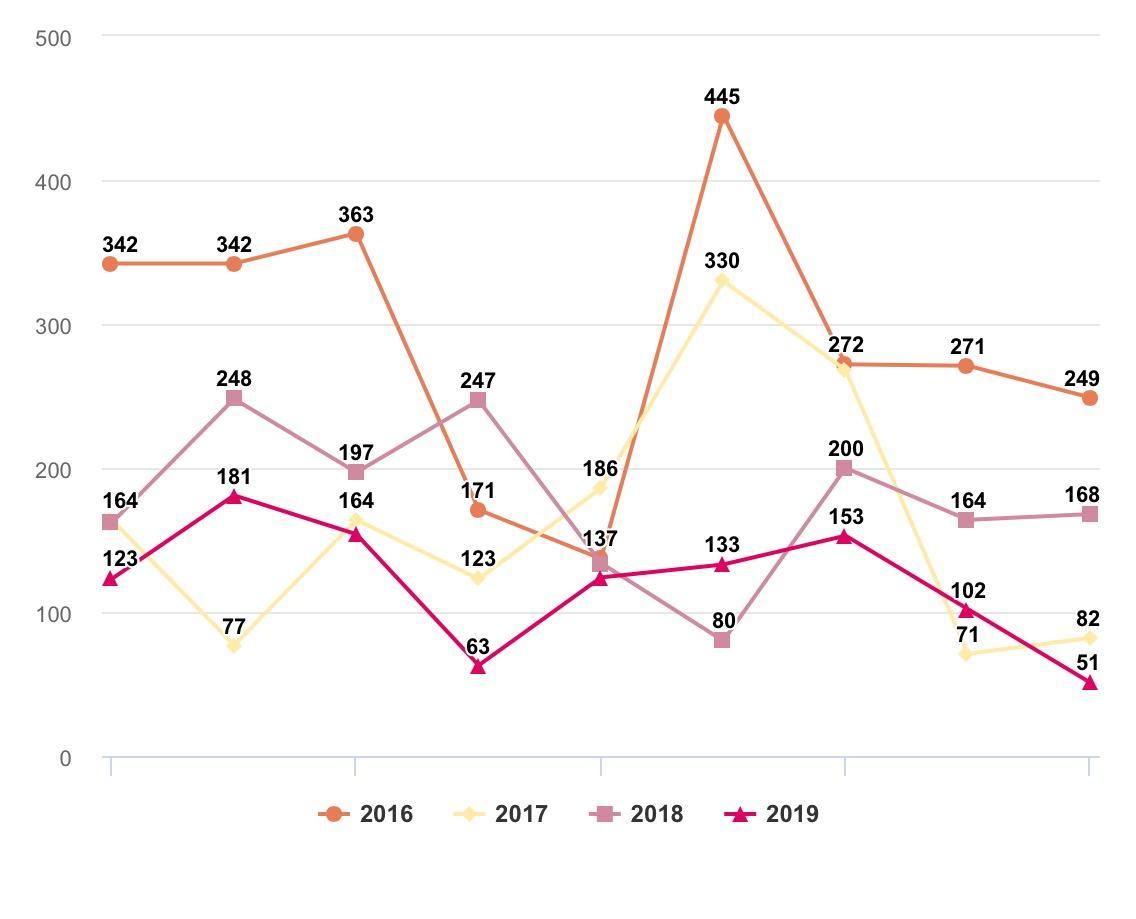
Routine polygraph
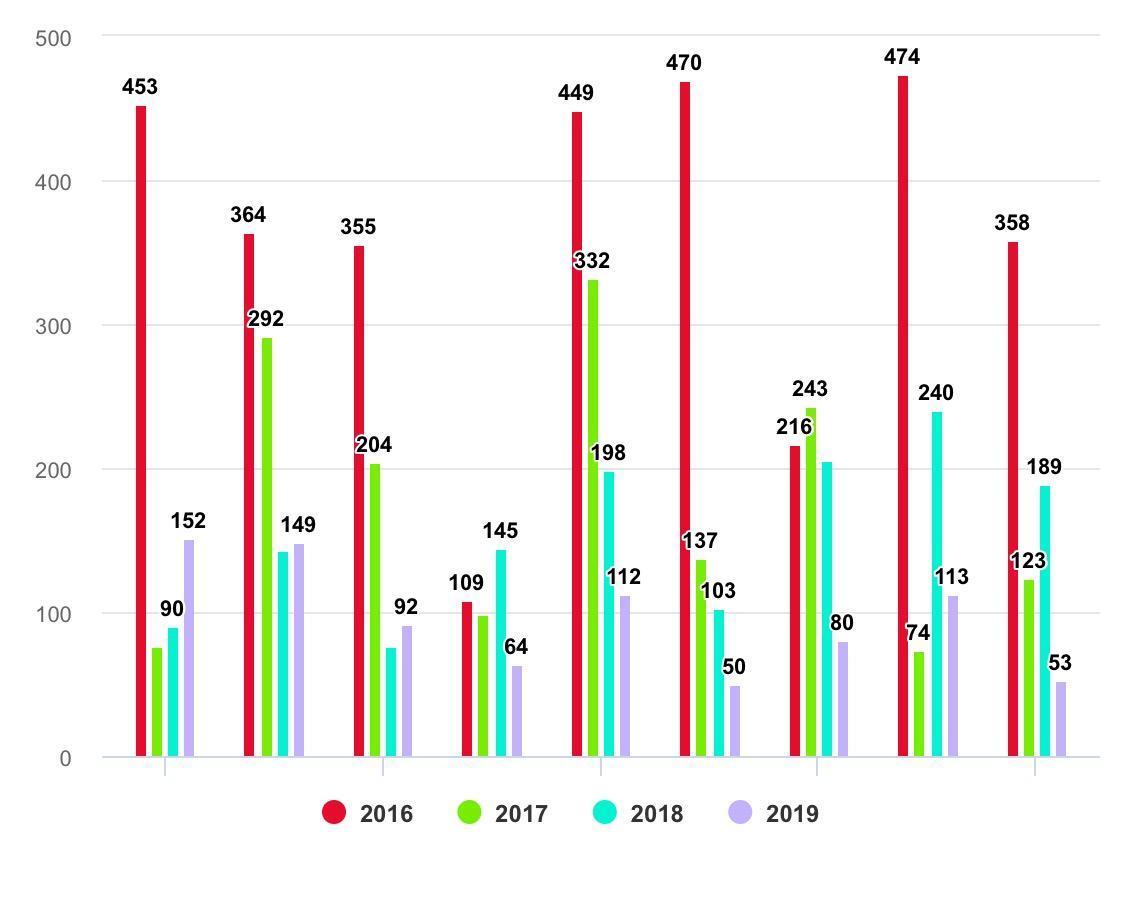
Conventional Cylindrical Graph
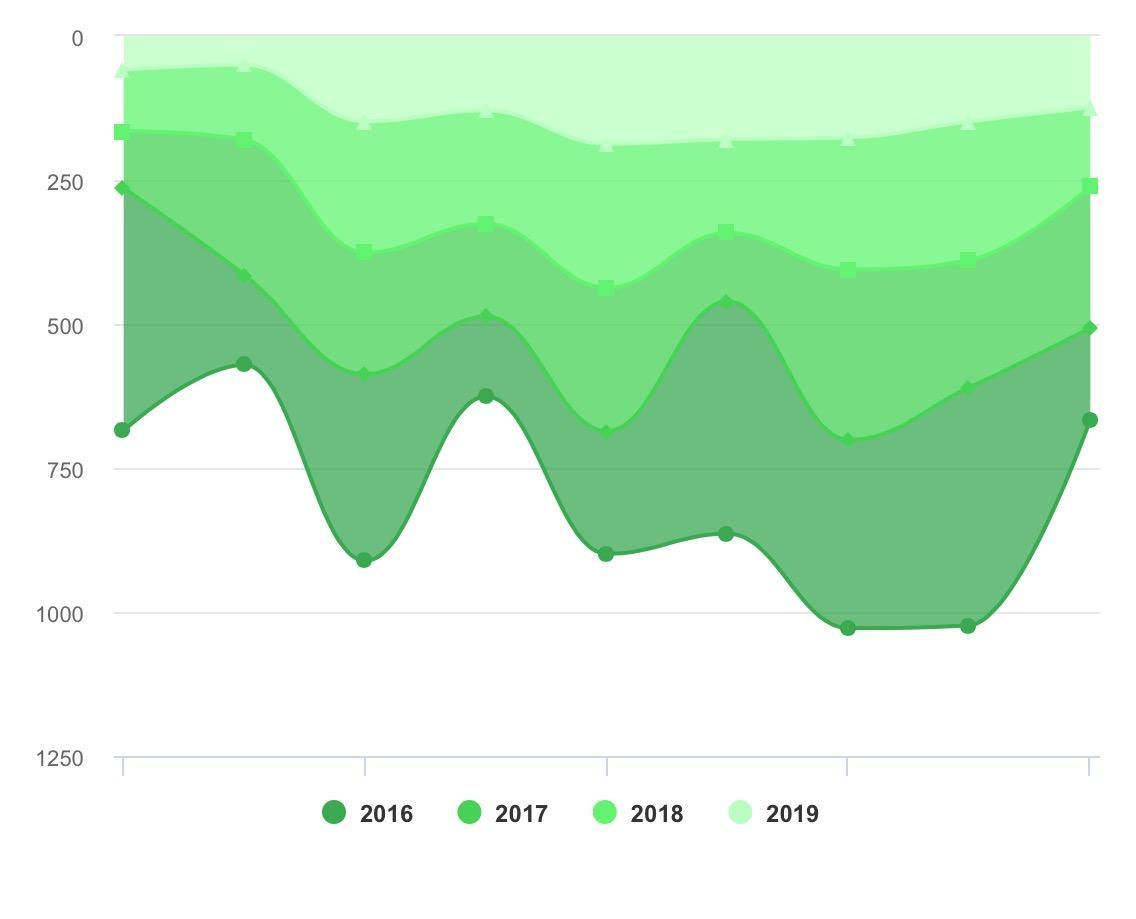
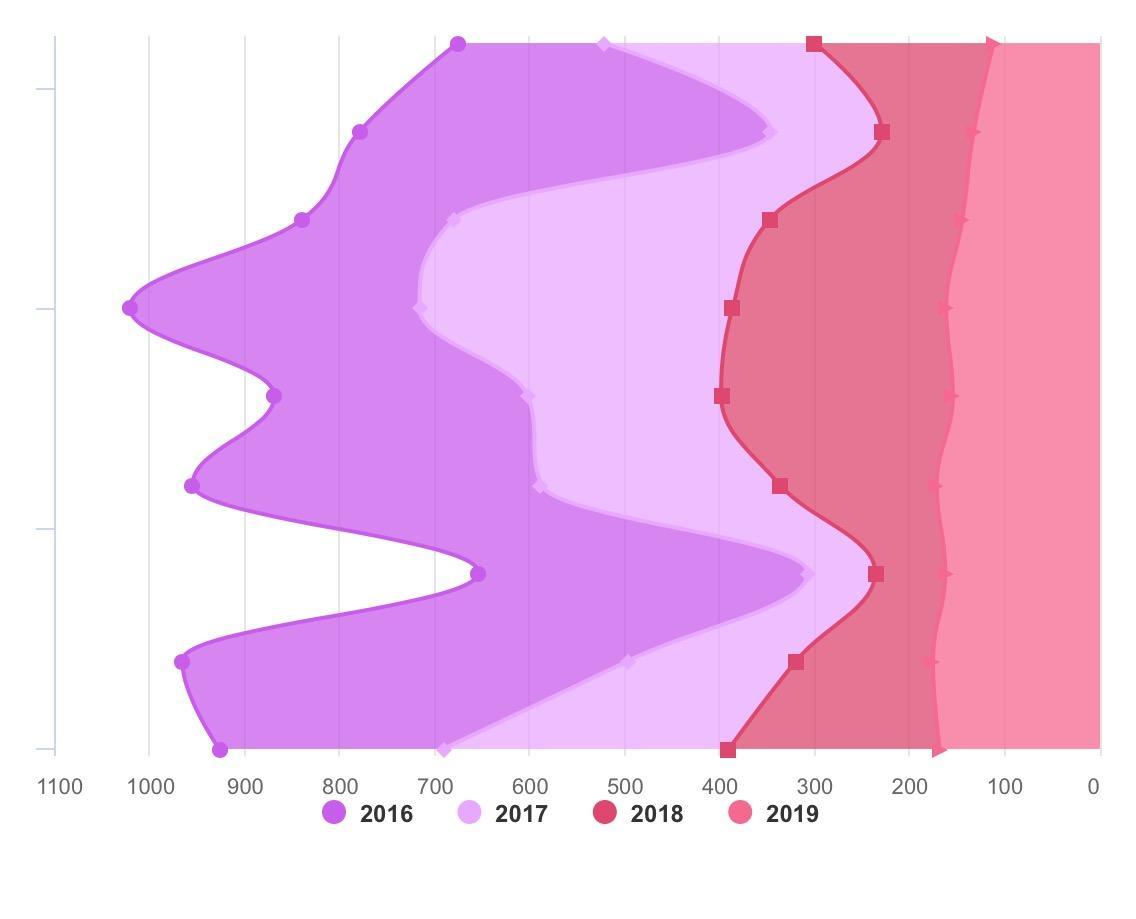
Filling diagram of stacking curve with y-axis inversion
Fill-in Chart of Accumulation Curve with x-axis Reversal
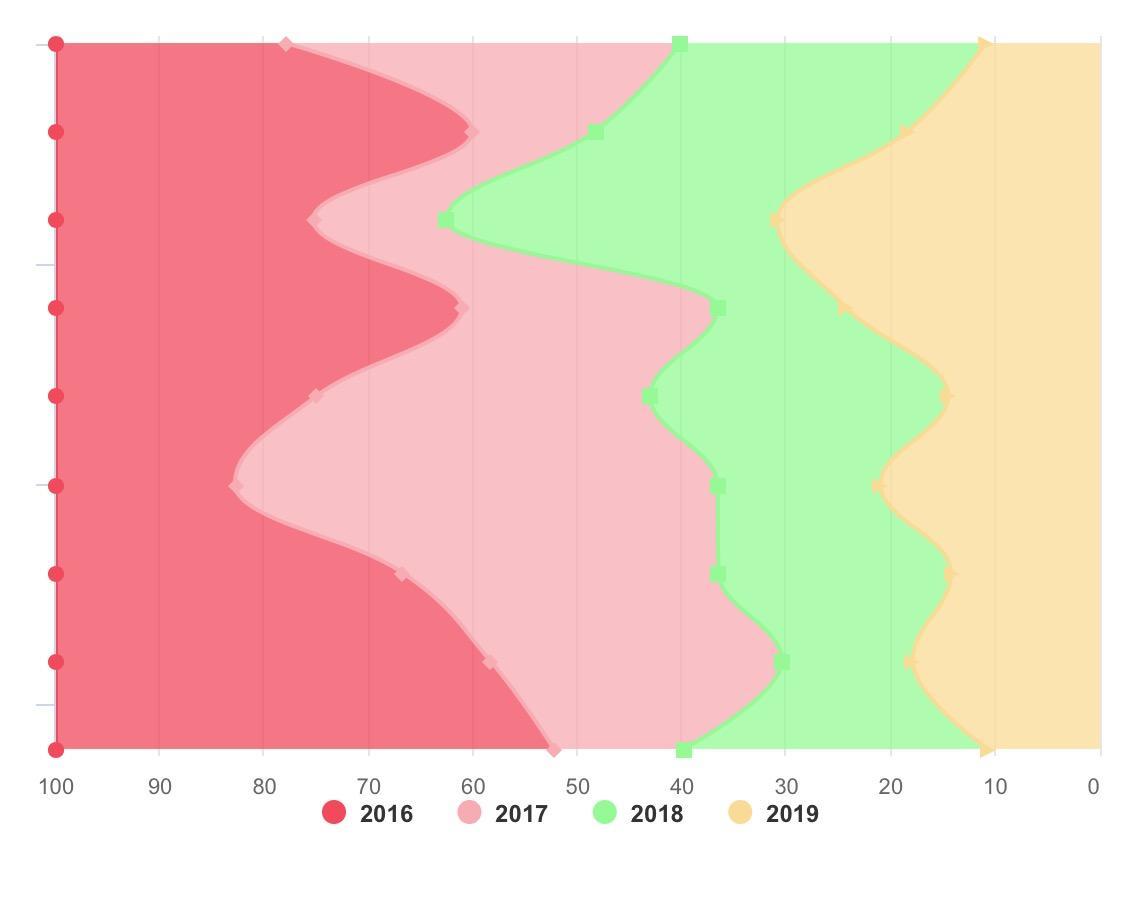
Percentage Cumulative Curve Filling Map of x-axis Reversal
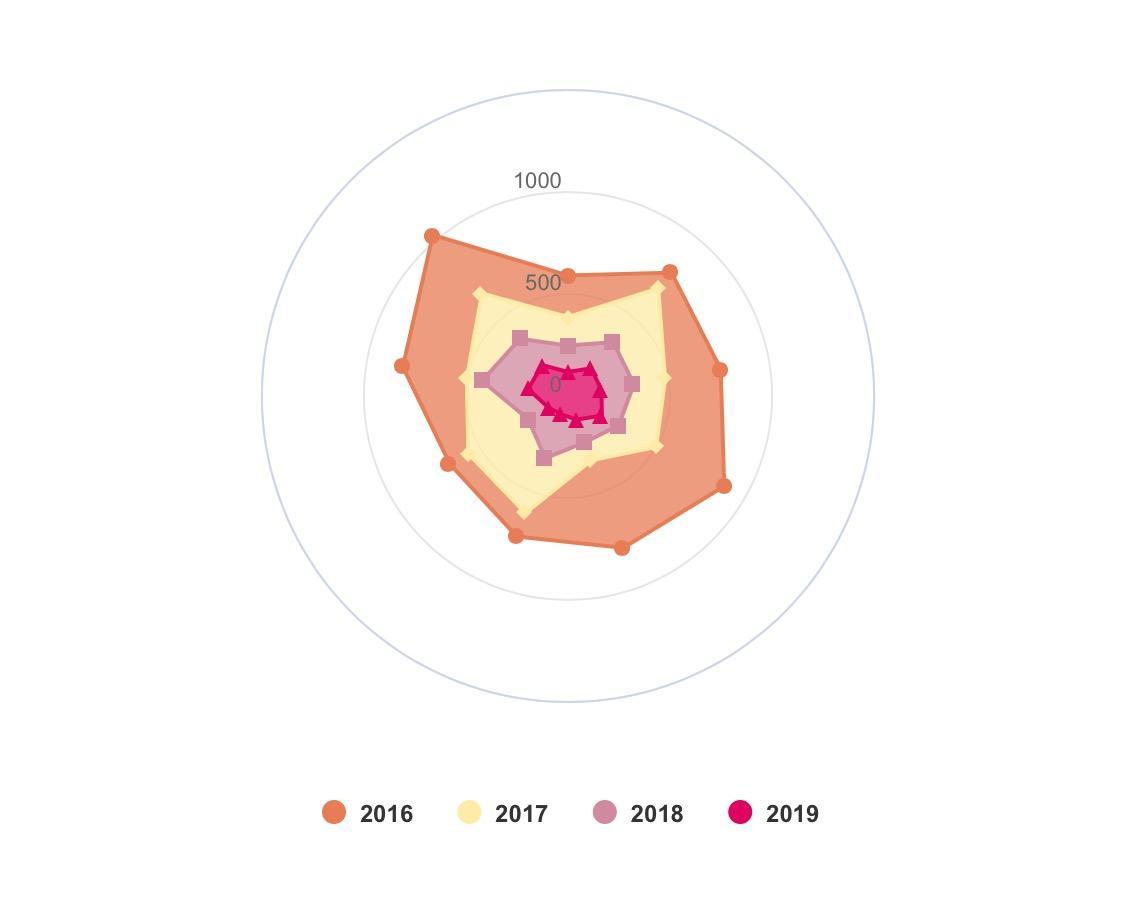
Radiation stacking polyline filling map
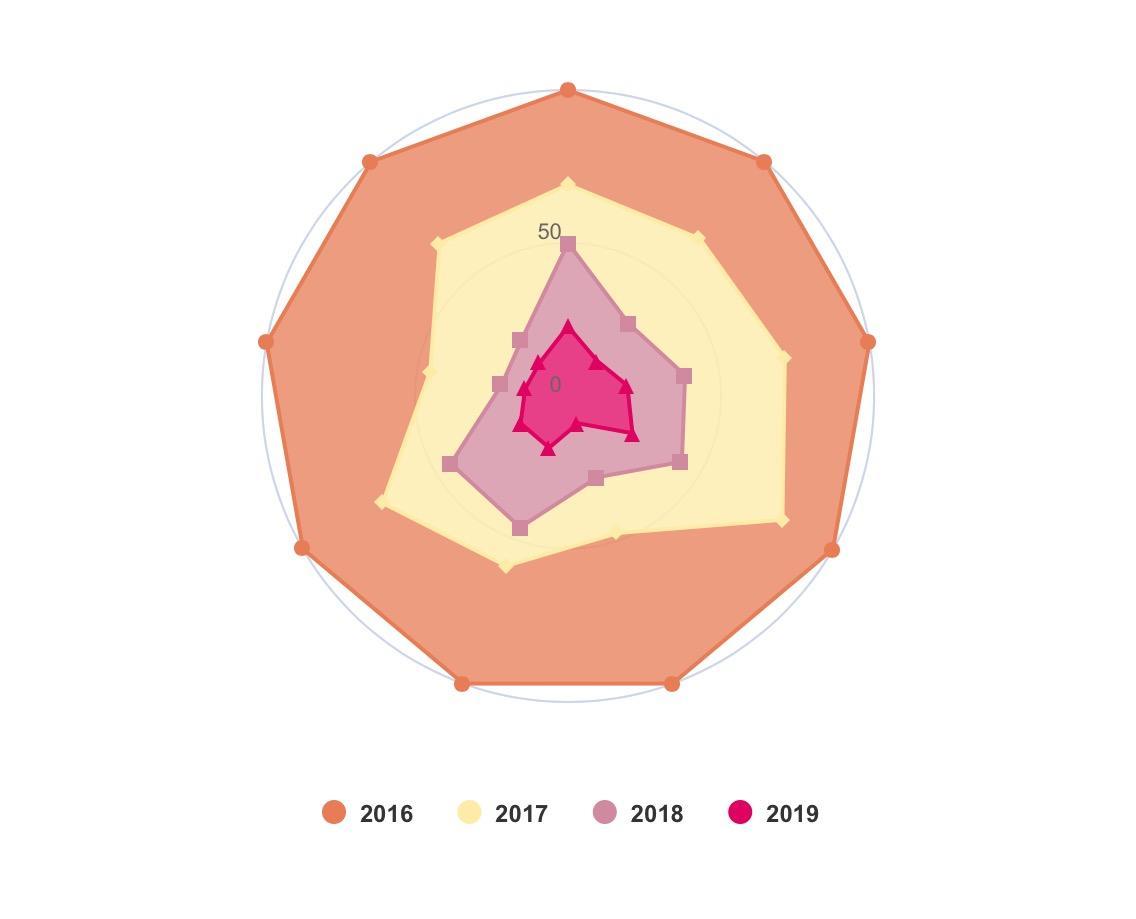
Radiation Percentage Accumulation Fold Fill Map
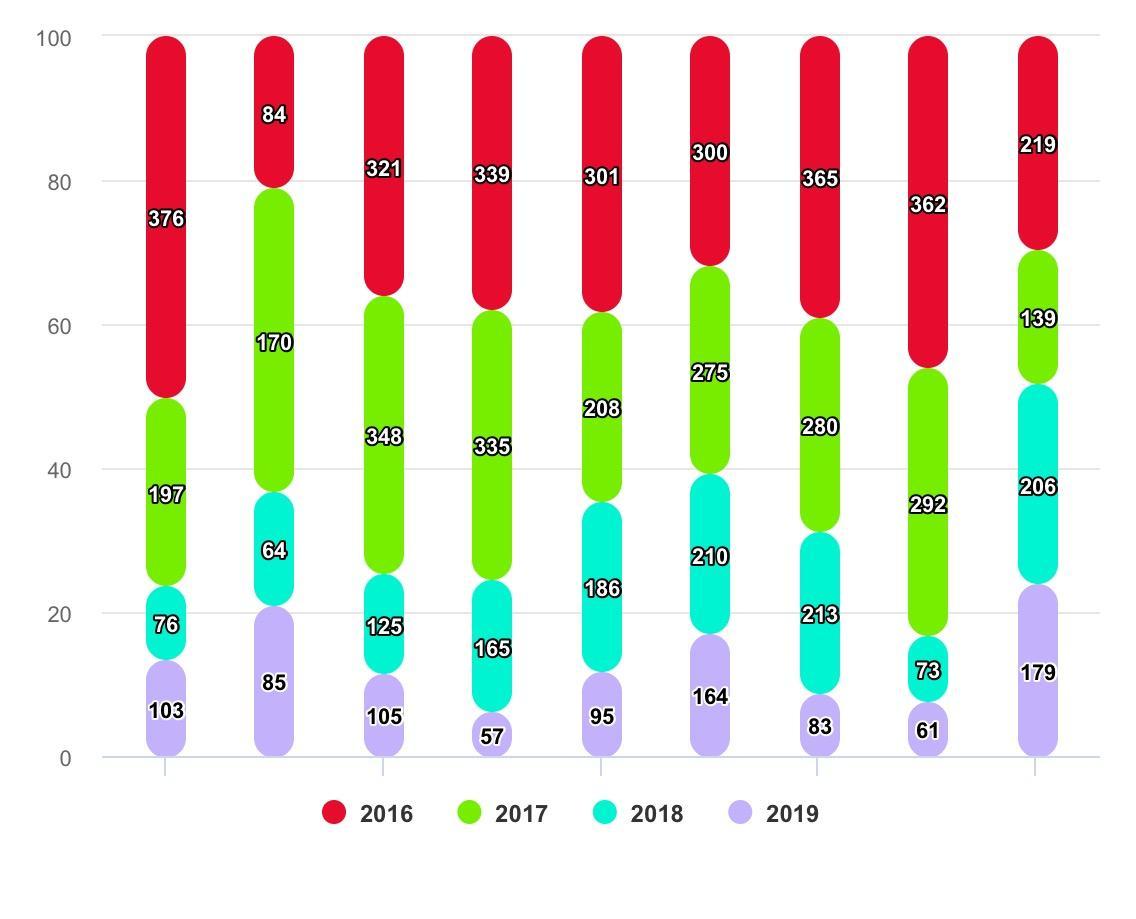
Percentage accumulation cylinder with elliptic head
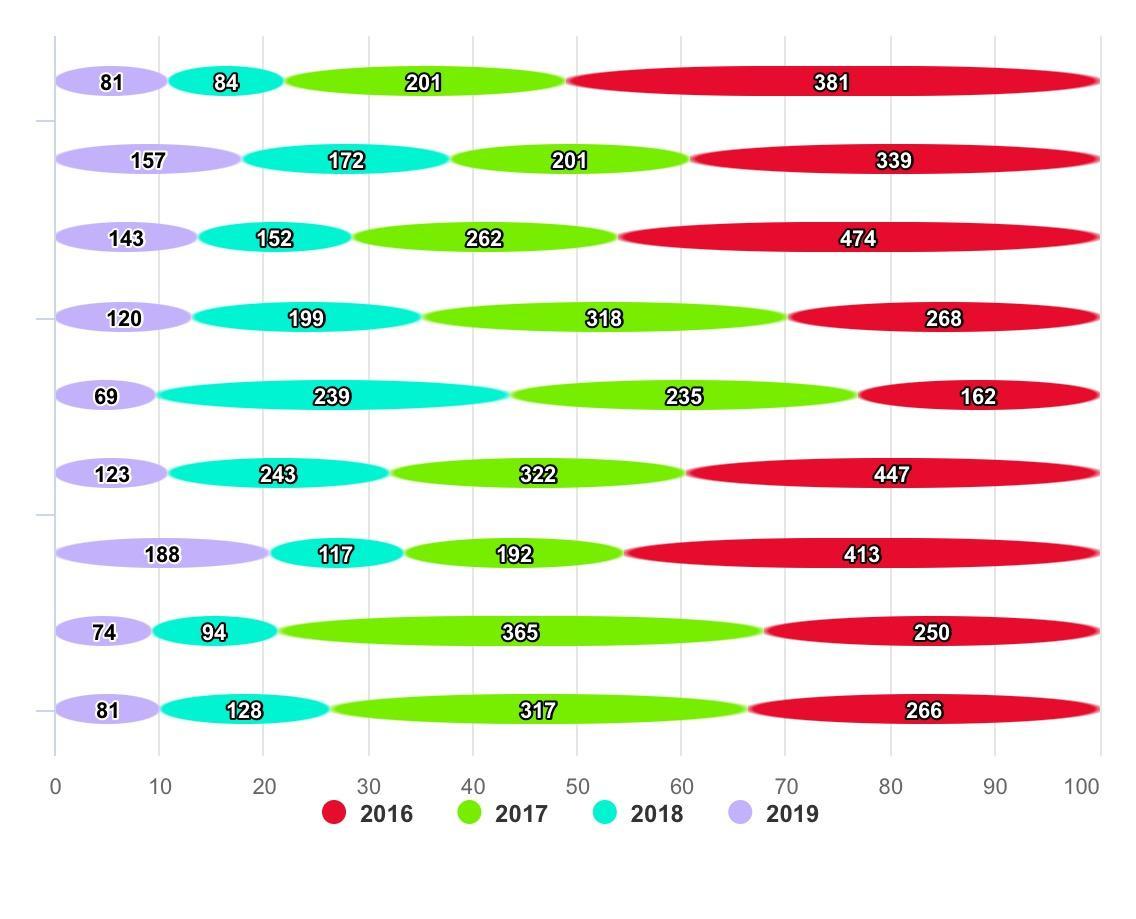
Percentage accumulation bar with wedge-shaped head
AAChartModel Property Configuration List
AAPropStatementAndFuncStatement(copy, AAChartModel, NSString *, title);//Title Content
AAPropStatementAndFuncStatement(copy, AAChartModel, NSString *, subtitle);//Subtitle content

AAPropStatementAndFuncStatement(copy, AAChartModel, NSString *, chartType);//Chart type
AAPropStatementAndFuncStatement(copy, AAChartModel, NSString *, stacking);//Accumulation Style
AAPropStatementAndFuncStatement(copy, AAChartModel, NSString *, symbol);//Curve point types: "circle", "square", "diamond", "triangle","triangle-down", default is "circle".
AAPropStatementAndFuncStatement(copy, AAChartModel, NSString *, zoomType);//Scale type

AAPropStatementAndFuncStatement(assign, AAChartModel, BOOL, inverted);//Is the x-axis vertical?
AAPropStatementAndFuncStatement(assign, AAChartModel, BOOL, xAxisReversed);// x-axis inversion
AAPropStatementAndFuncStatement(assign, AAChartModel, BOOL, yAxisReversed);//y-axis inversion
AAPropStatementAndFuncStatement(assign, AAChartModel, BOOL, crosshairs);//Whether to display the quasi-star line (default display)
AAPropStatementAndFuncStatement(assign, AAChartModel, BOOL, gradientColorEnable);//Do you want to be gradient?
AAPropStatementAndFuncStatement(assign, AAChartModel, BOOL, polar);//Whether or not the polarization pattern (converted to radar pattern)
AAPropStatementAndFuncStatement(assign, AAChartModel, BOOL, dataLabelEnabled);//Whether to display data or not
AAPropStatementAndFuncStatement(assign, AAChartModel, BOOL, xAxisLabelsEnabled);//Does the x-axis display data?
AAPropStatementAndFuncStatement(strong, AAChartModel, NSArray *, categories);//Names corresponding to each point in the abscissa of a chart
AAPropStatementAndFuncStatement(strong, AAChartModel, NSNumber *, xAxisGridLineWidth);//Width of x-axis gridlines
AAPropStatementAndFuncStatement(assign, AAChartModel, BOOL, yAxisLabelsEnabled);//Does the y-axis display data?
AAPropStatementAndFuncStatement(copy,   AAChartModel, NSString *, yAxisTitle);//y-axis headings
AAPropStatementAndFuncStatement(strong, AAChartModel, NSNumber *, yAxisGridLineWidth);//Width of y-axis grids

AAPropStatementAndFuncStatement(strong, AAChartModel, NSArray *, colorsTheme);//Chart Topic Color Array
AAPropStatementAndFuncStatement(strong, AAChartModel, NSArray *, series);

AAPropStatementAndFuncStatement(assign, AAChartModel, BOOL, legendEnabled);//Whether to display legend or not
AAPropStatementAndFuncStatement(copy,   AAChartModel , NSString *, legendLayout);
AAPropStatementAndFuncStatement(copy,   AAChartModel , NSString *, legendAlign);
AAPropStatementAndFuncStatement(copy,   AAChartModel , NSString *, legendVerticalAlign);

AAPropStatementAndFuncStatement(copy,   AAChartModel, NSString *, backgroundColor);//Chart Background Color
AAPropStatementAndFuncStatement(assign, AAChartModel, BOOL, options3dEnable);//Whether 3D graphics are available (bars only, bars only)
AAPropStatementAndFuncStatement(strong, AAChartModel, NSNumber *, options3dAlpha);
AAPropStatementAndFuncStatement(strong, AAChartModel, NSNumber *, options3dBeta);
AAPropStatementAndFuncStatement(strong, AAChartModel, NSNumber *, options3dDepth);//Depth of 3D Graphics

AAPropStatementAndFuncStatement(strong, AAChartModel, NSNumber *, borderRadius);//Cylindrical bar head radius (which can be used to set the shape of the head)
AAPropStatementAndFuncStatement(strong, AAChartModel, NSNumber *, markerRadius);//Radius Length of Broken Connection Points
More graphical effects