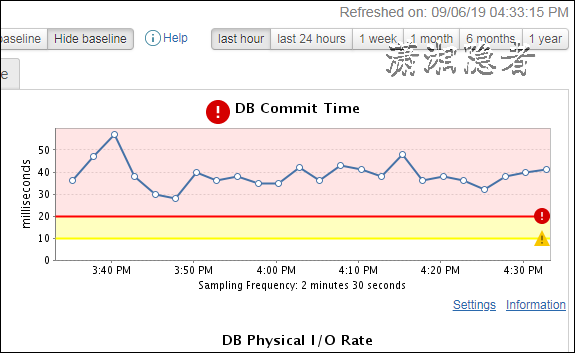
Monitoring tool DPA found a DB Commit Time indicator alarm on an Oracle database server overseas, which exceeded the red alarm line (about 40 milliseconds, yellow alarm 10 milliseconds, red alarm line 20 milliseconds). As shown in the following screenshot, the AWR report for the corresponding period was generated, and log file sync waited inside Top 5 Timed Events The average wait time for an event is 37 milliseconds, and the average wait time for a log file parallel write event is 40 milliseconds
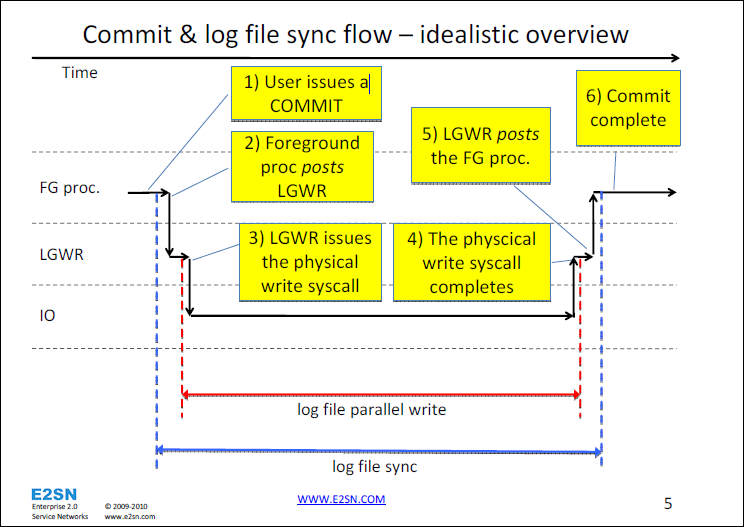
If you are familiar with Tanel Poder:: Understanding LGWR, Log File Sync Waits and Commit Performance s (classic picture below), then by waiting for the event log file sync and log file parallel write Avg Wait(ms) indicator: 37ms & 40ms, you can basically tell where the redo log is locatedDisk I/O on
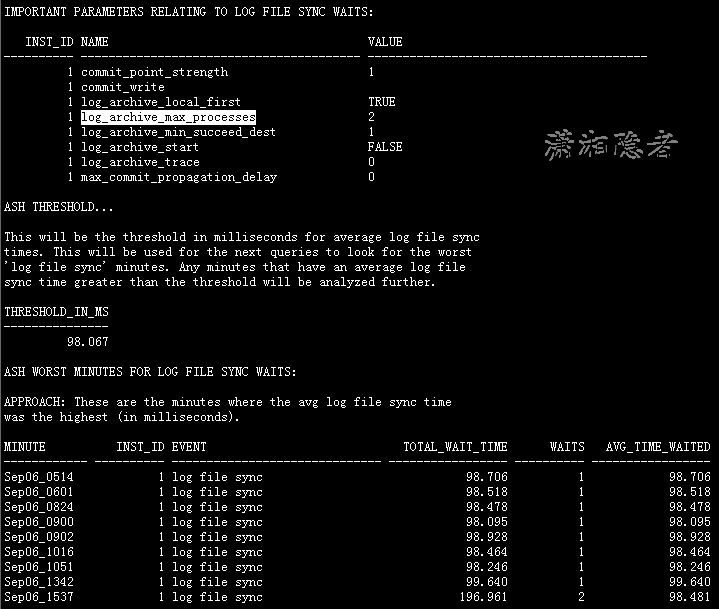
The detailed statistics are then analyzed using the lfsdiag.sql script as follows:
HISTOGRAM DATA FOR LFS AND OTHER RELATED WAITS:APPROACH: Look at the wait distribution for log file sync waitsby looking at "wait_time_milli". Look at the high wait times thensee if you can correlate those with other related wait events.INST_ID EVENT WAIT_TIME_MILLI WAIT_COUNT---------- ---------------------------------------- --------------- ----------1 log file sync 1 43631 log file sync 2 8351 log file sync 4 16501 log file sync 8 49371 log file sync 16 1462521 log file sync 32 6066741 log file sync 64 2633771 log file sync 128 2532541 log file sync 256 21 log file switch completion 1 1241 log file switch completion 2 91 log file switch completion 4 191 log file switch completion 8 211 log file switch completion 16 351 log file switch completion 32 971 log file switch completion 64 1331 log file switch completion 128 3261 log file switch completion 256 17361 log file switch completion 512 30421 log file switch completion 1024 20201 log file parallel write 1 01 log file parallel write 2 01 log file parallel write 4 801 log file parallel write 8 21421 log file parallel write 16 1709871 log file parallel write 32 7792051 log file parallel write 64 3114631 log file parallel write 128 796881 log file parallel write 256 427631 log file parallel write 512 130521 log file parallel write 1024 204681 log file parallel write 2048 140201 log file parallel write 4096 9211 log file parallel write 8192 961 log file parallel write 16384 181 log file parallel write 32768 181 log file parallel write 65536 81 log file parallel write 131072 21 LGWR wait for redo copy 1 85161 LGWR wait for redo copy 2 201 LGWR wait for redo copy 4 191 LGWR wait for redo copy 8 201 LGWR wait for redo copy 16 11ORDERED BY WAIT_TIME_MILLIINST_ID EVENT WAIT_TIME_MILLI WAIT_COUNT---------- ---------------------------------------- --------------- ----------1 log file sync 1 43631 log file switch completion 1 1241 log file parallel write 1 01 LGWR wait for redo copy 1 85161 log file sync 2 8351 log file switch completion 2 91 log file parallel write 2 01 LGWR wait for redo copy 2 201 log file sync 4 16501 log file switch completion 4 191 log file parallel write 4 801 LGWR wait for redo copy 4 191 log file sync 8 49371 log file switch completion 8 211 log file parallel write 8 21421 LGWR wait for redo copy 8 201 log file sync 16 1462521 log file switch completion 16 351 log file parallel write 16 1709871 LGWR wait for redo copy 16 111 log file sync 32 6066741 log file switch completion 32 971 log file parallel write 32 7792051 log file sync 64 2633771 log file switch completion 64 1331 log file parallel write 64 3114631 log file sync 128 2532541 log file switch completion 128 3261 log file parallel write 128 796881 log file sync 256 21 log file switch completion 256 17361 log file parallel write 256 427631 log file switch completion 512 30421 log file parallel write 512 130521 log file switch completion 1024 20201 log file parallel write 1024 204681 log file parallel write 2048 140201 log file parallel write 4096 9211 log file parallel write 8192 961 log file parallel write 16384 181 log file parallel write 32768 181 log file parallel write 65536 81 log file parallel write 131072 2REDO WRITE STATS"redo write time" in centiseconds (100 per second)11.1: "redo write broadcast ack time" in centiseconds (100 per second)11.2: "redo write broadcast ack time" in microseconds (1000 per millisecond)VERSION INST_ID NAME VALUE MILLISECONDS----------------- ---------- ---------------------------------------- --------------------- -------------------10.2.0.5.0 1 redo write time 9551524 95515240.00010.2.0.5.0 1 redo writer latching time 5110.2.0.5.0 1 redo writes 1434931AWR WORST AVG LOG FILE SYNC SNAPS:
As you can see from the above data, the maximum number of log file sync waiting events is in the range of 32ms, and the maximum number of log file parallel writes waiting events is in the range of 32ms. In fact, this value is far more than 7ms, which is extremely abnormal.The log file parallel write event is a wait event exclusive to the LGWR process, which occurs when LGWR writes the redo log information from the log_buffer to a member file of the online redo log file group, on which LGWR waits for the completion of the write process.The event took too long to wait, indicating that the disk on which the log file resides is slow or contentious.Log file sync and log file parallel write are related to each other.In other words, assuming that the log file parallel write takes a very long time, it must cause the log file sync to wait longer.If log file parallel write waits very high, it may generally be a physical disk I/O problem
In addition, we also checked the frequency of redo log switching. As shown below, redo log switching is not frequent and the amount of archive logs generated is not large.
Then we found a machine (server with normal index above) to simply test the speed of IO. This method is very simple, that is, to see how long it takes to generate a large file, to simply test the I/O performance (without considering cache, etc., test sampling is not exhaustive), but the comparison data is also basically validated.Certification, feedback disk IO problems).
Problem Server:
# time dd if=/dev/zero of=./test bs=512k count=2048 oflag=direct
2048+0 records in
2048+0 records out
1073741824 bytes (1.1 GB) copied, 88.271 seconds, 12.2 MB/s
real 1m28.273s
user 0m0.010s
sys 0m0.655s
Compare servers (normal servers):
# time dd if=/dev/zero of=./test bs=512k count=2048 oflag=direct
2048+0 records in
2048+0 records out
1073741824 bytes (1.1 GB) copied, 2.48344 seconds, 432 MB/s
real 0m2.485s
user 0m0.004s
sys 0m0.386s
As shown in the above comparison, the two servers generate the same size file, which takes a lot of time and has very different I/O performance. This fully verifies that the alerted server is located in a storage I/O performance problem, but the company division of labor is very clear, and the DBA does not know what is wrong with the underlying storage, so it can only feedback this problemOut and wait for replies from colleagues overseas responsible for maintaining systems and storage.


