java basic course virtual machine performance analysis and fault resolution tool [graphical interface]
--------------Function: help judge problems such as high cpu occupancy, dead loop, deadlock, memory leak, memory overflow, etc.
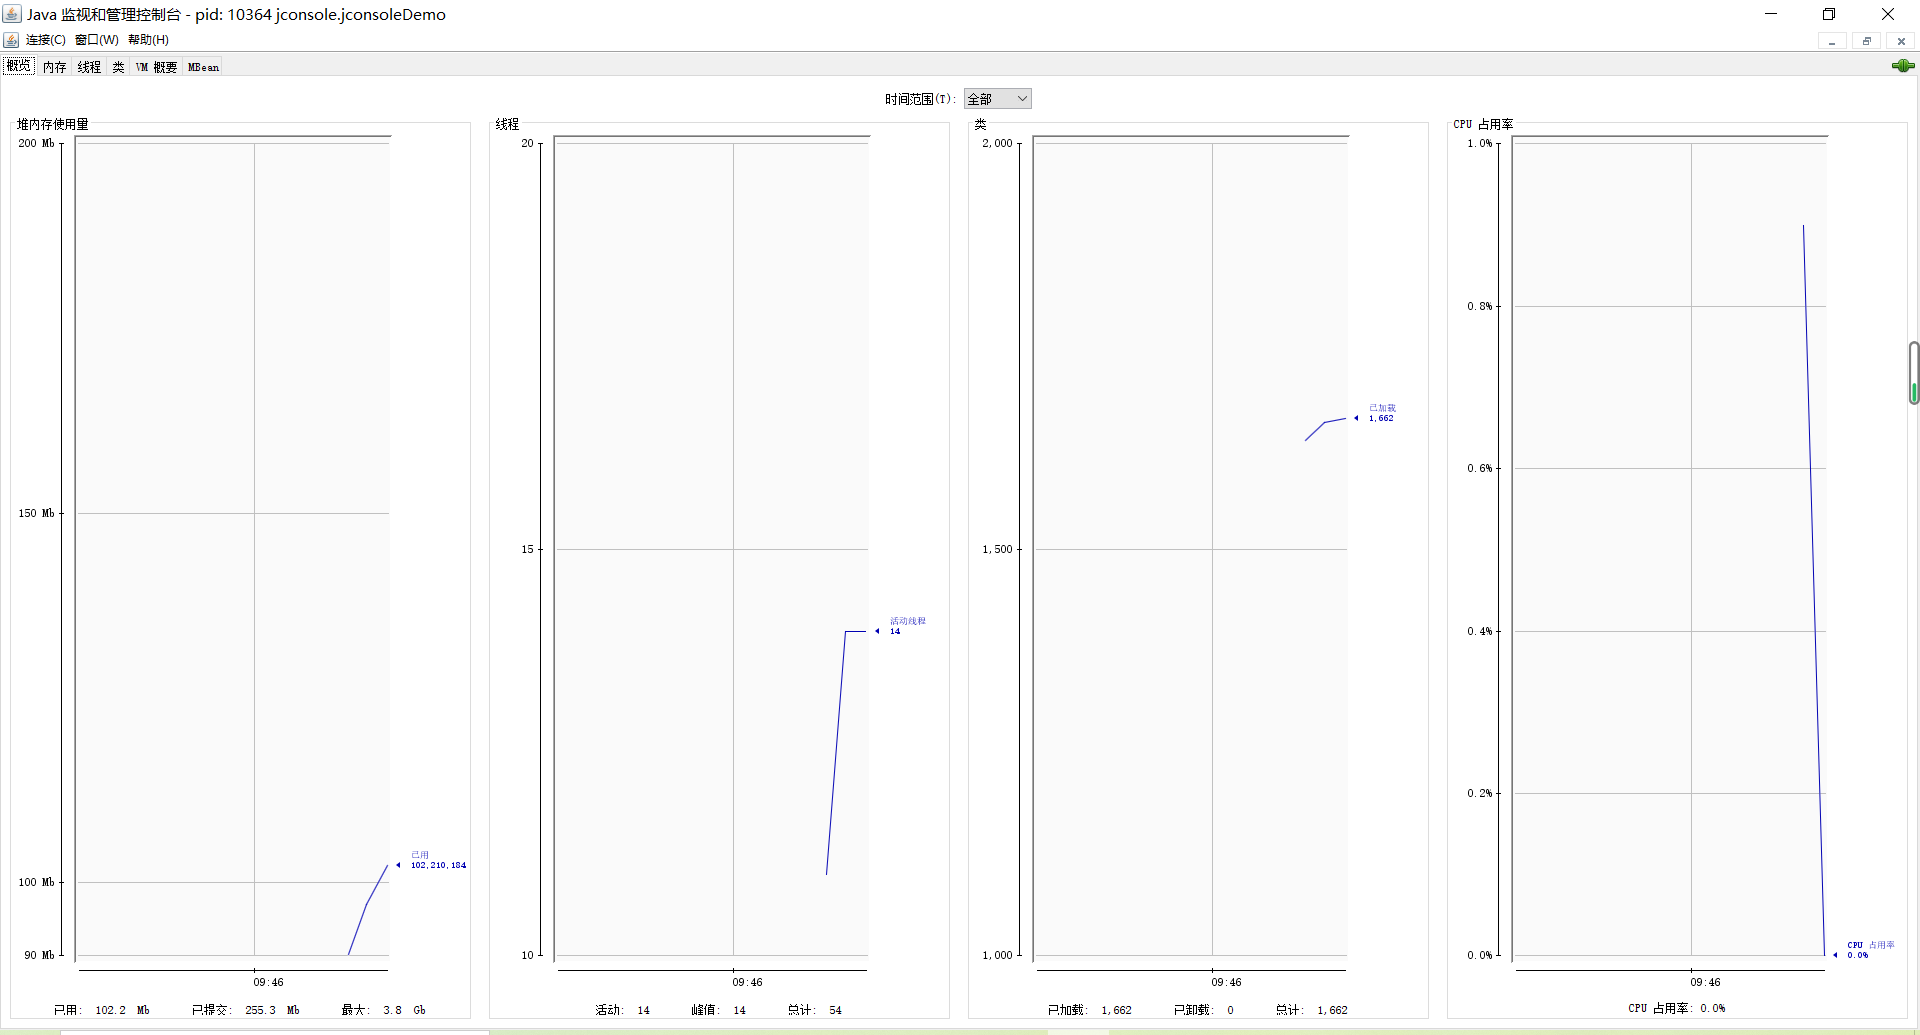
■ JConsole: focus on viewing threads and memory
■ VisualVM (recommended): it has the same function as JConsole, but its function is more powerful than JConsole. [detailed introduction]
1. jconsole ------ focus on viewing threads and memory
2. VisualVM ------ operation monitoring, fault handling, performance analysis
■ VisualVM is developed based on NetBeans platform, so it has the feature of plug-in extension function from the beginning. Through plug-in extension support, VisualVM can:
- displays the virtual machine process and its configuration and environment information (jps, jinfo).
- monitor the CPU, GC, heap, method area and thread information of the application (jstat, jstack).
- dump and analysis heap dump snapshot (jmap, jhat).
- method level program running performance analysis to find the methods that are called the most and run the longest.
- offline program snapshot: collect the runtime configuration, thread dump, memory dump and other information of the program to create a snapshot, which can be sent to the developer for Bug feedback.
- the infinite possibilities of other plugins
■ use and installation of plug-ins:
1. Input in the terminal: jvisualvm can execute;
2. Install plug-in:
2.1 select Tools > plug in from the main menu;
2.2 in the available plug-ins tab, select the install check box for the plug-in. Click Install;
2.3 gradually complete the plug-in installation program.
✿ code of test class:
package jvisualvm;

import java.io.IOException;
import java.util.ArrayList;
import java.util.List;

/**
 * JVisualVM Memory analysis
 * @author Huangyujun
 *
 */
public class jvisualvmDemo1 {
    public static void main(String[] args) throws IOException, InterruptedException {
        test1();
        System.in.read();
    }

    private static void test1() throws InterruptedException {
        List<Student> list = new ArrayList<>();
        for(int i = 0; i < 100; i++) {
            Thread.sleep(1000);
            list.add(new Student());
        }
    }
}

class Student {
    private byte[] big = new byte[5 * 1024 * 1024];    //5M
}
■ specific steps for using jvisualvm:
1) : first enter: jvisualvm on the eclipse terminal
2) : double click the selected test class:
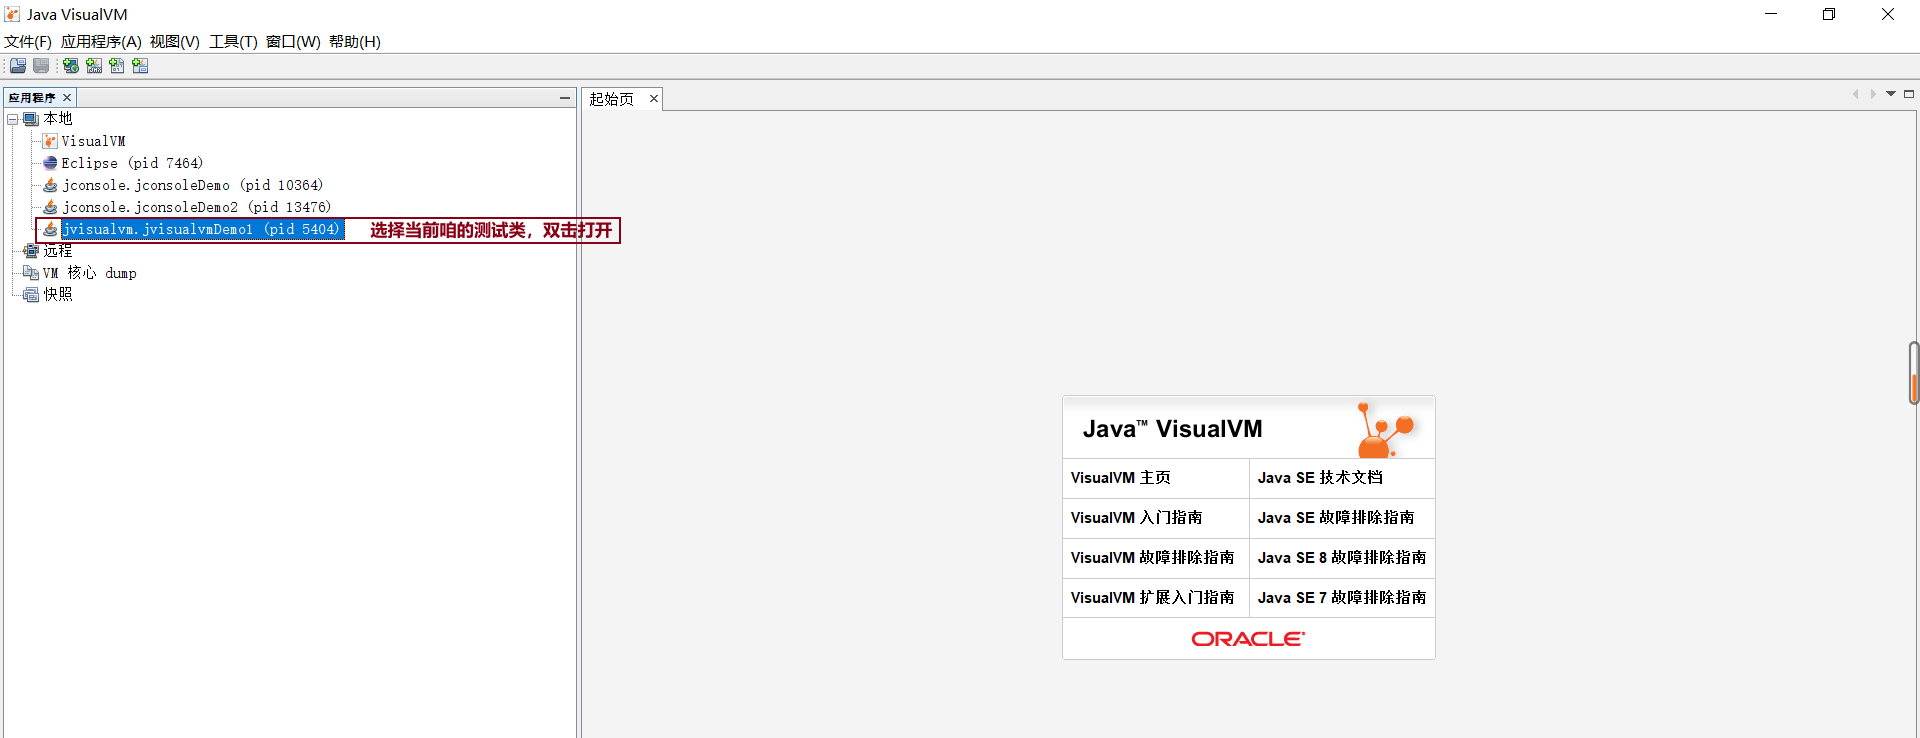
■ the toolbar options you see actually correspond to the plug-ins installed in jvisualvm. If you need more functions, please install them

■ focus on heap Dump and thread Dump
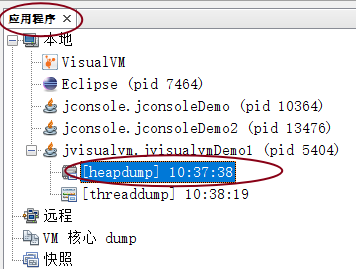
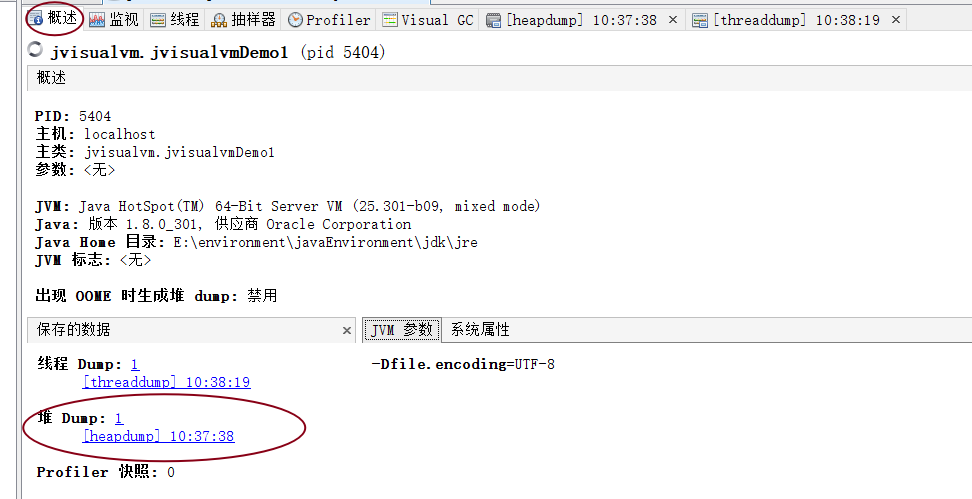
1) : heap Dump: there is heap Dump in the monitoring [after clicking and observing the leftmost application, a heap Dump file is generated; of course, at this time, click overview to see the number of heap dumps, and click it to view the heap Dump file information]
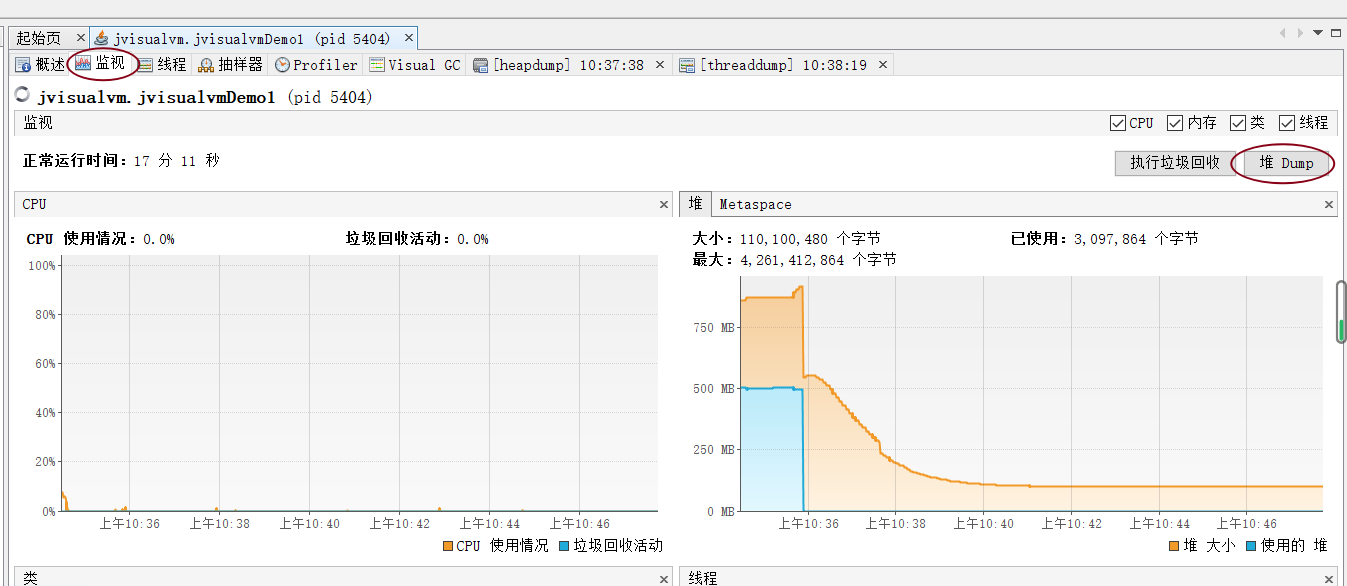
2) : thread Dump: there is thread Dump in the thread option

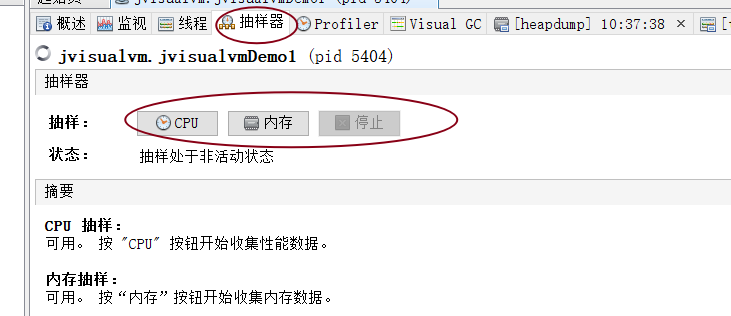
■ there is also a sampler: sample the CPU and memory for a period of time to analyze the application [obtain the memory or CPU status at a certain time through snapshot or pause]
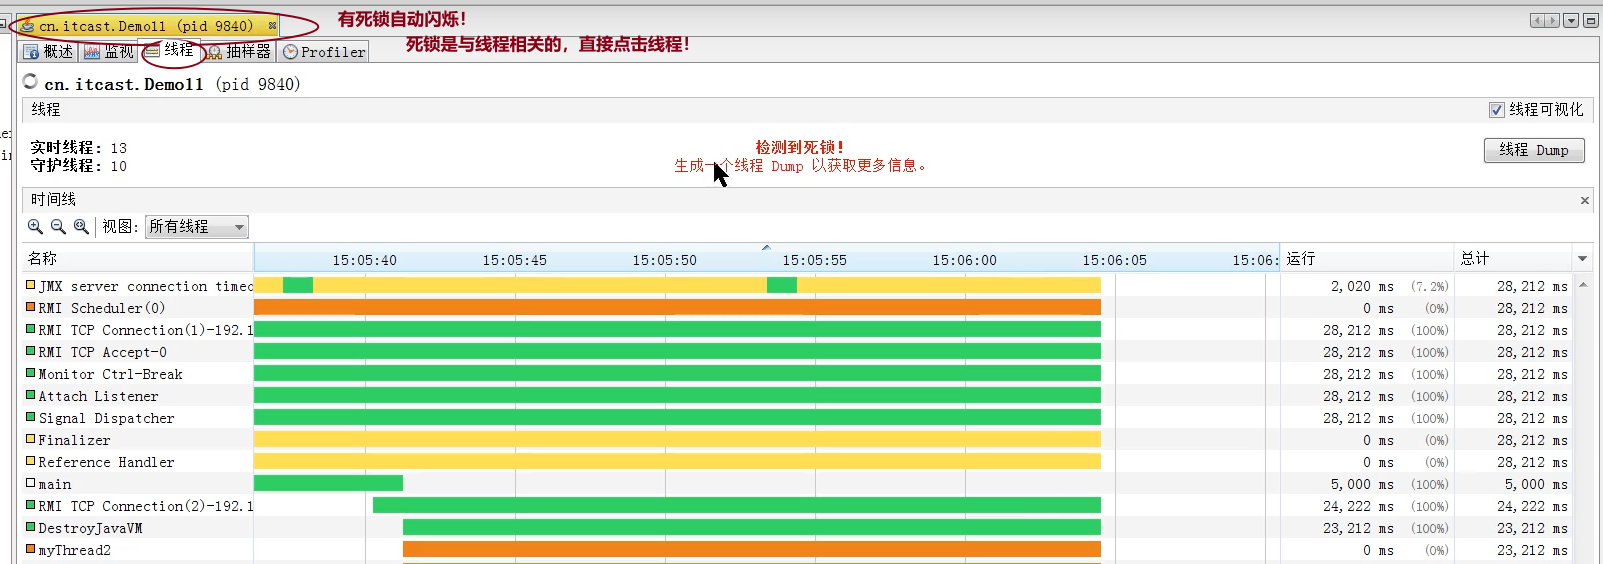
3. Supplement the use of jvisualvm - check Deadlock:
1) : Code Case:
private static void dealLock() {
        Lock lock1 = new ReentrantLock();
        Lock lock2 = new ReentrantLock();
        new Thread(() -> {
            try {
                lock1.lock();//In thread myThread1 Medium: lock1 After locking, don't release and go to bed, in the thread myThread2 Medium: lock1 If you want to lock it again, you won't have a chance
                Thread.sleep(100);
                lock2.lock();
            } catch (InterruptedException e) {
                e.printStackTrace();
            }

        }, "myThread1").start();
        new Thread(() -> {
            try {
                lock2.lock();
                Thread.sleep(100);
                lock1.lock();
            } catch (InterruptedException e) {
                e.printStackTrace();
            }

        }, "myThread2").start();
    }
2) : what happens in the jvisualvm tool:
