1, Overview
When I first learned stata, I was quite confused about the logic of stata output, because when I learned python and cpp, the output functions were very simple, and the common commands of statac such as asdoc, outreg2, logout and esttab were often unclear when they jumped out, and I didn't know why they were used in the code.
This article is to sort out some common output commands, which can reduce the difficulty of understanding when studying subjects such as econometrics.
This article mainly combs the commands, including but not limited to asdoc, outreg2, logout and esttab, and mainly introduces their usage. The above commands can be used to install updates through the ssc install command name and replace
2, Various commands for result output
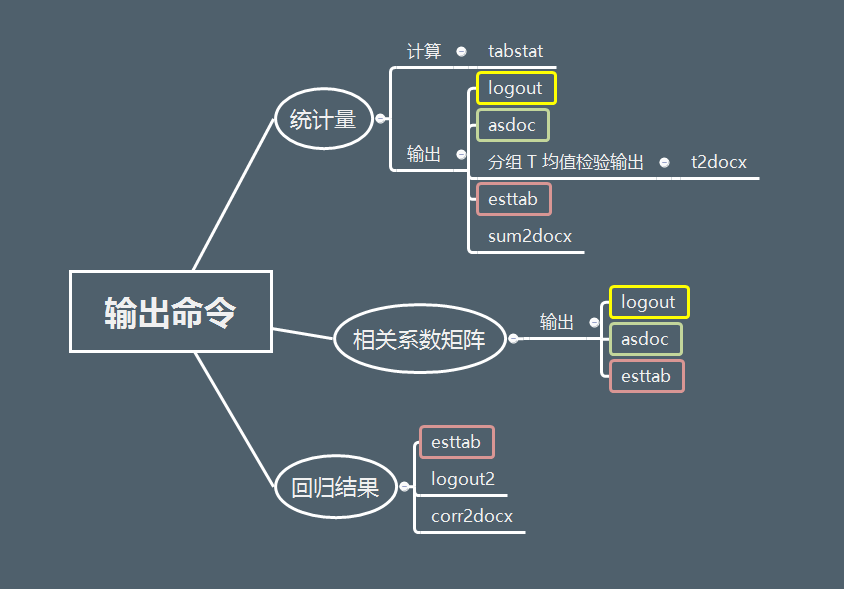
Generally speaking, outreg2 only supports the output of descriptive statistics and regression results, logout supports the output of grouped T-means test and correlation coefficient matrix, tabstat is generally used to output basic statistics, and asdoc supports the output of descriptive statistics, which has great limitations; esttab is more practical in the output of regression results, descriptive statistics, grouping T-means test and correlation coefficient matrix.
Generally speaking, beginners of stata can pay more attention to logout and asdoc, and those who pay attention to research can learn more about esttab and outreg2.
3, Statistics
- Calculation (want to get the basic statistics of multiple data)
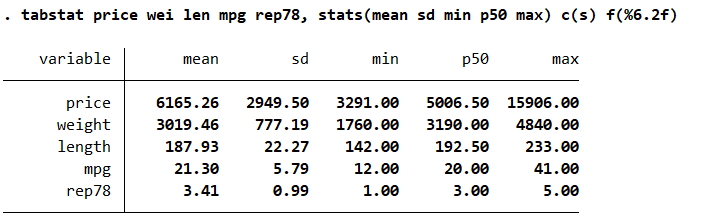
tabstat

From a beginner's point of view, stats is the abbreviation of statistics, which stands for setting the output format - statistics(): all statistics that can be entered are: N mean sd min median max p1 p5 p10 p25 p75 p90 p95 p99. If it is blank, N mean sd min median max is entered by default.
- The above command means to output the mean sd min p50 and max statistics of these dimensions. The data format is f(%6.2f)
- output
logout outputs the above basic statistics table to Word/EXCEL
*Output to word
logout ,save(table) word replace:  ///
           tabstat  price wei len mpg rep78, ///
           stats(mean sd min p50 max) c(s) f(%6.2f)
*Output to excel
logout ,save(table) excel replace:  ///
           tabstat  price wei len mpg rep78, ///
           stats(mean sd min p50 max) c(s) f(%6.2f)
asdoc is another powerful output method. sum stands for summarize. The result output of commands such as summarize, correlate, tabstat, cross tabs, regions and t-tests can be obtained through this method. Just add "asdoc" in front of it
asdoc can also fuse multiple regression results into a table and keep snowballing; it can also make grouping descriptive statistics according to classification
If you want to know more about the asdoc command or if you don't understand it, you can stamp this link asdoc: Stata result output is another sharp weapon!
local varlist "wage age race married grade collgrad south union occupation"
///If you want to experiment by yourself, replace the characters in varlist with your own variables
asdoc sum `varlist', save(Myfile.rtf) replace ///
	stat(N mean sd min p50 max)  dec(3) ///
	title(asdoc_Table: Descriptive statistics)
esttab can set the decimal places of each statistic separately, and control the N decimal places by adding (fmt(n)) after the corresponding statistic
local varlist "wage age race married grade collgrad south union occupation"
estpost summarize `varlist', detail
esttab using Myfile.rtf, ///
	cells("count mean(fmt(2)) sd(fmt(2)) min(fmt(4)) p50(fmt(4)) max(fmt(4))") ///
	noobs compress replace title(esttab_Table: Descriptive statistics)
If you want to use Chinese variable names, you can try sum2docx, which can also control the decimal places like esttab, but the disadvantage is that you can't see the results in the command interface.
local varlist "wage age race married grade collgrad south union occupation"
sum2docx `varlist' using Myfile.docx,replace ///
	stats(N mean(%9.2f) sd(%9.3f) min(%9.2f) median(%9.2f) max(%9.2f)) ///
	title(sum2docx_Table: Descriptive statistics)
The above command can replace the variable in the varlist local variable '' with its own variable when running.
For example:
local varlist " prate mrate totpart totelg"
estpost summarize `varlist', detail
esttab using Myfile.rtf, ///
	cells("count mean(fmt(2)) sd(fmt(2))") ///
	noobs compress replace title(esttab_Table: My Descriptive statistics)
4, Correlation coefficient matrix
The asdoc command is relatively simple, but it has many limitations. There is no way to customize the output of asterisk and p value. It is suitable for beginners
local varlist "wage age race married grade collgrad"
asdoc cor `varlist', save(Myfile.doc) replace nonum dec(3) ///
	title(asdoc_Table: correlation coefficient matrix)
corr2docx supports Chinese, but other commands do not.
local varlist "wage age race married grade collgrad"
corr2docx `varlist' using Myfile.docx, replace spearman(ignore) pearson(pw) ///
	star title(corr2docx_Table: correlation coefficient matrix)
When outputting logout, there will be serial problems, and there is no way to output the title, so it is troublesome and is not recommended
local varlist "wage age race married grade collgrad"
logout, save(Myfile) word replace : pwcorr_a `varlist', ///
	star1(0.01) star5(0.05) star10(0.1)
Methods for customizing asterisks: pwcorr_a and esttab (for the use and extension of esttab, see this article to explain the understanding method and logic of commands)
pwcorr_a price weight mpg displ, star1(0.01) star5(0.05) star10(0.1)
sysuse auto, clearlogout, save(Quantitative economics) word replace: ///
pwcorr_a price wei len mpg displ, star1(0.01) star5(0.05) star10(0.1)
///
///esttab
///
local varlist "wage age race married grade collgrad"
estpost correlate `varlist', matrix
esttab using Myfile.rtf, ///
	unstack not noobs compress nogaps replace star(* 0.1 ** 0.05 *** 0.01) ///
	b(%8.3f) p(%8.3f) title(esttab_Table: correlation coefficient matrix)
5, Regression results
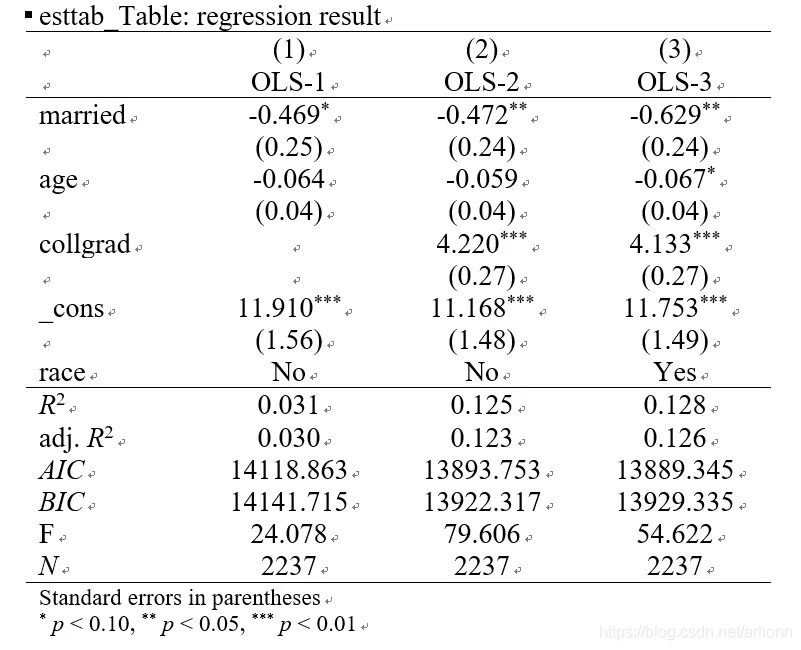
The command esttab that most conforms to the chart format of general contributions, research and various documents is as follows (pay attention to the position of statistics and variables in the table)
The command is as follows:
reg wage age married occupation
est store r1
reg wage age married collgrad occupation
est store r2
reg wage age married collgrad occupation race_num*
est store r3
esttab r1 r2 r3 using Myfile.rtf, ///
	replace star( * 0.10 ** 0.05 *** 0.01 ) nogaps compress ///
	order(married) drop(occupation) b(%20.3f) se(%7.2f)
	///Sort by married and discard occupation
	r2(%9.3f) ar2 aic bic obslast scalars(F)  ///
	indicate("race=race_num*") mtitles("OLS -1" "OLS-2" "OLS-3") ///
	title(esttab_Table: Regression result)
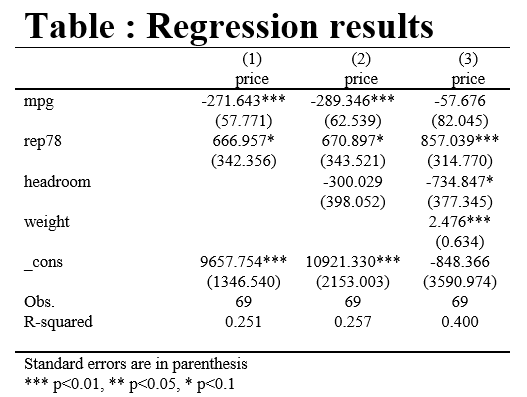
The pictures output by the asdoc command are not as regular as the former, and variables cannot be sorted, which can be understood as "snowballing multiple times"“
asdoc reg wage age married occupation, save(Myfile.doc) nest replace ///
	cnames(OLS-1) rep(se) add(race, no)
asdoc reg wage age married collgrad occupation, save(Myfile.doc) nest append ///
	cnames(OLS-2) add(race, no)
asdoc reg wage age married collgrad occupation race_num*, save(Myfile.doc) nest append ///
	add(race, yes) cnames(OLS-3) dec(3) drop(occupation race_num*) ///
	stat(r2_a, F, rmse, rss) title(asdoc_Table: regression result)
However, if the research only needs to output R^2, it does not need F statistics, and it does not need to add statistics after the third regression, you can use asdoc, which is more convenient. The results are shown in the figure. (for details, please see the figure.) asdoc: Stata result output is another sharp weapon!
)
reference resources:
Stata: graduation thesis gift pack A -- demonstration result output command competition
Stata result output: logout, esttab, logout2