catalogue
1. First look at the dynamic rendering
1. Determine the screen LED resolution for product online deployment
2, Overall architecture design
3, Coding implementation (based on length and readability, some key codes are shown here)
3. Echarts auto highlight effect
4. httpserver code of back-end python implementation
4, Online operation effect and command
As mentioned above, I have recently received suggestions from many small partners. Whether the data source on the large screen can display more kinds, such as Excel and database, is closer to the actual work scene of small partners and can be applied in work soon. Therefore, this article was born at the request of small partners [ Dynamic real-time large screen example based on Echarts + Python (Excel data source) - Visual large screen case]. In addition, many actual display scenes need automatic playback effects. This case also shows the pie chart and map highlighting effects triggered by Events and DispatchAction, which is very practical.
Before, many partners said whether they could offer some video courses to learn Echarts, so that they can get started more quickly. Recently, they squeezed out some time to record Echart-0 basic introduction series (14 courses in total)Basic introduction to Echarts-0 - Other Video Tutorials - programming language - CSDN programmer Institute It's officially launched. I hope you can give me more support.
Don't say much, start sharing dry goods, welcome to discuss! QQ wechat same No.: 6550523
❤️ Effect display ❤️
1. First look at the dynamic rendering

2. Rich theme styles


I Determine the demand scheme
1. Determine the screen LED resolution for product online deployment
1280px*768px, F11 full screen without scroll bar; Other resolution screens can be displayed adaptively.
2. Deployment mode
- Based on installation free executable program: support various mainstream operating systems such as Windows, Linux and Mac; Copy the executable program exe to the server without other environment dependence;
- Viewing mode: it can not only directly view the program interface on the server, but also open and play remotely using the browser. It supports mainstream browsers such as Chrome browser and 360 browser.
2, Overall architecture design
- The front end is designed based on Echarts open source library and uses WebStorm editor;
- The back-end is implemented based on Python Web and uses pychart editor;
- Data transmission format: JSON; Data source type: Excel;
- Data source type: this case adopts python request to collect real-time data. In the actual development requirements, it supports customizing HTTP API interface mode or other various types of databases, such as PostgreSQL, MySQL, Oracle, Microsoft SQL Server, SQLite, Excel table, etc.
- Data update method: in order to display data, this case adopts the method of regular pull. In the actual development requirements, the back-end data is updated in real time and pushed to the front-end display in real time;
3, Coding implementation (based on length and readability, some key codes are shown here)
1. Front end html code
<body style="background-color: #01030c">

      <div class="container_fluid">
            <div class="row_fluid" id="vue_app">
                  <div style="padding:0 0" class="col-xs-12 col-md-12">
                        <dv-decoration-1 style="height:4%;">
                        </dv-decoration-1>

                        <h3 id="container_h"></h3>

                  </div>

                  <div style="padding:0 0" class="col-xs-12 col-md-3">

                        <dv-border-box-13 style="height:29%;padding:0 0" class="col-xs-12 col-md-12">
                              <div style="height:100%;padding:5% 5% 5% 5%;" id="container_0"></div>
                        </dv-border-box-13>

                        <div style="padding:0 0" class="col-xs-12 col-md-12">
                              <dv-border-box-13 style="height:29%;padding:0 0" class="col-xs-12 col-md-12">
                                    <div style="height:100%;padding:5% 5% 5% 5%;" id="container_1"></div>
                              </dv-border-box-13>
                        </div>

                        <div style="padding:0 0" class="col-xs-12 col-md-12">
                              <dv-border-box-13 style="height:29%;padding:0 0" class="col-xs-12 col-md-12">
                                    <div style="height:100%;padding:5% 5% 5% 5%;" id="container_2"></div>
                              </dv-border-box-13>
                        </div>
                  </div>

                  <div style="padding:0 0" class="col-xs-12 col-md-6">

                        <dv-border-box-13 style="height:87%;padding:0 0" class="col-xs-12 col-md-12">
                              <div style="height:100%;padding: 2% 2% 2% 2%" id="container_3"></div>
                        </dv-border-box-13>
                  </div>

                  <div style="padding:0 0" class="col-xs-12 col-md-3">
                        <dv-border-box-13 style="height:29%;padding:0 0" class="col-xs-12 col-md-12">
                              <div style="height:100%;padding:5% 5% 5% 5%;" id="container_4"></div>
                        </dv-border-box-13>

                        <div style="padding:0 0" class="col-xs-12 col-md-12">
                              <dv-border-box-13 style="height:29%;padding:0 0" class="col-xs-12 col-md-12">
                                    <div style="height:100%;padding:5% 5% 5% 5%;" id="container_5"></div>
                              </dv-border-box-13>
                        </div>

                        <div style="padding:0 0" class="col-xs-12 col-md-12">
                              <dv-border-box-13 style="height:29%;padding:0 0" class="col-xs-12 col-md-12">
                                    <div style="height:100%;padding:5% 5% 5% 5%;" id="container_6"></div>
                              </dv-border-box-13>
                        </div>
                  </div>

            </div>
      </div>
</body>
2. Front end JS code
var idContainer_5 = "container_5";
function initEchart_5() {
  // Initialize the ecarts instance based on the prepared dom
  var myChart = echarts.init(
    document.getElementById(idContainer_5),
    window.gTheme
  );

  option = {
    title: {
      text: "Proportion of model price",
      left: "left",
      textStyle: {
        color: "#3690be",
        fontSize: "10",
      },
    },
    grid: {
      left: "5%",
      top: "20%",
      right: "10%",
      bottom: "5%",
      containLabel: true,
    },
    tooltip: {},
    dataset: {
      source: [],
    },
    xAxis: [
      {
        name: "quantity",
        type: "value",
        axisLabel: {
          rotate: 50,
          show: true,
          textStyle: {
            color: "rgba(255,255,255,.7)",
            fontSize: "10",
          },
          formatter: "{value}%",
        },

        splitLine: {
          lineStyle: {
            color: "rgba(255,255,255,.7)",
          },
        },
      },
    ],
    yAxis: [
      {
        name: "Price",
        type: "category",
        axisLabel: {
          show: true,
          textStyle: {
            color: "rgba(255,255,255,.7)",
            fontSize: "10",
          },
        },

        splitLine: {
          show: false,
        },
      },
    ],

    series: [
      {
        type: "bar",
      },
    ],
  };

  // Display the chart using the configuration item and data you just specified.
  myChart.setOption(option);
  window.addEventListener("resize", function () {
    myChart.resize();
  });
}

function asyncData_5() {
  $.get("bar_equipment.json").done(function (data) {
    var myChart = echarts.init(document.getElementById(idContainer_5));

    myChart.setOption({
      dataset: { source: data },
    });
  });
}
initEchart_5();
3. Echarts auto highlight effect
The pie chart and map in this example are added with automatic highlighting effect. This function is very useful for display.
setInterval(function () {
    var myChart = echarts.init(document.getElementById(container));
    var dataLen = 0;
    try {
      dataLen = myChart.getOption().dataset[0]["source"].length;
    } catch {
      dataLen = myChart.getOption().series[0]["data"].length;
    }

    // Cancels previously highlighted shapes
    myChart.dispatchAction({
      type: "downplay",
      seriesIndex: 0,
      dataIndex: currentIndex,
    });

    currentIndex = (currentIndex + 1) % dataLen;
    // Highlight the current drawing
    myChart.dispatchAction({
      type: "highlight",
      seriesIndex: 0,
      dataIndex: currentIndex,
    });
    // Show tooltip
    myChart.dispatchAction({
      type: "showTip",
      seriesIndex: 0,
      dataIndex: currentIndex,
    });
  }, 1000);
4. httpserver code of back-end python implementation
def HttpServer():
    try:
        server = HTTPServer((ip, port), MyRequestHandler)
        listen = "http://%s:%d" % (ip, port)
        print("Server listening address: ", listen)
        server.serve_forever()
    except ValueError as e:
        print("Exception", e)
        server.socket.close()


if __name__ == "__main__":
    HttpServer()
5. Excel data source and code
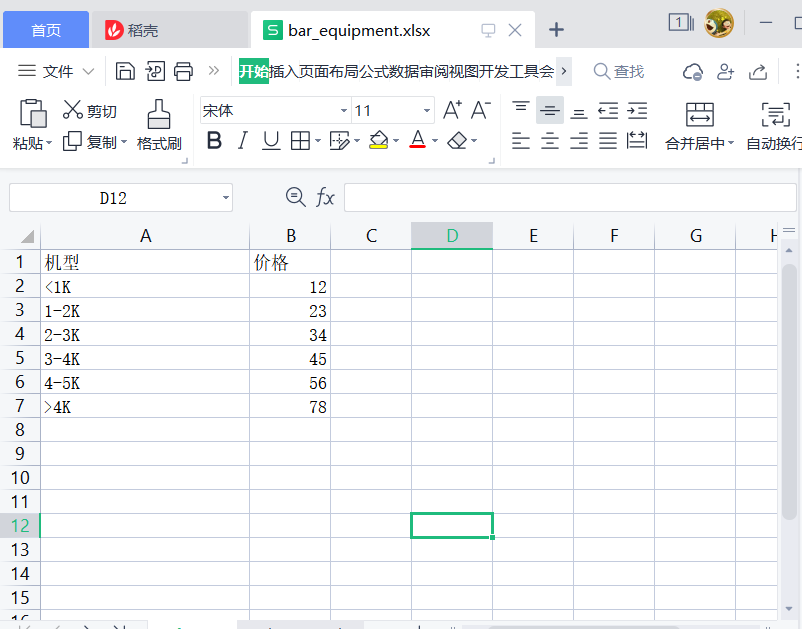
        if self.path.find("bar_equipment.json") >= 0:
            df = pd.read_excel("excel/bar_equipment.xlsx")
            result = df.to_json(orient='values')
4, Online operation effect and command

<!-- start-up server command -->
python httpserver.py

<!-- Enter the web address in the browser to view the large screen (the port is httpserver.py Medium port Parameter definition) -->
http://localhost:88xx

<!-- For more information, please refer to my blog home page  -->
https://yydatav.blog.csdn.net/

<!-- More case references -->
https://blog.csdn.net/lildkdkdkjf/article/details/120705616
5, Source download
Note: the source code includes python's httpserver + Excel data source code + ecarts
This sharing is over, welcome to discuss! QQ wechat same No.: 6550523
6, More wonderful cases
YYDataV's data visualization "wonderful case summary"_ YYDataV blog - CSDN blog