The data system in the group cannot meet the performance requirements when undertaking a business requirement, so some optimizations are made for this scenario, and an article is written here for records.
The business scenario is as follows: the caller obtains hundreds of characteristics of a user at a time (characteristics can be understood as attributes), the characteristics are stored in the persistent KV database in the form of redis hash, and the characteristic data is updated at the day level. The delay of 95th percentile is required to be about 5ms.
This data system is a stateless service. In order to increase throughput and reduce latency, it is optimized from two aspects: storage and code.
Storage level
At the storage level, 300 features of a user are called at a time. The original scheme uses redis hash as a table, and each field is a feature of the user. Since a single request of a user will acquire hundreds of features, i.e. using hmget for merging, the storage also needs to obtain data from multiple slot s, which is inefficient, so the data is normalized, that is, all filed s of the hash table are packaged into a json format string, for example:
// The feature before optimization is hash format
hash key : user_2837947
127.0.0.1:6379> hgetall user_2837947
1) "name"    // Feature 1
2) "French fries"     // Value of characteristic 1
3) "age"    // Feature 2
4) "18"     // Value of characteristic 2
5) "address" // Feature 3
6) "China"   // Value of characteristic 3

// The optimized feature is string json format
string key: user_2837947
val:
{
  "name":"French fries",
  "age":18,
  "address":"China"
}
After the feature is packaged, the problem of large delay in obtaining data from multiple slot s at one request is solved. But doing so may bring new problems: if there are too many hash files, the value value of string will be very large. At present, there are two solutions. One is to subdivide the characteristics according to the type. For example, the original string with 300 fields is divided into three string types with 100 values. The second is to compress string val, compress the storage when storing data, and decompress it in the program when reading data. The two methods can also be used in combination.
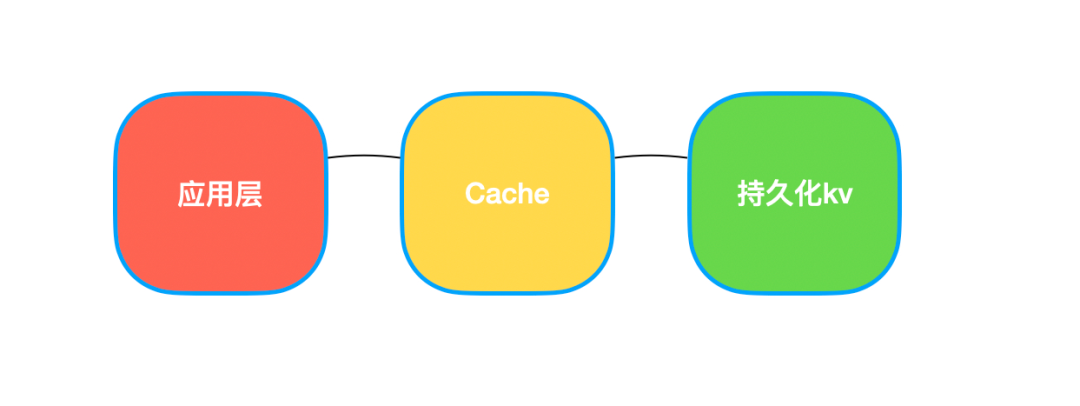
If this still fails to meet the requirements, you can add another layer of cache before persistent KV storage, and the cache expiration time is set according to the business characteristics, so that the process of program interaction will become like this:
Code level
Next, let's optimize the code. First, we need several tools to help us do performance optimization. The first is the pressure measurement tool, which can simulate the real flow and observe the performance of the system under the estimated QPS. Pay attention to gradual pressurization during pressure generation, and don't press too hard next time.
Then you need the profiler tool. Related tools in Golang's ecology include pprof and trace. Pprof can see the time consumption of each part of the system call when the pressure measurement flow comes in. Trace can view the runtime, for example, the collaboration scheduling information. This optimization uses the CPU profiler of pressure measurement tool + pprof.
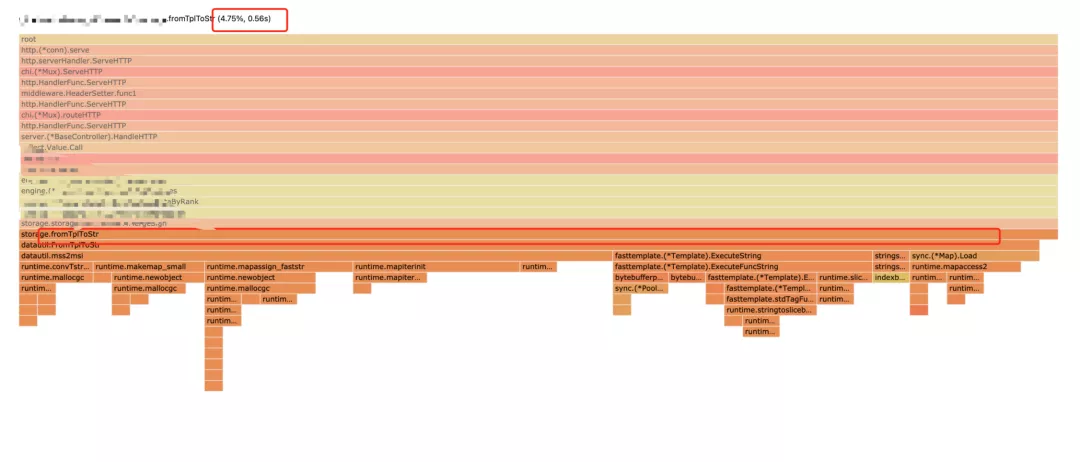
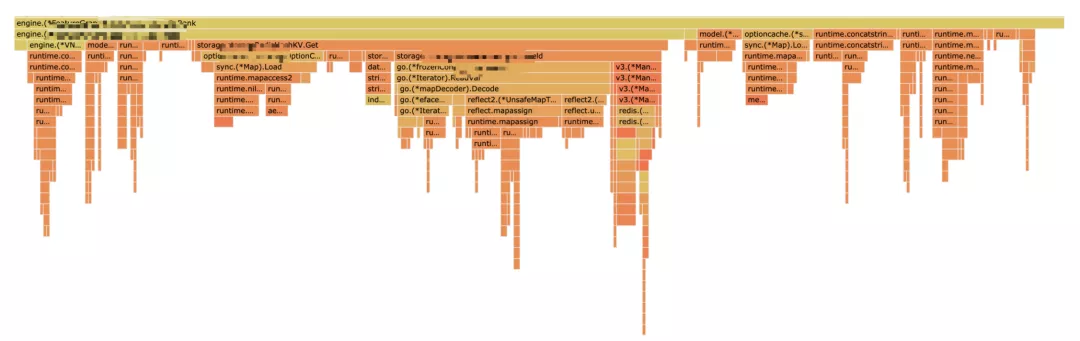
Let's take a look at the CPU running time:
The right side is mainly the runtime part, which is ignored first
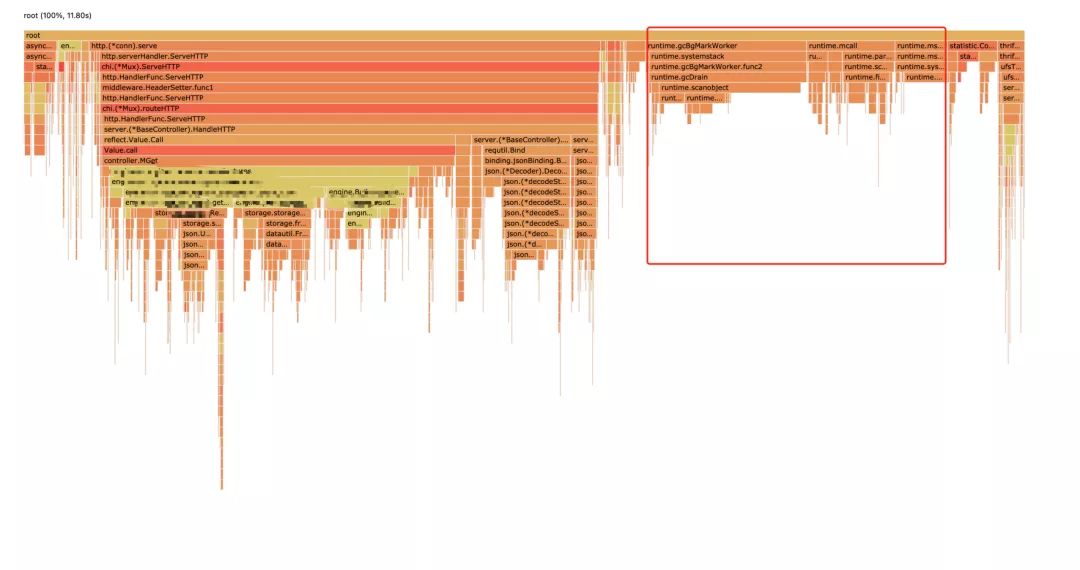
The Dapingding mountain circled in the flame diagram can be optimized,
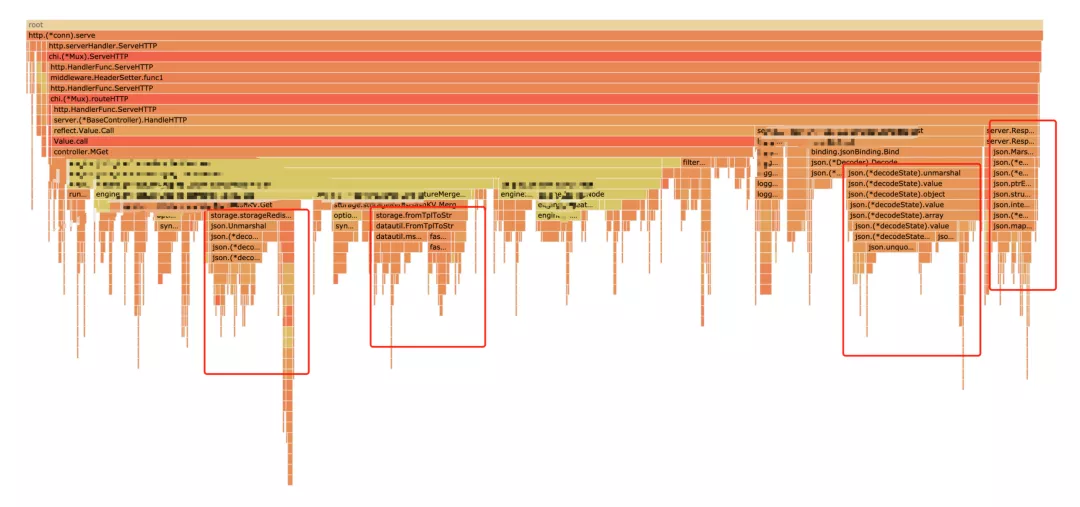
The three flat top mountains here are mainly caused by json.Marshal and json.Unmarshal operations. There are two ideas for json optimization, one is to change a high-performance json parsing package, and the other is to see whether the parsing can be bypassed according to business requirements. Here are the following:
High performance analysis package + a little black Technology
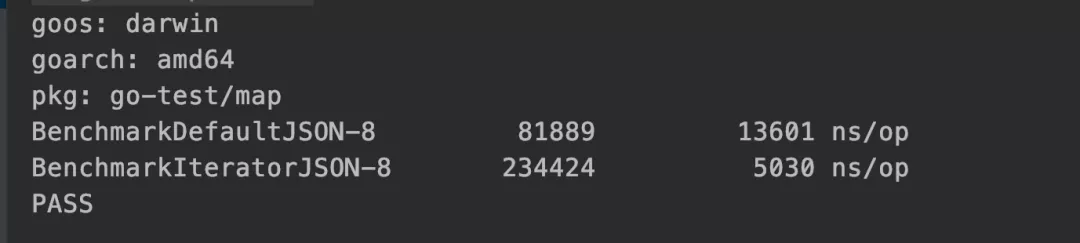
Master Tao's package github.com/json-iterator/go is used here. After reading his Benchmark results, it is still much faster than the golang native library. Write another Benchmark that is more in line with our scene to see if master Tao lied to us:
package main

import (
 "encoding/json"
 jsoniter "github.com/json-iterator/go"
 "testing"
)

var s = `{....300 Multiple filed..}`

func BenchmarkDefaultJSON(b *testing.B) {
 for i := 0; i < b.N; i++ {
  param := make(map[string]interface{})
  _ = json.Unmarshal([]byte(s), ¶m)
 }
}

func BenchmarkIteratorJSON(b *testing.B) {
 for i := 0; i < b.N; i++ {
  param := make(map[string]interface{})
  var json = jsoniter.ConfigCompatibleWithStandardLibrary
  _ = json.Unmarshal([]byte(s), ¶m)
 }
}
Operation results:
This package is also very easy to use. Just add a line of code to the original json code analysis:
var json = jsoniter.ConfigCompatibleWithStandardLibrary
err = json.Unmarshal(datautil.String2bytes(originData), &fieldMap
Another area that can be optimized is the conversion between string and [] byte. The parameter type we use in the code is string, and the parameter accepted by json parsing is [] byte. Therefore, conversion is generally required during json parsing:
err = json.Unmarshal([]byte(originData), &fieldMap)
So what happens when string is converted to [] byte.
package main

func main(){
  a := "string"
  b := []byte(a)
  println(b)
}
We use assembly to catch what the compiler does quietly:
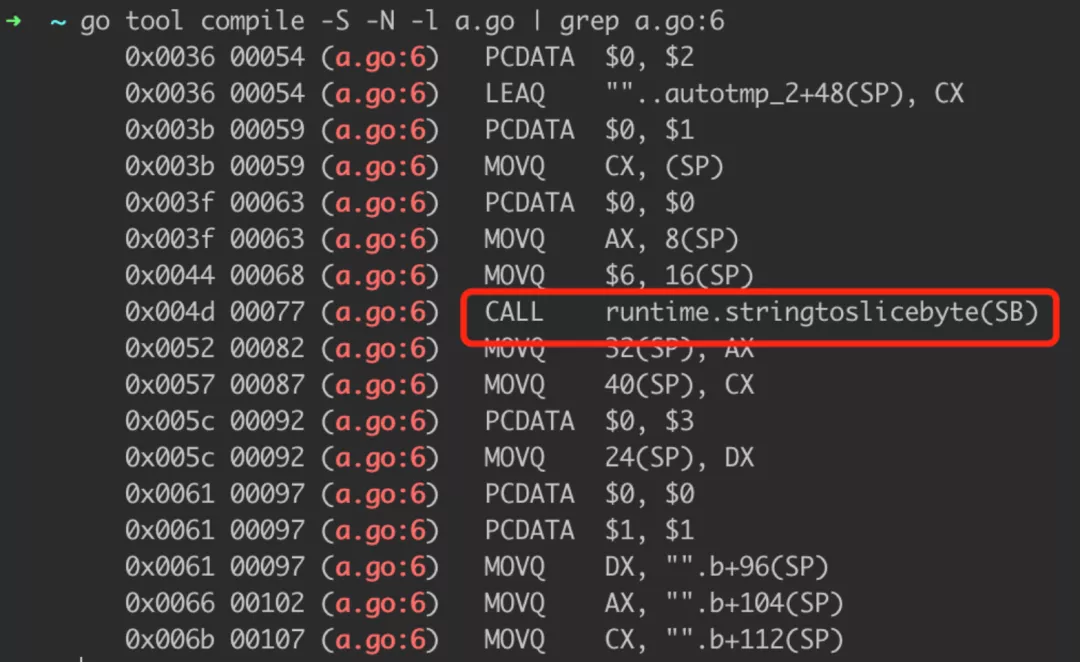
Let's see what this function does:
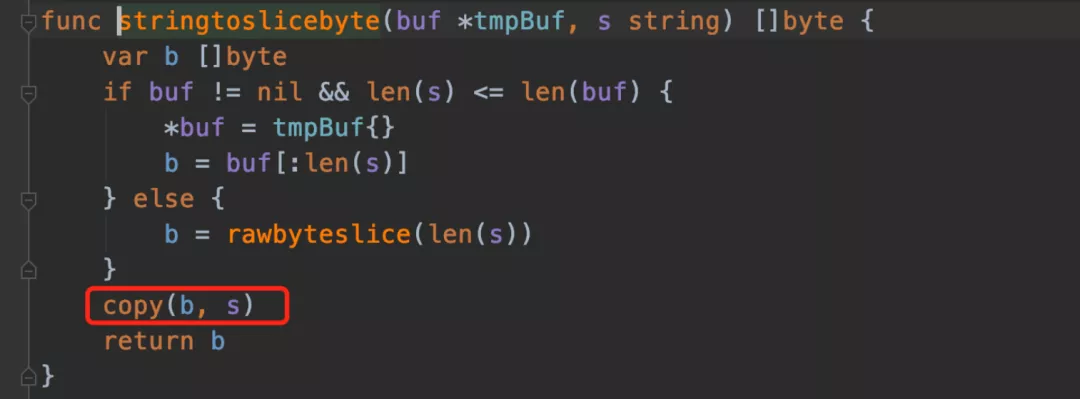
Here, the bottom layer will be copied. We can get the bottom structure of [] byte and string and remove the copy process with black Technology:
func String2bytes(s string) []byte {
 x := (*[2]uintptr)(unsafe.Pointer(&s))
 h := [3]uintptr{x[0], x[1], x[1]}
 return *(*[]byte)(unsafe.Pointer(&h))
}

func Bytes2String(b []byte) string {
 return *(*string)(unsafe.Pointer(&b))
}
Write a benchmark below to see if black technology is easy to use:
package main

import (
 "strings"
 "testing"
)

var s = strings.Repeat("hello", 1024)

func testDefault() {
 a := []byte(s)
 _ = string(a)
}

func testUnsafe() {
 a := String2bytes(s)
 _ = Bytes2String(a)
}

func BenchmarkTestDefault(b *testing.B) {
 for i := 0; i < b.N; i++ {
  testDefault()
 }
}

func BenchmarkTestUnsafe(b *testing.B) {
 for i := 0; i < b.N; i++ {
  testUnsafe()
 }
}
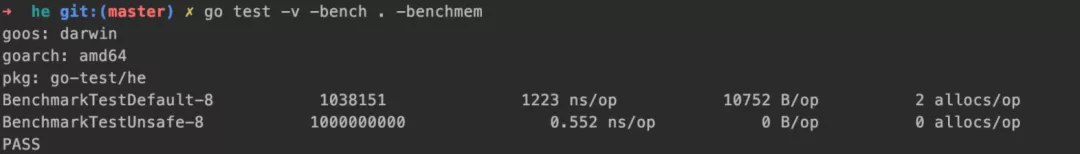
The effect of running speed and memory allocation is obvious. Black technology is really black:
Add cache, space for time
There is a piece of code in the project that handles the parameters in N requests. The code is as follows:
for _, item := range items {
  var params map[string]string
  err := json.Unmarshal([]byte(items[1]), ¶ms)
  if err != nil {
    ...
  }
}
In this scenario that needs to be optimized, the upstream obtains more than 300 features of a user in a single request. If we use the above code, we need json.Unmarshal300 times. This is a useless and time-consuming operation. You can add cache optimization:
paramCache := make(map[string]map[string]string)
 for _, item := range items {
  var params map[string]string

  tmpParams, ok := cacheDict[items[1]]
  // Not resolved, please resolve
  if ok == false {
   err := json.Unmarshal([]byte(items[1]), ¶ms)
   if err != nil {
    ...
   }
   cacheDict[items[1]] = params
  } else {
      // Resolved, copy out a copy
      // copy here is to prevent concurrency problems
   params = DeepCopyMap(tmpParams)
  }
 }
In this way, there will be no amplification in theory. Readers, if there is a batch interface and similar operations in the code, you can see whether there is the possibility of optimization here.
for {
  dosomething()
}
Replace time-consuming logic
In the flame diagram TplToStr The template function also takes up a large CPU time. The function of this function is to spell out a new string from the parameters passed by the user and the prefabricated template, such as:
Input: Tpl: shutiao_test_{{user_id}} user_id: 123478
 return: shutiao_test_123478
In our system, this function spells out a flag according to the template and user parameters, and takes it as the mark of an operation according to whether the flag is the same or not. This template splicing is a very time-consuming operation. String splicing can be directly used to replace the template function, such as:
Input: Tpl: shutiao_test_{{user_id}} user_id: 123478
 return: shutiao_test_user_id_123478
After optimization, the flat top mountain of this function can no longer be seen in the flame diagram, which directly saves 5% of the call percentage of CPU.
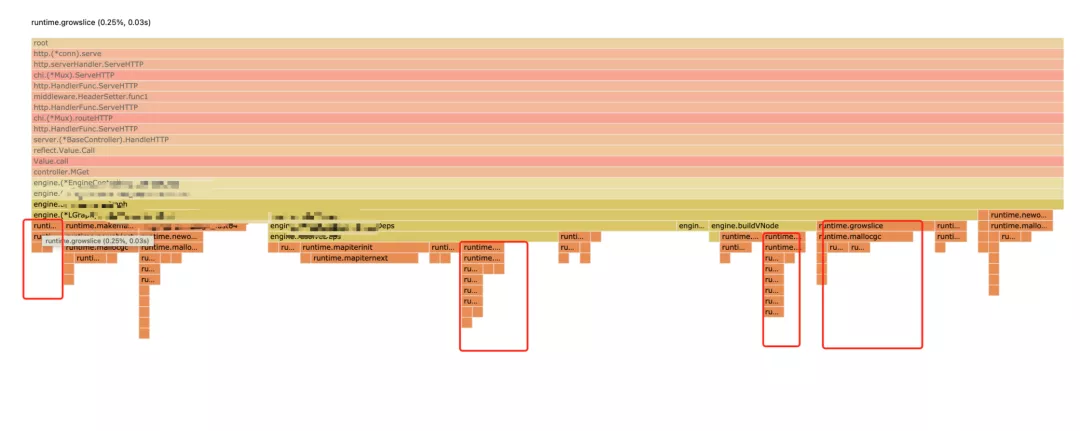
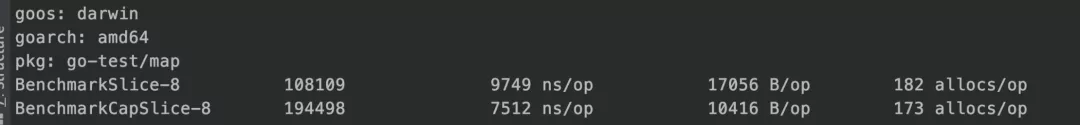
prealloc
It is also found that some growslice s take up a small amount of cpu time. I thought pre allocation could solve the problem, but the benchmark test shows that whether pre allocation is done or not has little difference in performance when the slice capacity is small:
package main

import "testing"

func test(m *[]string) {
 for i := 0; i < 300; i++ {
  *m = append(*m, string(i))
 }
}

func BenchmarkSlice(b *testing.B) {
 for i := 0; i < b.N; i++ {
  b.StopTimer()
  m := make([]string, 0)
  b.StartTimer()

  test(&m)
 }
}

func BenchmarkCapSlice(b *testing.B) {
 for i := 0; i < b.N; i++ {
  b.StopTimer()
  m := make([]string, 300)
  b.StartTimer()

  test(&m)
 }
}
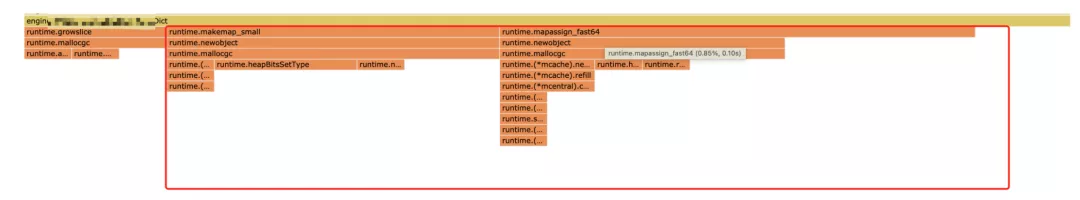
You can also pre allocate the map used in the code. If you can confirm the capacity when writing the map, try to initialize the capacity with the make function.
package main
import "testing"
func test(m map[string]string) {
for i := 0; i < 300; i++ {
m[string(i)] = string(i)
}
}
func BenchmarkMap(b *testing.B) {
for i := 0; i < b.N; i++ {
b.StopTimer()
m := make(map[string]string)
b.StartTimer()
test(m)
}
}
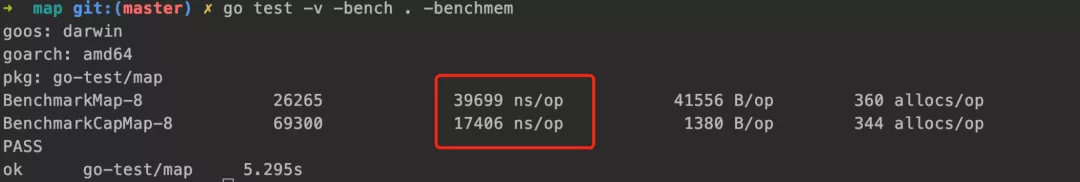
func BenchmarkCapMap(b *testing.B) {
for i := 0; i < b.N; i++ {
b.StopTimer()
m := make(map[string]string, 300)
b.StartTimer()
test(m)
}
}
This optimization is quite effective:
Asynchronization
Some operations in the interface process that do not affect the main process can be asynchronized, such as statistics sent out. In golang, asynchronization is a collaborative process.
Summarize the routine:
The optimization at the code level is us level, and the optimization of storage for business can be ms level, so the closer the optimization is to the application layer, the better the effect. At the code level, the optimization steps are:
- The pressure measurement tool simulates the real flow required by the scene
- pprof and other tools view the CPU and mem time consumption of the service
- Lock Pingdingshan logic and see the possibility of Optimization: asynchronization, change logic, add cache, etc
- After local optimization, write the benchmark tool to view the optimization effect
- After the overall optimization, go back to step 1, conduct pressure measurement + pprof again to see the effect, and see whether the 95th percentile time can meet the requirements (if it can't meet the requirements, change the storage ~.
Original link:
https://mp.weixin.qq.com/s/j3zr3alRpHdKh4tUKHqrKQ
For more information, you can pay attention to the official account "w's programming diary" and reply to Java for more information.