Catalogue of series articles
Near infrared spectroscopy is a cross cutting field, which requires cooperation in chemistry, computer science, bioscience and other fields. Therefore, under the guidance of (teacher Yang Huihua team of Beijing University of Posts and Telecommunications), we are preparing to open source the traditional classical algorithms such as PLS, SVM, ANN and RF, preprocessing such as SG, MSC, first-order derivative and second-order derivative, wavelength selection algorithms such as GA, and the latest deep learning algorithms such as CNN and AE, To help other professionals more easily establish near-infrared spectral models with good prediction ability and robustness.
preface
NIRS is an electromagnetic wave between visible light and mid infrared light, with a wavelength range of (1100 ∼ 2526 nm. Due to the near infrared spectral region and hydrogen containing groups (OH, NH, CH, SH) in organic molecules The frequency combination of vibration is consistent with the absorption region of frequency doubling at all levels. The characteristic information of hydrogen containing groups of organic molecules in the sample can be obtained by scanning the near-infrared spectrum of the sample, which is often used as an effective carrier to obtain the sample information. The detection method based on NIRS has the advantages of convenience, high efficiency, accuracy, low cost, on-site detection and no damage to the sample, and is widely used in many fields Various detection fields. However, near-infrared spectroscopy has some problems, such as spectral bandwidth, serious overlap, weak absorption signal, complex information analysis, etc. unlike common chemical analysis methods, it can only be used as an indirect measurement method, and can not directly analyze the content or category of the measured sample. It depends on chemometric methods, which is between the attribute value of the sample to be measured and the near-infrared spectrum data A correlation model (or Calibration Model) is established, and then the near-infrared spectra of unknown samples are predicted by the model to obtain the predicted values of various components. The existing near-infrared modeling methods mainly include classical modeling (preprocessing + wavelength screening for feature dimensionality reduction and highlighting, and then modeling by pls and svm algorithms) and deep learning methods (end to end modeling has low dependence on preprocessing, wavelength selection, etc.)This paper mainly describes CNN's qualitative analysis and modeling method of near infrared spectroscopy
1, Data source
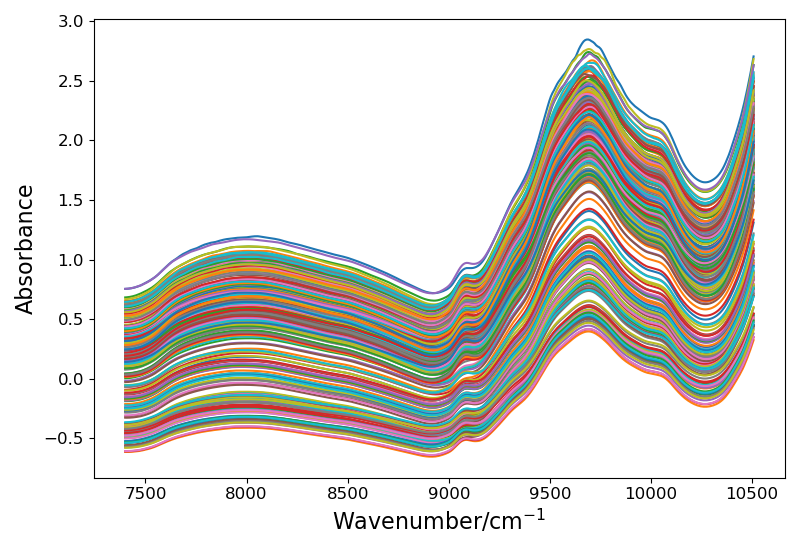
Open source drugs are used, with a total of 310 samples and 404 variables for each sample. They are divided into four categories according to active ingredients, Download address
The picture is as follows:

! [drug data spectrum]( https://img-blog.csdnimg.cn/7d76d4b1ed4d4f71a150298bdae3da74.png?x-oss-process=image/watermark,type_ZHJvaWRzYW5zZmFsbGJhY2s,shadow_50,text_Q1NETiBARWNob19Db2Rl,size_20,color_FFFFFF,t_70,g_se,x_16
2, Code interpretation
1.1 reading data
#Load data
def TableDataLoad(tp, test_ratio, start, end, seed):

    # global data_x
    data_path = './/Data//table.csv'
    Rawdata = np.loadtxt(open(data_path, 'rb'), dtype=np.float64, delimiter=',', skiprows=0)
    table_random_state = seed

    if tp =='raw':
        data_x = Rawdata[0:, start:end]
    if tp =='SG':
        SGdata_path = './/Data//TableSG.csv'
        data = np.loadtxt(open(SGdata_path, 'rb'), dtype=np.float64, delimiter=',', skiprows=0)
        data_x = data[0:, start:end]
    if tp =='SNV':
        SNVata_path = './/Data//TableSNV.csv'
        data = np.loadtxt(open(SNVata_path, 'rb'), dtype=np.float64, delimiter=',', skiprows=0)
        data_x = data[0:, start:end]
    if tp == 'MSC':
        MSCdata_path = './/Data//TableMSC.csv'
        data = np.loadtxt(open(MSCdata_path, 'rb'), dtype=np.float64, delimiter=',', skiprows=0)
        data_x = data[0:, start:end]
    data_y = Rawdata[0:, -1]
    x_col = np.linspace(7400, 10507, 404)
    plotspc(x_col, data_x[:, :], tp=0)

    x_data = np.array(data_x)
    y_data = np.array(data_y)


    print('Training set size:{}'.format(len(X_train[:,0])))
    print('Test set size:{}'.format(len(X_test[:,0])))
1.2 dividing data sets
X_train, X_test, y_train, y_test = train_test_split(x_data, y_data, test_size=test_ratio,random_state=table_random_state)

1.3 return the training set and test set and draw spectral pictures
    data_train, data_test = ZspPocess(X_train, X_test,y_train,y_test,need=True) #for cnn :false only used in proseesing comparsion
    return data_train, data_test
! [displayed spectral curve]( https://img-blog.csdnimg.cn/2d09358a92d4476fb073c3705d57561d.png?x-oss-process=image/watermark,type_ZHJvaWRzYW5zZmFsbGJhY2s,shadow_50,text_Q1NETiBARWNob19Db2Rl,size_20,color_FFFFFF,t_70,g_se,x_16
2.1 establishment of 1-D CNN model
class CNN3Lyaers(nn.Module):
    def __init__(self, nls):
        super(CNN3Lyaers, self).__init__()
        self.CONV1 = nn.Sequential(
            nn.Conv1d(1, 64, 21, 1),
            nn.BatchNorm1d(64),  # Homogenize the output
            nn.ReLU(),
            nn.MaxPool1d(3, 3)
        )
        self.CONV2 = nn.Sequential(
            nn.Conv1d(64, 64, 19, 1),
            nn.BatchNorm1d(64),  # Homogenize the output
            nn.ReLU(),
            nn.MaxPool1d(3, 3)
        )
        self.CONV3 = nn.Sequential(
            nn.Conv1d(64, 64, 17, 1),
            nn.BatchNorm1d(64),  # Homogenize the output
            nn.ReLU(),
            nn.MaxPool1d(3, 3),
        )
        self.fc = nn.Sequential(
            # nn.Linear(4224, nls)
            nn.Linear(384, nls)
        )

    def forward(self, x):
        x = self.CONV1(x)
        x = self.CONV2(x)
        x = self.CONV3(x)
        x = x.view(x.size(0), -1)
        # print(x.size())
        out = self.fc(x)
        out = F.softmax(out,dim=1)
        return out
2.2 training 1-D CNN model
def CNNTrain(tp, test_ratio, BATCH_SIZE, n_epochs, nls):

    # data_train, data_test = DataLoad(tp, test_ratio, 0, 404)
    data_train, data_test = TableDataLoad(tp, test_ratio, 0, 404, seed=80)
    train_loader = torch.utils.data.DataLoader(data_train, batch_size=BATCH_SIZE, shuffle=True)
    test_loader = torch.utils.data.DataLoader(data_test, batch_size=BATCH_SIZE, shuffle=True)

    store_path = ".//model//all//CNN18"

    model = CNN3Lyaers(nls=nls).to(device)
    optimizer = optim.Adam(model.parameters(),
                           lr=0.0001,weight_decay=0.0001)
    scheduler = torch.optim.lr_scheduler.ReduceLROnPlateau(optimizer, 'min', factor=0.5, verbose=1, eps=1e-06,
                                                           patience=10)
    criterion = nn.CrossEntropyLoss().to(device)  # The loss function is a focal loss function, which is often used in multi classification problems with category imbalance
    early_stopping = EarlyStopping(patience=30, delta=1e-4, path=store_path, verbose=False)

    for epoch in range(n_epochs):
        train_acc = []
        for i, data in enumerate(train_loader):  # gives batch data, normalize x when iterate train_loader
            model.train()  # No training
            inputs, labels = data  # Both input and label are equal to data
            inputs = Variable(inputs).type(torch.FloatTensor).to(device)  # batch x
            labels = Variable(labels).type(torch.LongTensor).to(device)  # batch y
            output = model(inputs)  # cnn output
            trian_loss = criterion(output, labels)  # cross entropy loss
            optimizer.zero_grad()  # clear gradients for this training step
            trian_loss.backward()  # backpropagation, compute gradients
            optimizer.step()  # apply gradients
            _, predicted = torch.max(output.data, 1)
            y_predicted = predicted.detach().cpu().numpy()
            y_label = labels.detach().cpu().numpy()
            acc = accuracy_score(y_label, y_predicted)
            train_acc.append(acc)

        with torch.no_grad():  # No gradient
            test_acc = []
            testloss = []
            for i, data in enumerate(test_loader):
                model.eval()  # No training
                inputs, labels = data  # Both input and label are equal to data
                inputs = Variable(inputs).type(torch.FloatTensor).to(device)  # batch x
                labels = Variable(labels).type(torch.LongTensor).to(device)  # batch y
                outputs = model(inputs)  # The output is equal to the input after entering the network
                test_loss = criterion(outputs, labels)  # cross entropy loss
                _, predicted = torch.max(outputs.data,1)
                predicted = predicted.cpu().numpy()
                labels = labels.cpu().numpy()
                acc = accuracy_score(labels, predicted)
                test_acc.append(acc)
                testloss.append(test_loss.item())
                avg_loss = np.mean(testloss)

            scheduler.step(avg_loss)
            early_stopping(avg_loss, model)
            if early_stopping.early_stop:
                print(f'Early stopping! Best validation loss: {early_stopping.get_best_score()}')
                break
2.3 testing 1-D CNN model
def CNNtest(tp, test_ratio, BATCH_SIZE, nls):
    # data_train, data_test = DataLoad(tp, test_ratio, 0, 404)
    data_train, data_test = TableDataLoad(tp, test_ratio, 0, 404, seed=80)
    test_loader = torch.utils.data.DataLoader(data_test, batch_size=BATCH_SIZE, shuffle=True)

    store_path = ".//model//all//CNN18"

    model = CNN3Lyaers(nls=nls).to(device)

    model.load_state_dict(torch.load(store_path))
    test_acc = []
    for i, data in enumerate(test_loader):
        model.eval()  # No training
        inputs, labels = data  # Both input and label are equal to data
        inputs = Variable(inputs).type(torch.FloatTensor).to(device)  # batch x
        labels = Variable(labels).type(torch.LongTensor).to(device)  # batch y
        outputs = model(inputs)  # The output is equal to the input after entering the network
        _, predicted = torch.max(outputs.data, 1)
        predicted = predicted.cpu().numpy()
        labels = labels.cpu().numpy()
        acc = accuracy_score(labels, predicted)
        test_acc.append(acc)
    return np.mean(test_acc)
3 run the CNN model and view the results with
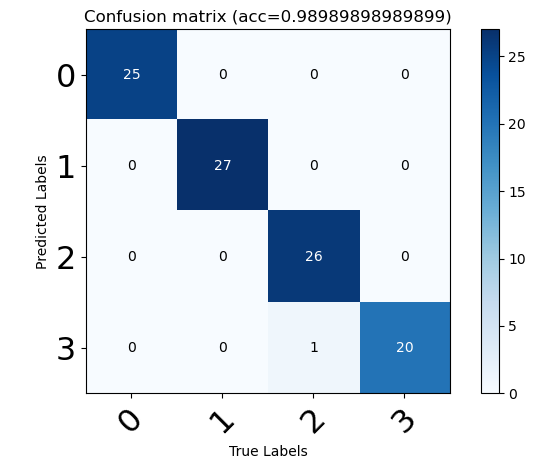
Get model accuracy

In order to take a closer look at the causes of model errors, we use the confusion matrix to look further, and the results are as follows:
summary
The complete code is available from GitHub warehouse
The code is for academic use only. If you have any questions, please contact QQ: 1427950662, wechat: Fu_siry