Development environment:
Development environment: Python 3
Tools: pandas, matplotlib.pyplot
Data source:
Data address: data set
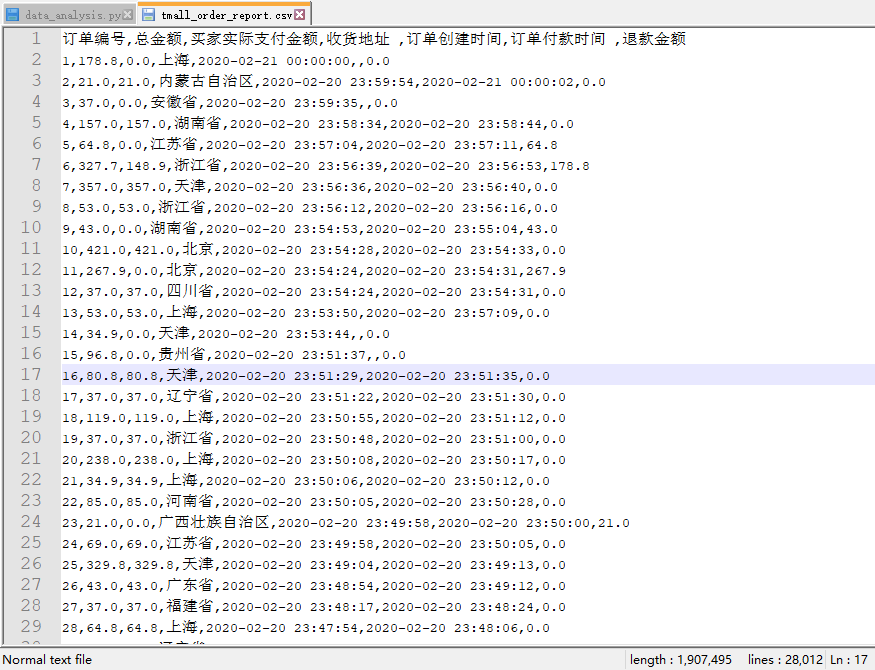
Data Description: a total of 28010 pieces of data occurred in one month were collected in this data set,
Include the following:
['order number', 'total amount', 'buyer's actual payment amount', 'receiving address',' order creation time ',' order payment time ',' refund amount '] 7 fields.
7 field descriptions:
Order No.: Order No
Total amount: total order amount
Buyer's actual payment amount: total amount - refund amount (in case of payment). Amount is 0 (in case of unpaid)
Receiving address: each province
Order creation time: order placing time
Order payment time: payment time
Refund amount: the amount requested for refund after payment. If no payment has been made, the refund amount is 0
Data screenshot
Analysis objectives:
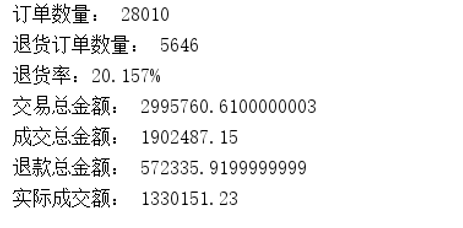
1. Overall sales
- Order transaction quantity
- Return order quantity
- Return rate
- Total transaction amount
- Total transaction amount
- Total refund amount
- Actual turnover
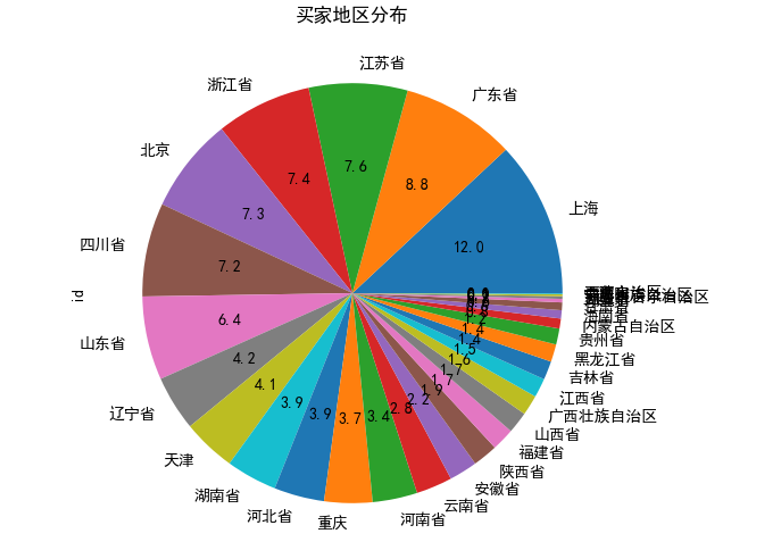
2. Regional distribution of buyers (pie chart)
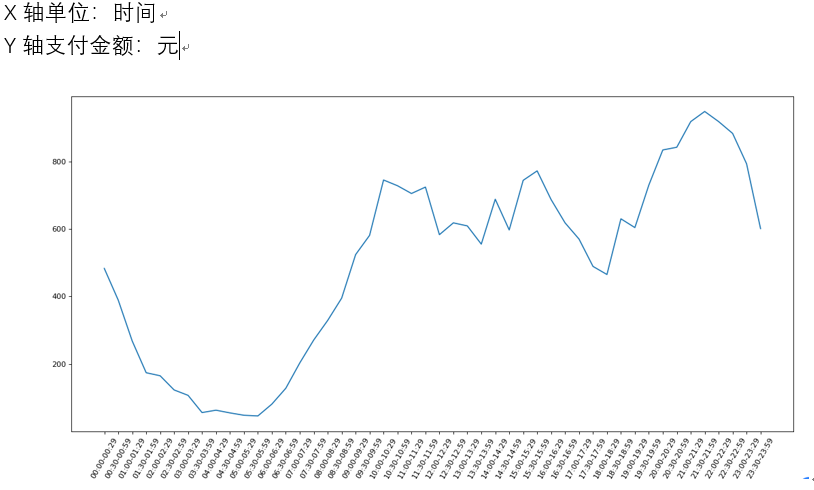
3. Time distribution of payment amount (line chart)
4. Sales trend chart (broken line chart)
Code and result:
1. Overall sales
def taobao_analysis(csv_path):
    df = pd.DataFrame(pd.read_csv(csv_path))
    #  id total amount actual payment amount address order creation time payment time refund amount
    df.columns = ['id', 'amount', 'paid', 'address', 'ordertime', 'paytime', 'refund']
    df.paytime = pd.to_datetime(df.paytime)
    df.ordertime = pd.to_datetime(df.ordertime)

    # Order transaction quantity
    order_num = df.id.count()
    # Return order quantity
    refund_num = df[df['refund'] > 0].refund.count()
    # Return rate
    refund_rate = round(refund_num / order_num * 100, 3)
    # Total transaction amount
    amount_sum = df.amount.sum()
    # Total transaction amount
    paid_sum = df.paid.sum()
    # Total refund amount
    refund_sum = df.refund.sum()
    # Actual turnover
    paymey = paid_sum - refund_sum

    print('Order quantity:', order_num)
    print('Return order quantity:', refund_num)
    print('Return rate:{}%'.format(refund_rate))
    print('Total transaction amount:', amount_sum)
    print('Total transaction amount:', paid_sum)
    print('Total refund amount:', refund_sum)
    print('Actual turnover:', paymey)
Result screenshot:
2. Regional distribution of buyers (pie chart)
def address_chart(df):
    add = df.groupby('address')['id'].count().sort_values(ascending=False)
    plt.rcParams['font.sans-serif'] = ['SimHei']
    add.plot.pie(figsize=(12,6),labels=add.index, autopct='%1.1f')
    plt.title('Regional distribution of buyers')
    plt.show()
Result screenshot
3. Time distribution of payment amount (line chart)
def time_chart(df):
    df1 = df.copy()
    df1['paytime'] = df1['paytime'].dt.time
    df1['paytime'] = pd.to_datetime(df.paytime)
    plt.figure(figsize=(20,8), dpi=80)
    s = df1['paytime'].dt.floor('30T')
    df1['paytime'] = s.dt.strftime('%H:%M') + '-' + (s+pd.Timedelta(29*60,unit='s')).dt.strftime("%H:%M")
    timedf1 = df1.groupby('paytime')['id'].count()
    timedf1.drop(index='NaT-NaT', inplace=True)
    timedf_x = timedf1.index
    timedf_y = timedf1.values
    plt.xticks(rotation=60)
    plt.plot(timedf_x, timedf_y)
    plt.show()
Result screenshot
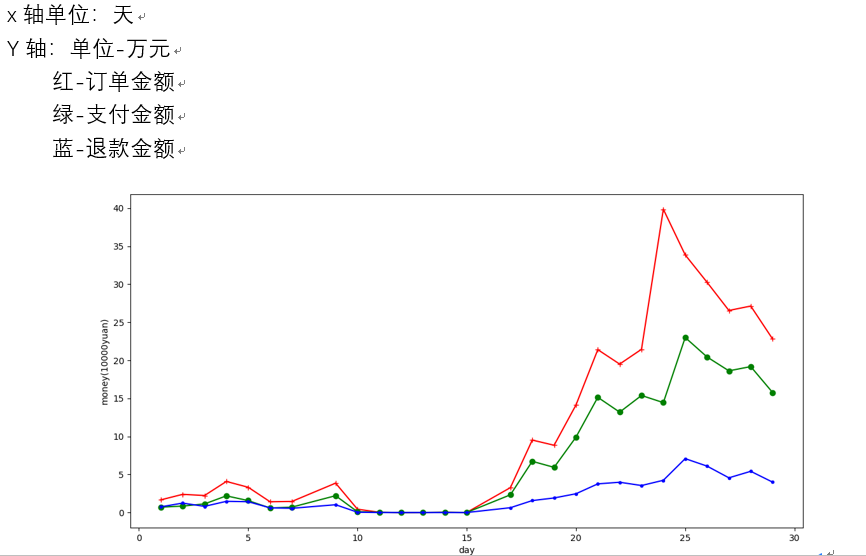
4. Sales trend chart (broken line chart)
def money_chart(df):
    df['day'] = df['ordertime'].dt.day
    xx = df.groupby('day')['amount'].sum().index
    yy_1 = df.groupby('day')['amount'].sum().values/10000
    yy_2 = df.groupby('day')['paid'].sum().values/10000
    yy_3 = df.groupby('day')['refund'].sum().values/10000
    plt.plot(xx,yy_1,label='Order Amount',color='red',marker='+')
    plt.plot(xx,yy_2,label='Payment Amount',color='green',marker='o')
    plt.plot(xx,yy_3,label='Refund Amount',color='blue',marker='.')
    plt.xlabel('day')
    plt.ylabel('money(10000yuan)')
    plt.show()
Result screenshot
Source code and data download:
CSDN Download: Download address
Baidu online disk download:
Link: https://pan.baidu.com/s/1fBMX27gkvkQ4Lowu35ymQA
Extraction code: j43u
Alicloud online disk download:
"Taobao transaction data analysis code", click the link to save, or copy this paragraph, and open the "Alibaba cloud disk" APP. You can view and enjoy it online at top speed without downloading.
Link: https://www.aliyundrive.com/s/rLmKsGffw8N