preface
1. How to analyze the method of high CPU utilization of JVM.
2. How to troubleshoot online jvm memory leaks.
3. How to locate the jvm thread deadlock problem.
4. How to solve the problem of jvm frequently full gc, etc.
These problems will be solved step by step through this article.
1, Pre preparation
1. First prepare a web service: eureka-server.jar and start it
java -jar eureka-server.jar
Download link: https://pan.baidu.com/s/1Y5DG2H_ Ggxlsyduvfut1a extraction code: lsuw
2, Common jvm commands
1.jps
View the process id of the just started erureka service: 4123
[root@centos-linux ~]# jps
4280 Jps
4123 jar
2.jmap
2.1 this command can be used to view the memory information, the number of instances and the memory occupied, and write it to obj_ In info.txt file:
[root@centos-linux opt]# jmap -histo 4123 > obj_info.txt
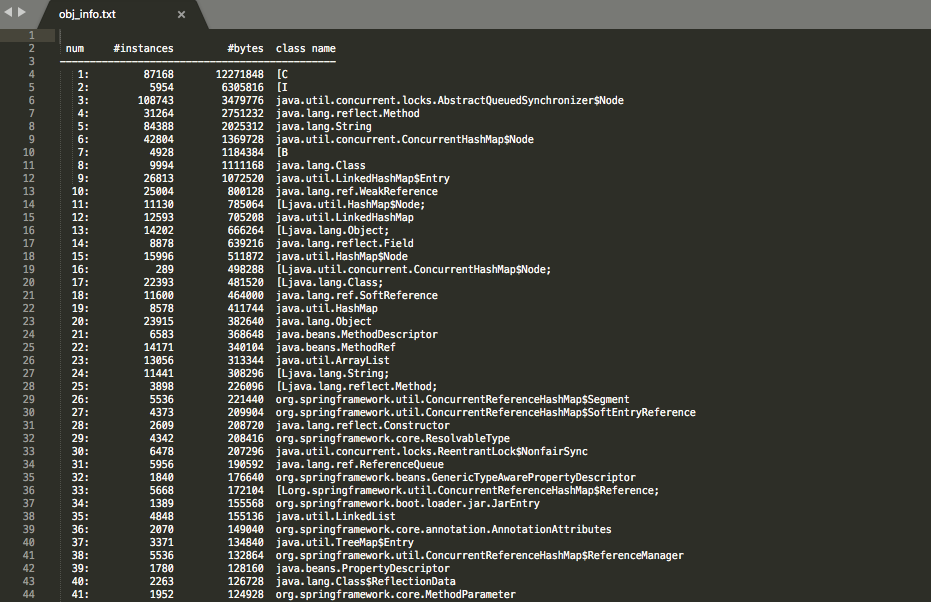
- num: serial number
- Instances: number of instances
- bytes: occupied space
- Class name: class name, [C is a char [], [S is a short [], [I is a int [], [B is a byte [], [[I is a int [] []
2.2 view heap information.
[root@centos-linux opt]# jmap -heap 4123
Attaching to process ID 4123, please wait...
Debugger attached successfully.
Server compiler detected.
JVM version is 25.181-b13

using thread-local object allocation.
Mark Sweep Compact GC

Heap Configuration:
   MinHeapFreeRatio         = 40
   MaxHeapFreeRatio         = 70
   MaxHeapSize              = 260046848 (248.0MB)
   NewSize                  = 5570560 (5.3125MB)
   MaxNewSize               = 86638592 (82.625MB)
   OldSize                  = 11206656 (10.6875MB)
   NewRatio                 = 2
   SurvivorRatio            = 8
   MetaspaceSize            = 21807104 (20.796875MB)
   CompressedClassSpaceSize = 1073741824 (1024.0MB)
   MaxMetaspaceSize         = 17592186044415 MB
   G1HeapRegionSize         = 0 (0.0MB)

Heap Usage:
New Generation (Eden + 1 Survivor Space):
   capacity = 20643840 (19.6875MB)
   used     = 4067112 (3.8787002563476562MB)
   free     = 16576728 (15.808799743652344MB)
   19.701334635416668% used
Eden Space:
   capacity = 18415616 (17.5625MB)
   used     = 3581160 (3.4152603149414062MB)
   free     = 14834456 (14.147239685058594MB)
   19.446322077958186% used
From Space:
   capacity = 2228224 (2.125MB)
   used     = 485952 (0.46343994140625MB)
   free     = 1742272 (1.66156005859375MB)
   21.80893841911765% used
To Space:
   capacity = 2228224 (2.125MB)
   used     = 0 (0.0MB)
   free     = 2228224 (2.125MB)
   0.0% used
tenured generation:
   capacity = 45654016 (43.5390625MB)
   used     = 36456800 (34.767913818359375MB)
   free     = 9197216 (8.771148681640625MB)
   79.85453021263234% used

23817 interned Strings occupying 3034368 bytes.
2.3 heap memory dump (key, commonly used to analyze OOM problems).
[root@centos-linux opt]# jmap -dump:format=b,file=eureka 4123
[root@centos-linux opt]# jmap -dump:format=b,file=eureka.hprof 4123
Dumping heap to /opt/eureka.hprof ...
Heap dump file created
Online configuration generally sets memory overflow to automatically export dump files (when the memory is large, it may not be exported)
1. -XX:+HeapDumpOnOutOfMemoryError
2. -XX:HeapDumpPath=./ (route)
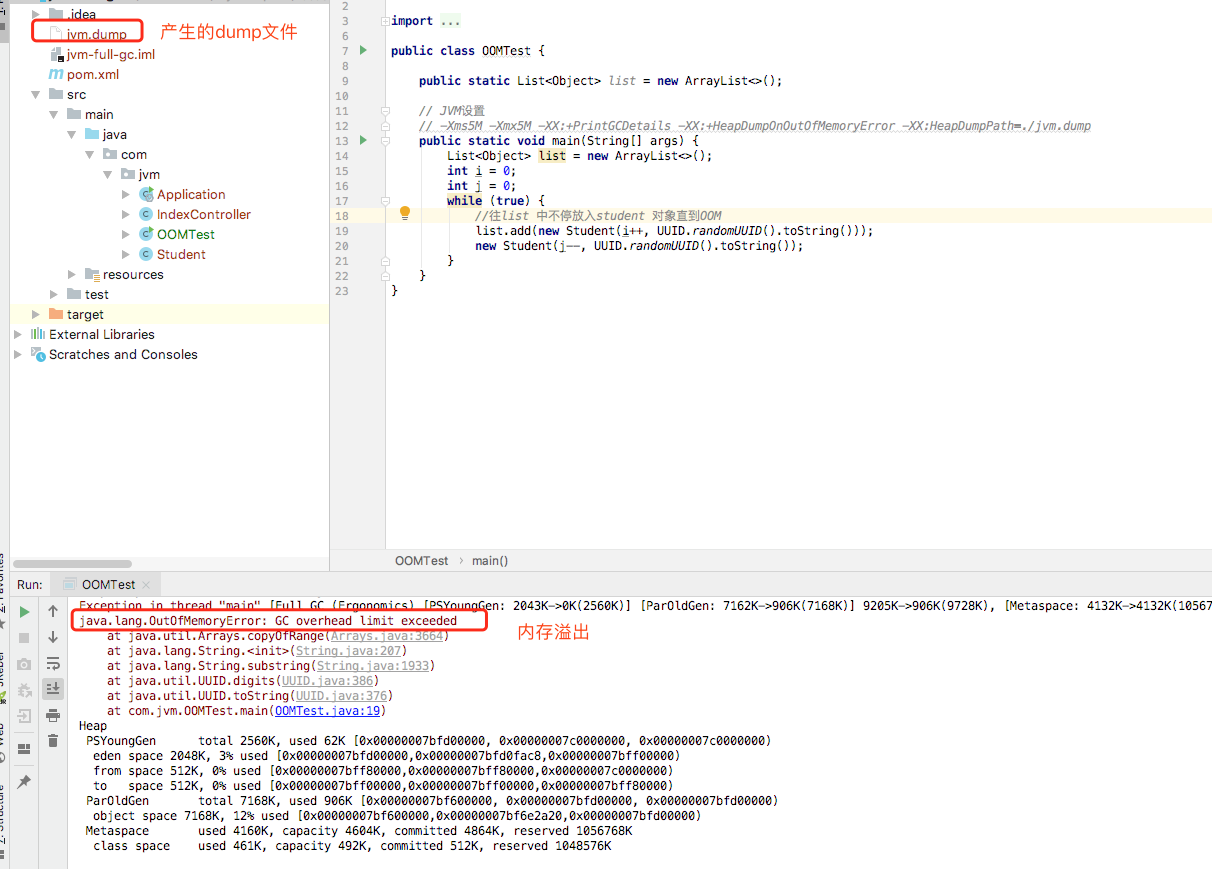
OK, let's simulate a memory overflow scenario to analyze it. The example code is as follows.
public class OOMTest {

    public static List<Object> list = new ArrayList<>();

    // JVM settings
    // -Xms5M -Xmx5M -XX:+PrintGCDetails -XX:+HeapDumpOnOutOfMemoryError -XX:HeapDumpPath=./jvm.dump
    public static void main(String[] args) {
        List<Object> list = new ArrayList<>();
        int i = 0;
        int j = 0;
        while (true) {
        //Keep putting student objects into the list until OOM
            list.add(new Student(i++, UUID.randomUUID().toString()));
            new Student(j--, UUID.randomUUID().toString());
        }
    }
}
Import the jvm.dump file into the jvisualvm command tool for analysis (the tool is available in the jdk bin directory and can be executed and run)
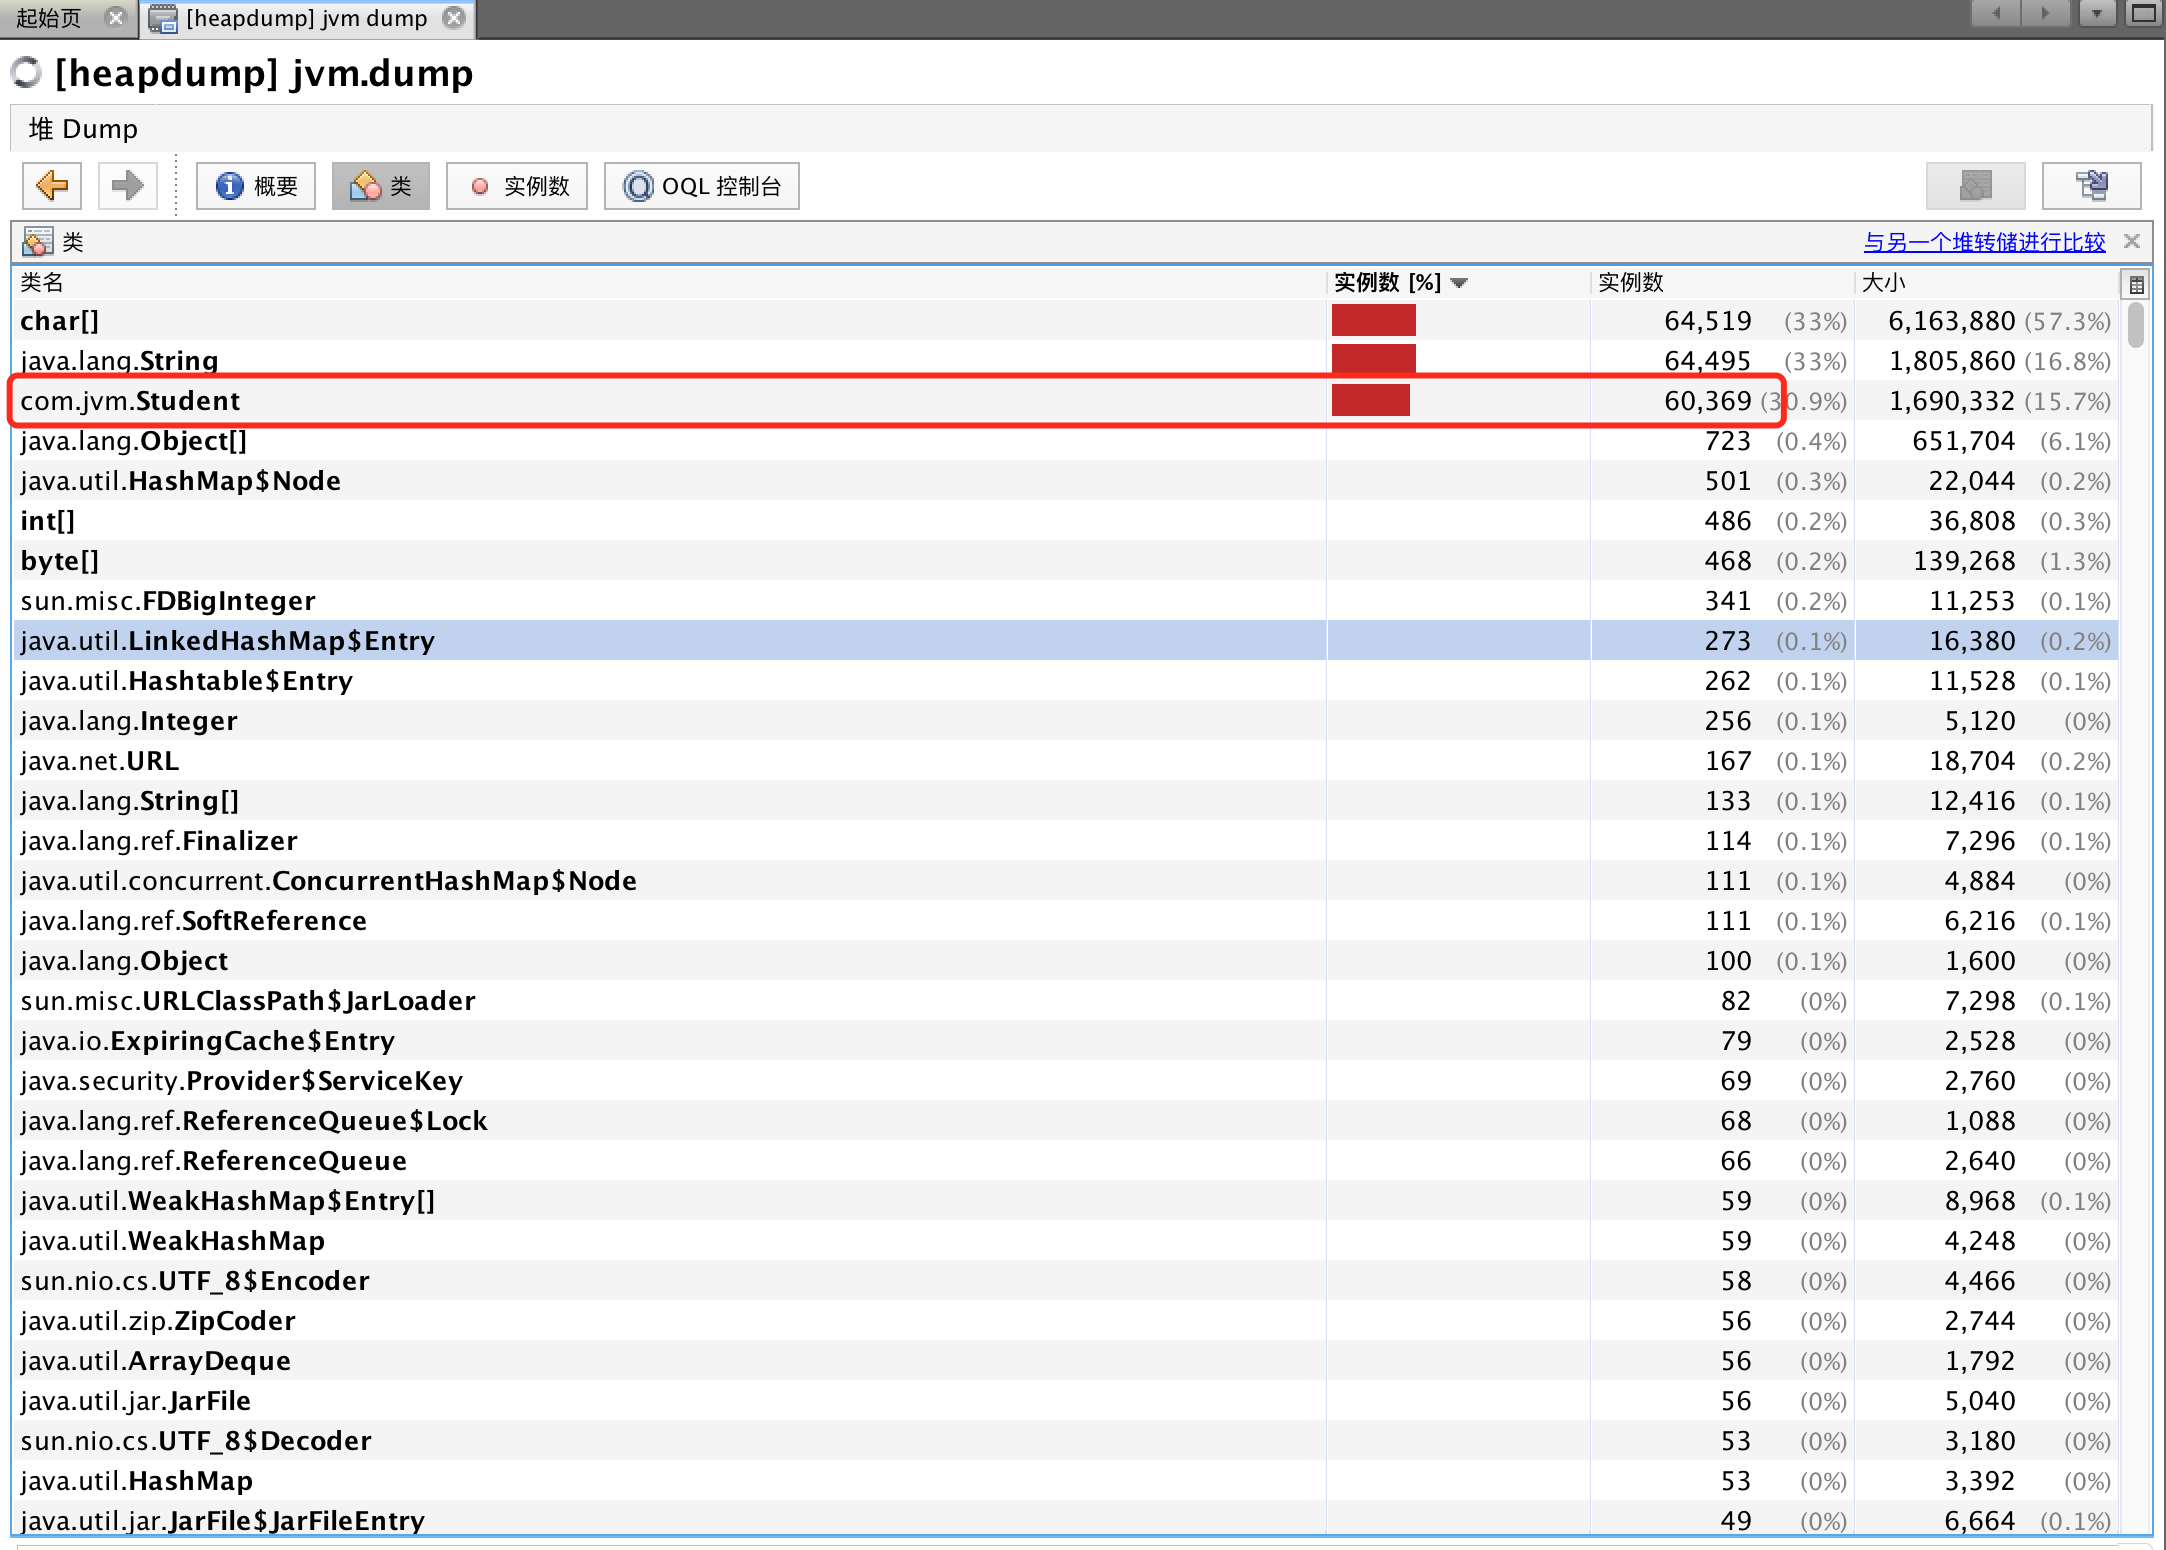
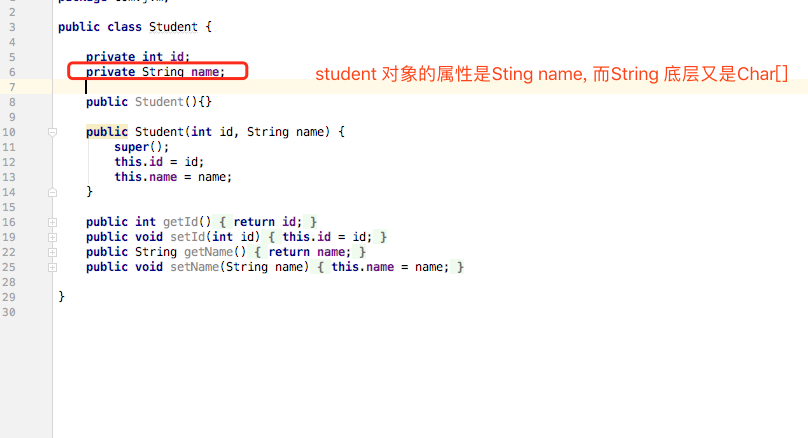
It is obvious that there are a large number of student objects in the stack. If you have small partners, you will have questions. What are the first char [], String?
3,Jstack
3.1. This command can get the information of the java stack and native stack running the java program. You can easily know the running status of the current thread. Let's use an example to learn
public class LockTest {

    private static Object lock1 = new Object();
    private static Object lock2 = new Object();

    public static void main(String[] args) {
        new Thread(() -> {

            synchronized (lock1) {
                try {
                    System.out.println("thread1 begin");
                    Thread.sleep(5000);
                } catch (InterruptedException e) {
                }
                //Got lock1. Tried to get lock2
                synchronized (lock2) {
                    System.out.println("thread1 end");
                }
            }
        }).start();

        new Thread(() -> {
            synchronized (lock2) {
                try {
                    System.out.println("thread2 begin");
                    Thread.sleep(5000);
                } catch (InterruptedException e) {
                }
                //Got lock2. Trying to get lock1
                synchronized (lock1) {
                    System.out.println("thread2 end");
                }
            }
        }).start();

        System.out.println("main thread end");
    }
}
Competing for resources leads to deadlock.
##Using jstack plus process id to find deadlock
jstack 64992
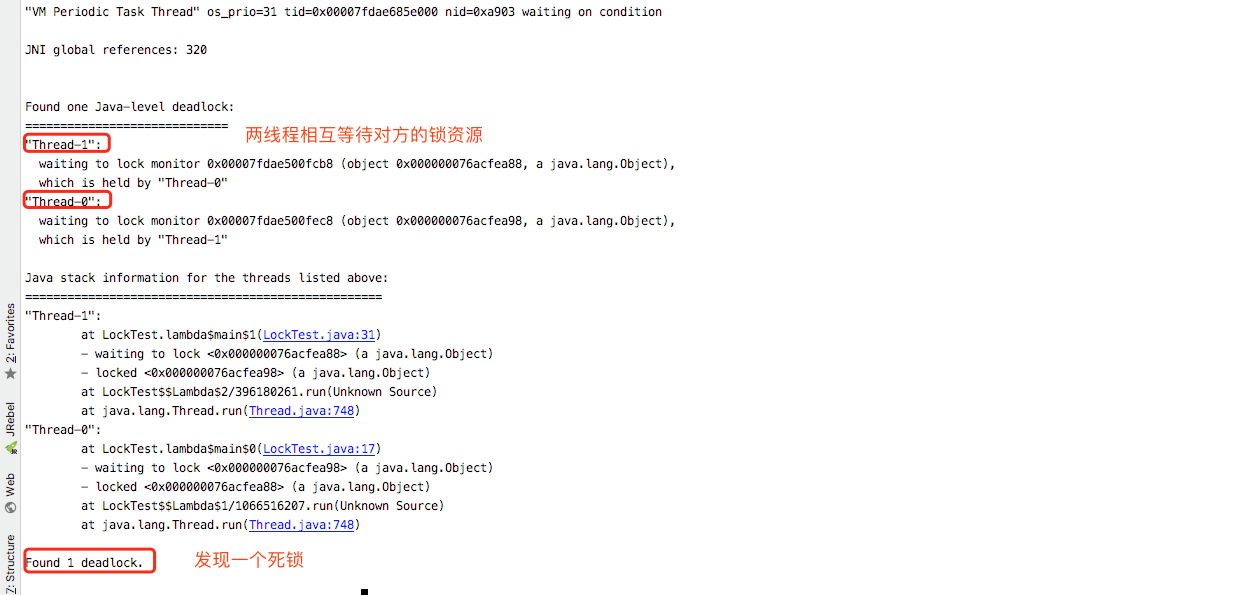
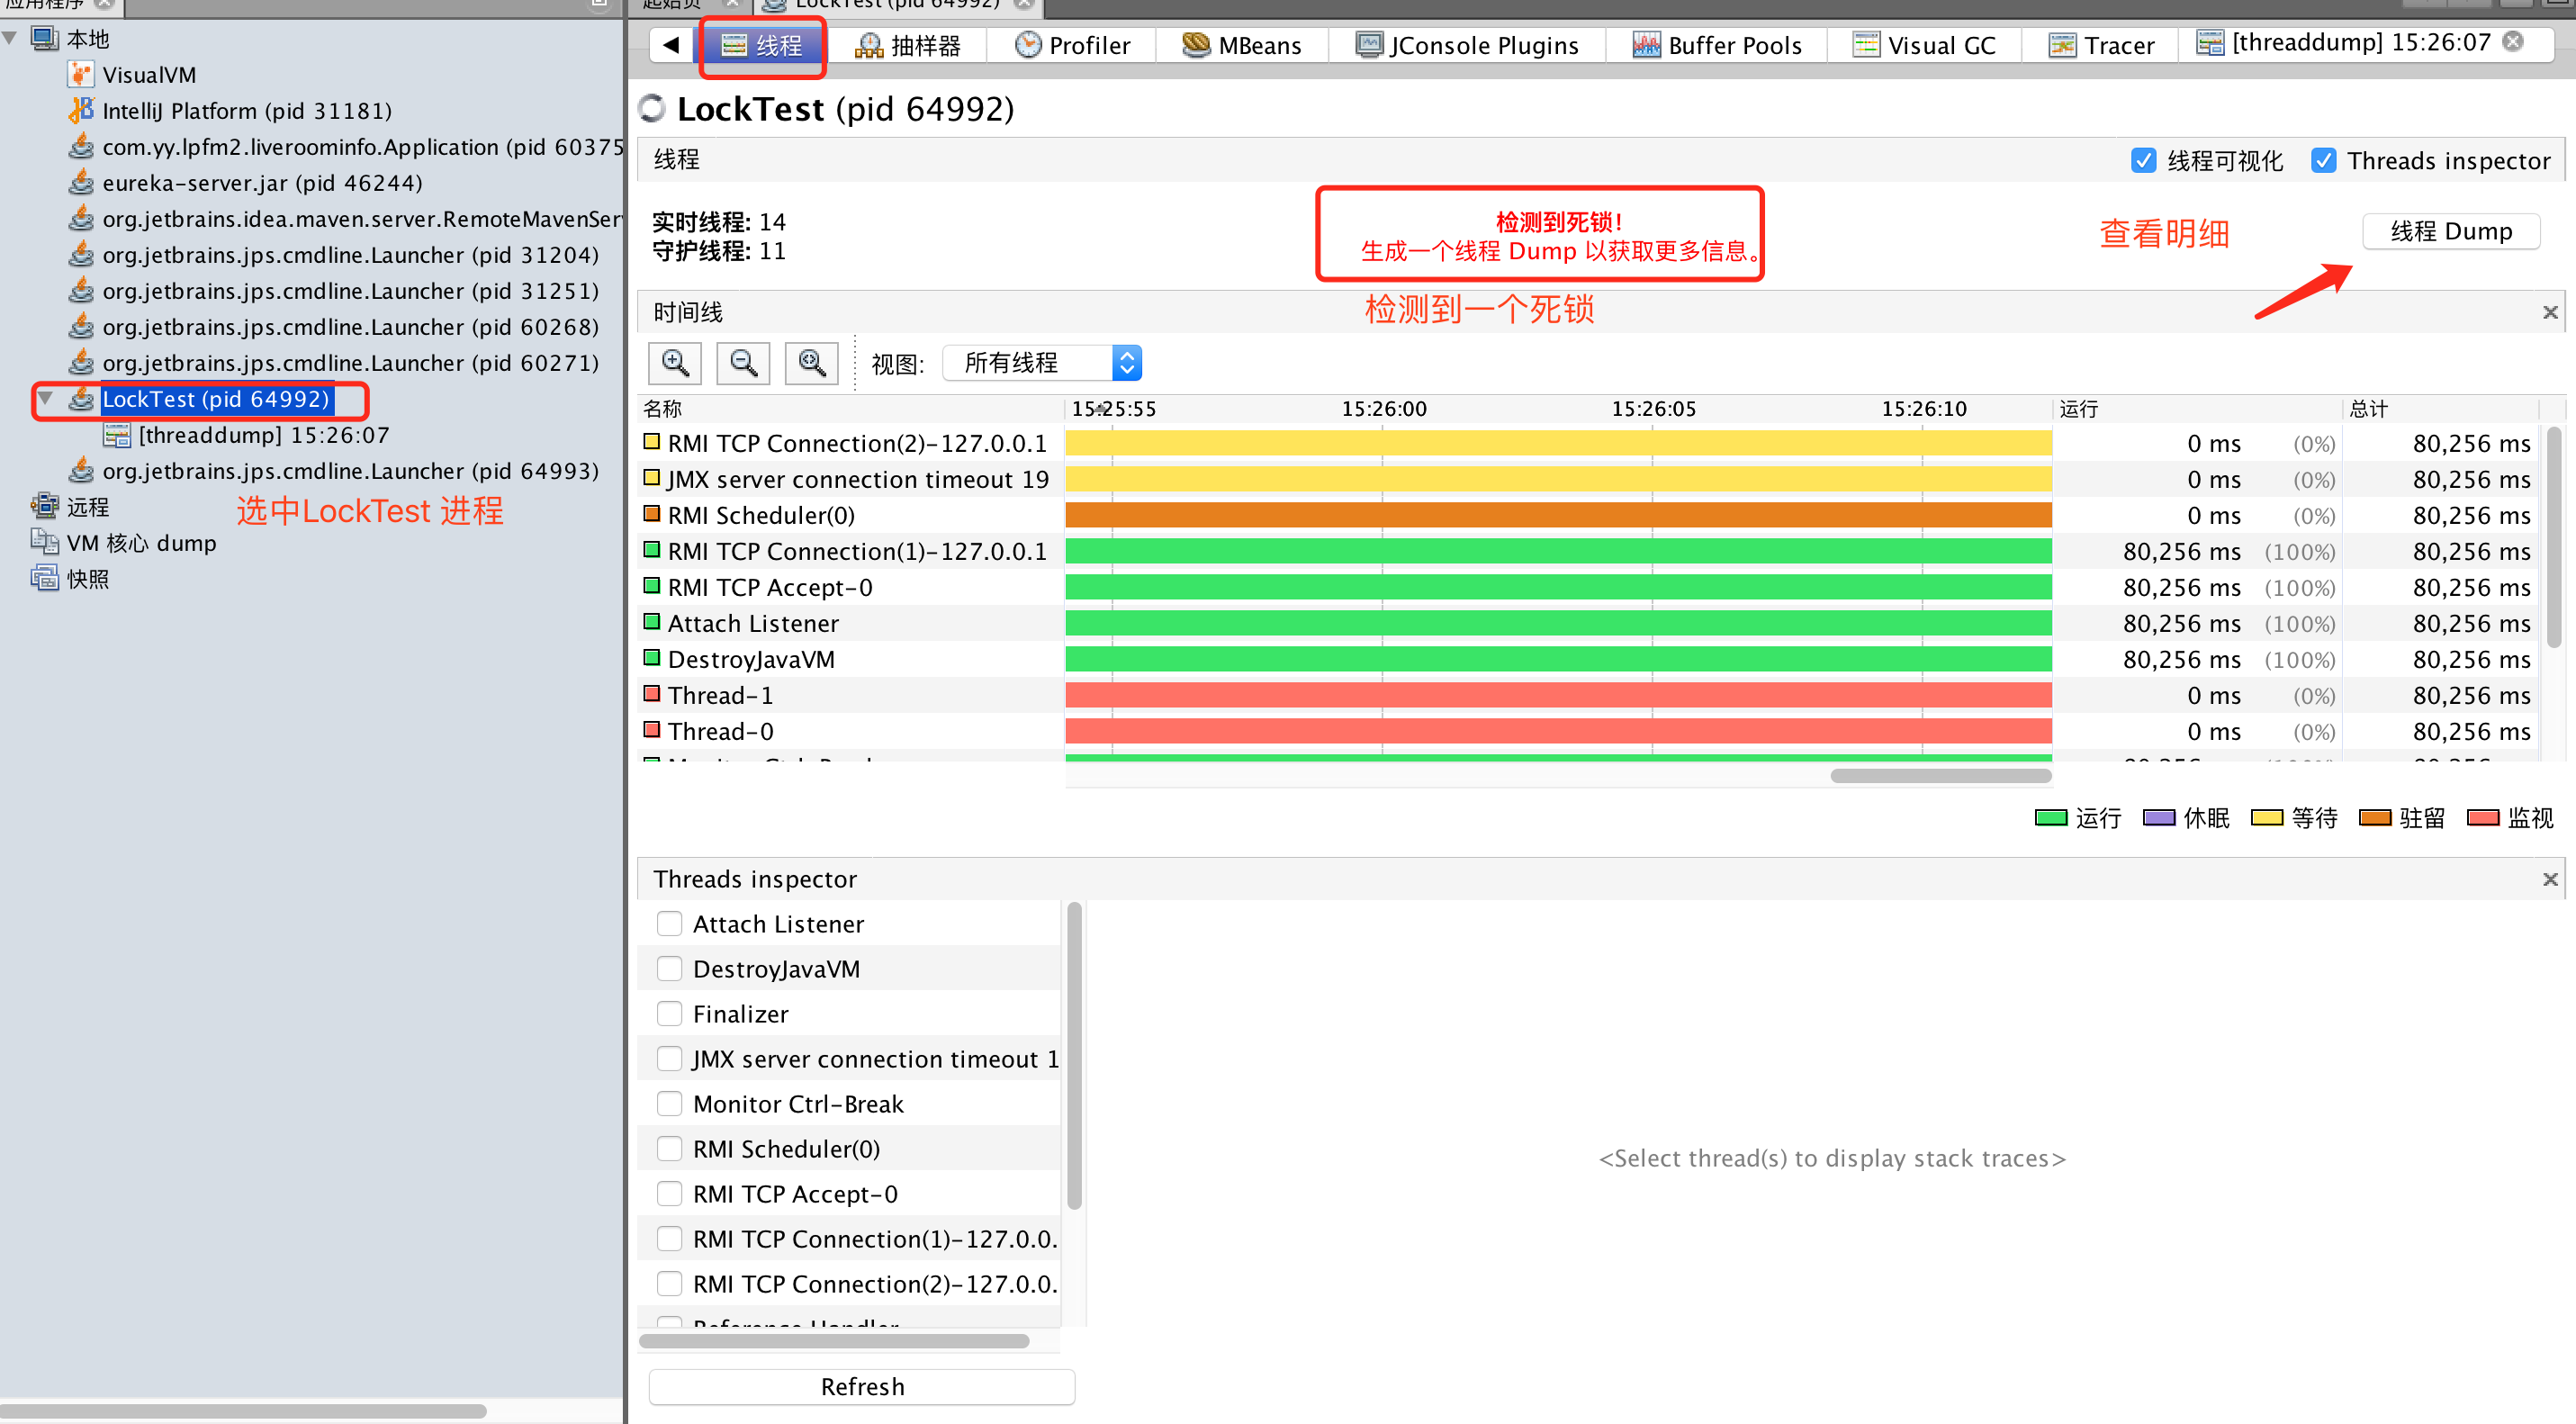
Of course, we can also use the JVisualVM tool to analyze.
3.2 the jstack command is also commonly used to find the thread stack information that occupies the highest cpu
/**
 * Run this code and the cpu will soar
 */
public class CPUTest {

    public int calculate() {
        int a = 1;
        int b = 2;
        int c = (a + b) * 10;
        return c;
    }

    public static void main(String[] args) {
        CPUTest cpuTest = new CPUTest();
        while (true){
            cpuTest.calculate();
        }
    }
}
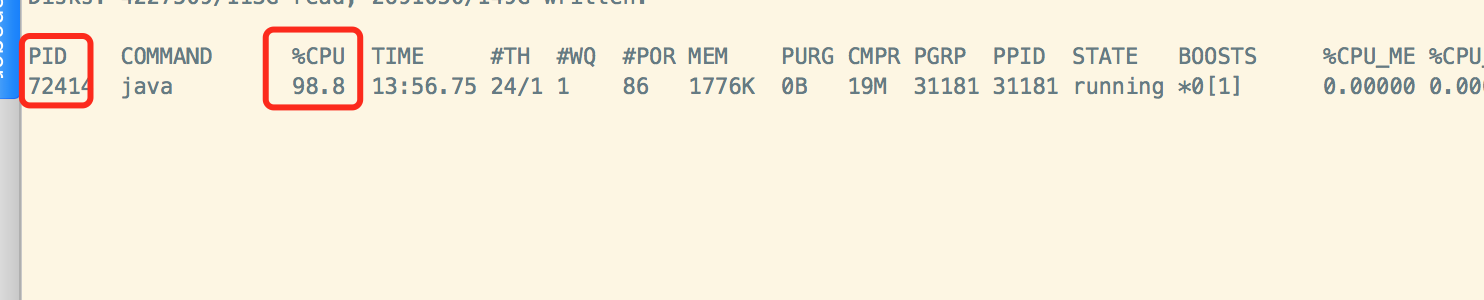
1. After executing the code, top checks the current cpu usage. The cpu usage is about 98%
Use command top -p <pid> ,Show your java Memory condition of the process, pid It's yours java Process number, such as 72414
top -p 72414
2. Press H (uppercase) to get the memory of each thread
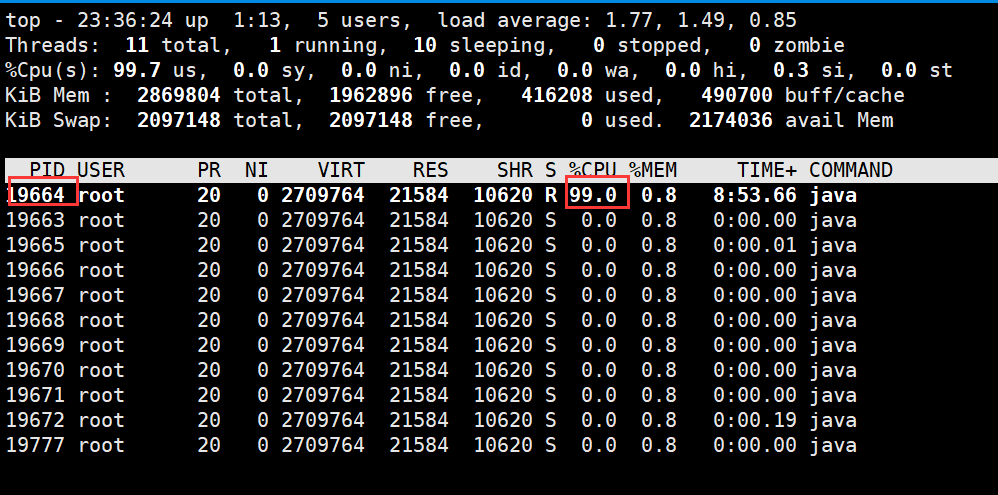
3. Find the thread tid with the highest memory and cpu consumption, such as 19664
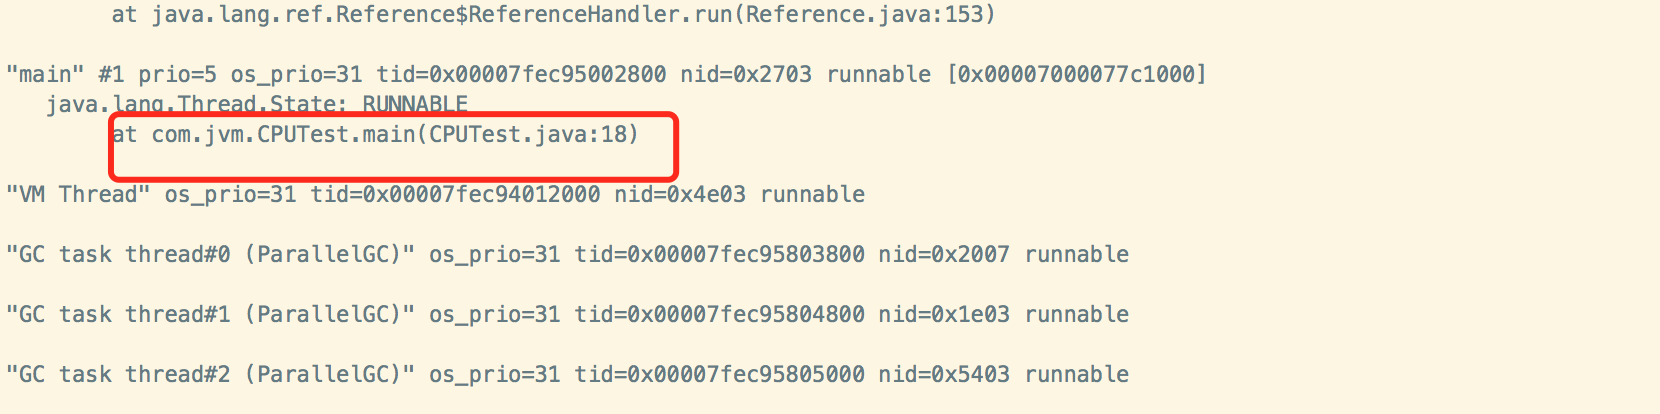
4. Convert to hexadecimal to get 0x2703, which is the hexadecimal representation of thread id
5. Execute jstack 72414|grep -A 10 0x2703 to get the next 10 lines of the line where the thread 0x2703 is located in the thread stack information. From the stack, you can find the calling method that causes the cpu to soar
Summary:
- I have learned the common commands of jvm: jps, jmap, jstack and other common commands as well as the troubleshooting methods of some classic cases. Later, I will continue to update the performance tuning methods of relevant JVMs and the use of some powerful and easy-to-use tools. It is greatly convenient for us to solve online problems and improve efficiency. If you are interested, please pay attention and praise. I will continue to share it Power of~~