Original link: http://tecdat.cn/?p=24346
1.1 project background:
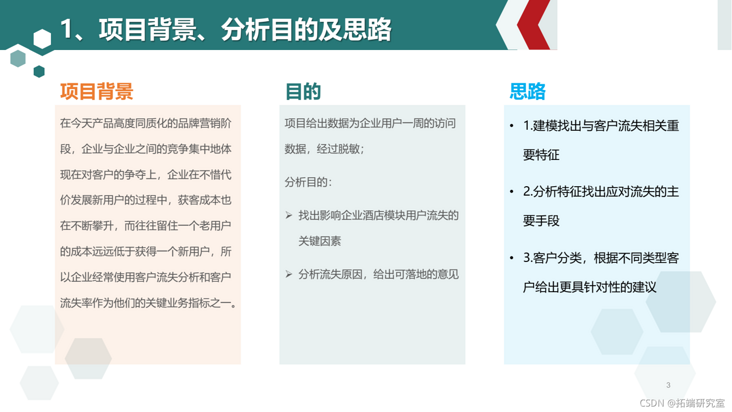
In today's highly homogeneous brand marketing stage, the competition between enterprises is mainly reflected in the competition for customers. "User is God" urges many enterprises to compete for as many customers as possible at any cost. However, in the process of developing new users at all costs, enterprises often ignore or have no time to take into account the loss of existing customers, which leads to such a dilemma: on the one hand, new customers are increasing, on the other hand, hard-earned customers are quietly losing. Therefore, it is very important and urgent to analyze the loss of old users and mine important information to help enterprise decision-makers take measures to reduce the loss of users.
1.2 purpose:
Deeply understand user portraits and behavior preferences, mine the key factors affecting user churn, and predict the transformation results of customer visits through algorithms, so as to better improve product design and improve user experience.
1.3 Data Description:
This data is the access data of Ctrip users for a week. In order to protect customer privacy, the data has been desensitized, and there is some gap with the order volume, browsing volume and conversion rate of actual goods, which does not affect the solvability of the problem.
2 read data
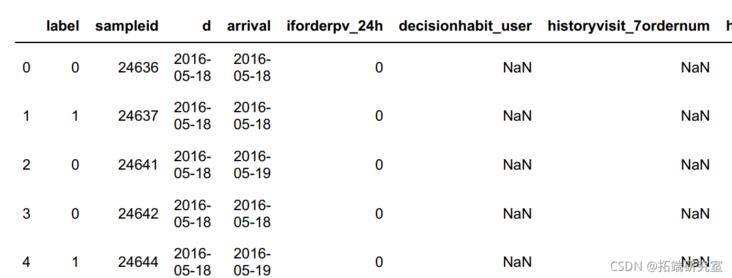
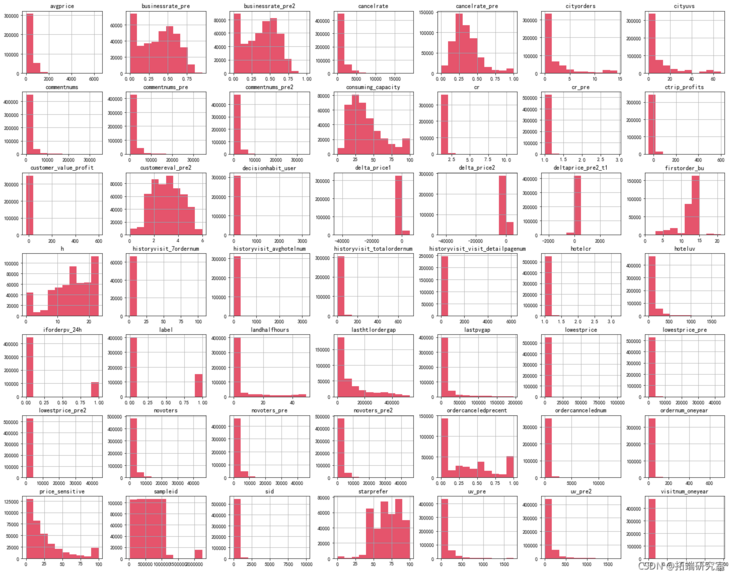
#  Show all features
df.head()
3 segmentation data
#  Partition training set
X\_train, X\_test, y\_train, y\_test = train\_test\_split(X, y, test\_size=0.2, random\_state=666)
3.1 understanding data
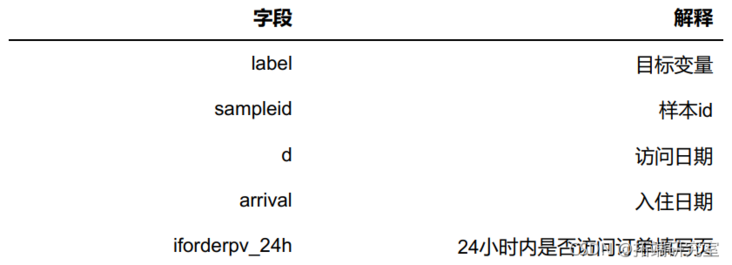
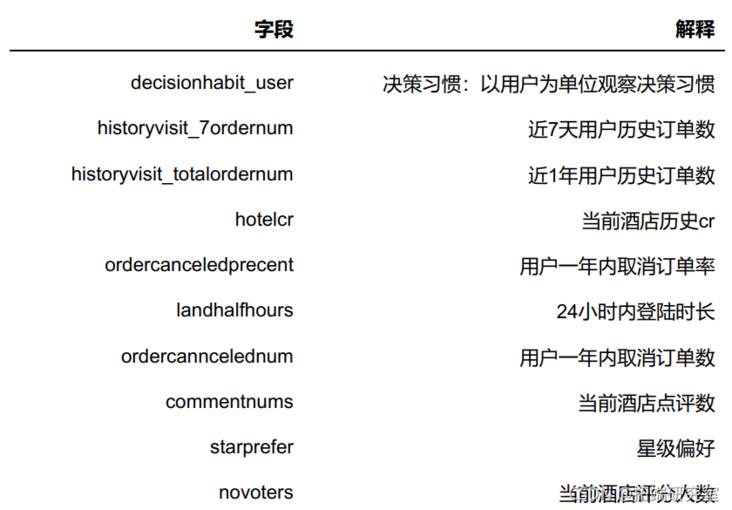
You can see that there are many variables. First, classify them. Excluding the target variable label, the fields of this dataset can be divided into three categories: order related indicators, customer behavior related indicators and hotel related indicators.
4 characteristic Engineering
#  Data exploration with training set
train = pd.concat(\[X\_train,y\_train\],axis=1)
4.1 data preprocessing
4.1.1 delete unnecessary columns
X_train.pop("sampleid")
X_test.pop("sampleid")
train.pop("sampleid")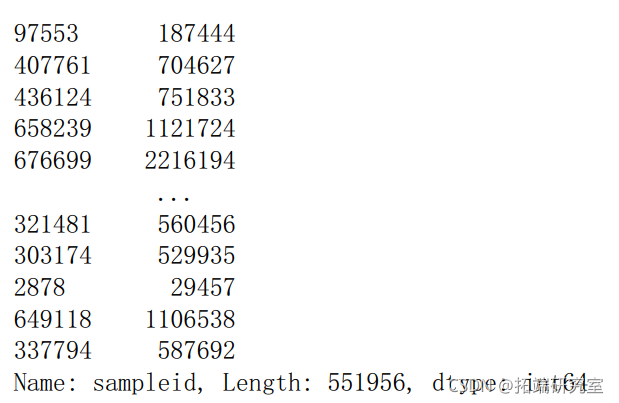
4.1.2 data type conversion
String type features need to be processed into numerical type before modeling. Subtract arrival and d to get "scheduled days in advance" as a new feature
#  Add column
#  Converts two date variables from a string to a date format type
train\["arrial"\] = pd.to_datimetain\["arrval"\])
X\_tst\["arival"\] = d.to\_daetime(X_est\["arival"\])
#  Generate advance scheduled time column (derived variable)
X\_trin\["day\_adanced"\] = (X_rain\["arival"\]-Xtrain\["d"\]).dt.days

##  Delete column
X_tran.dro(columns="d","arrivl"\],inpace=True)
4.1.3 variables with missing values generate an indicating dummy variable
zsl = tain.isnll().sum()\[tain.isnll(.sum()!=0\].inex
4.1.4 fill vacancies based on business experience
ordernum_ The number of annual orders of oneyear users is 0, 11% of lasttlordergap is filled with 600000, 88% is filled with 600000, the time from the last order is filled with 600000, ordercancelednum is filled with 0, and ordercanceledpriority is filled with 0t
The single rate 2421414 - 242114 - is empty. There are two cases: 1. The new user has not placed an order - 88.42% 214097 2. The old user has not consumed for more than 1 year, and the code column is added for the new user who has not placed an order and the old user who has not placed an order for 1 year
price\_sensitive -0, median filled price sensitive index, consuming\_capacity -0 median filling consumption capacity index 226108 - empty 1. New users who have never placed an order 214097 2.12011 are empty. The reason is not clear
uv\_pre -24-hour history most viewed Hotel history uv. cr\_pre -0, median filling - 24-hour history, the most visited Hotel history cr -0, median filling 29397 - empty 1. The user did not log in to APP 28633 that day 2. 178 586 of the new hotel just launched had no UV, cr record code added 764 29397 of the new hotel just launched on the APP
customereval_pre2 fill in 0 - average score of 24-hour historical browsing hotel customers, landalfhours - length of login within 24 hours - fill in 28633 with 0 - empty: the user did not log in to APP 28633 that day
Hotelcr, hoteluv - median fill 797
Just went to the new hotel 60 # but didn't log in to APP 118
avgprice 0 fills in part of the price, fills in 0 the number of people who have not placed an order in recent years, and cr fills in 0,
tkq = \["hstoryvsit\_7ordernm","historyviit\_visit\_detaipagenum","frstorder\_b","historyvi
# tbkq = \["hitoryvsit\_7dernum","hisryvisit\_isit_detailagenum"\]

X_train\[i\].fillna(0,inplace=True)
##  Some are filled with 0 and some with median
#  Related attributes affected by new users: ic\_sniti,cosuing\_cacity
n\_l = picesensitive","onsmng\_cpacty"\]
fori in n_l
X\_trini\]\[Xra\[X\_trinnew_ser==1\].idex\]=0
X\_est\[i\]\[X\_test\[X\_test.nw\_user==1\].inex\]=0
4.1.5 abnormal value handling
customer\_value\_profit,ctrip_ Negative values in profiles are treated as 0
Set delta\_price1,delta\_ Negative values in price2 and lowestprice are treated as median
for f in flter_two:
a = X_trin\[\].median()
X\_tran\[f\]\[X\_train\[f\]<0\]=a
X\_test\[f\]\[X\_est\[\]<0\]=a
tran\[f\]\[train\[f\]<0\]=a
4.1.6 missing value filling
Fields that tend to be normally distributed are filled with the mean value: businessrate\_pre2,cancelrate\_pre,businessrate_pre; The field of skew distribution is filled with the median
def na_ill(df):
for col in df.clumns:
mean = X_trai\[col\].mean()

dfcol\]=df\[col\].fillna(median)
return
##  Derivative variable annual transaction rate
X\_train\["onear\_dalate"\]=\_tain\["odernum\_onyear"\]/X\_tran"visinum\_onyar"\]
X\_st\["onyardealae"\]=X\_st\["orernum_neyear"\]/Xtest\[visitumonyear"\]
X_al =pd.nca(\[Xtin,Xtes)
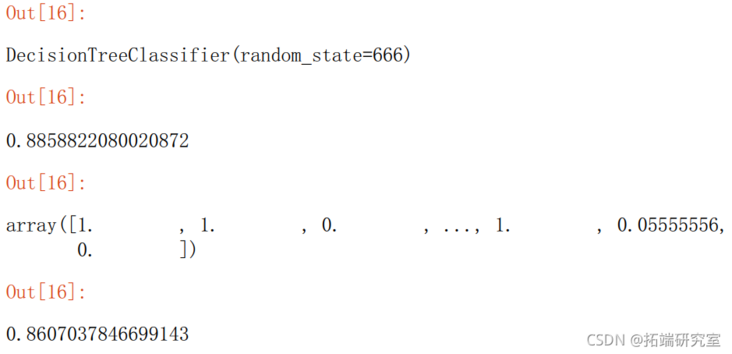
#Decision tree test

dt = Decsionr(random_state=666)

pre= dt.prdict(X_test)
pre\_rob = dt.preicproa(X\_test)\[:,1\]
pre_ob
4.2 data standardization
scaler = MinMacaer()

#Decision tree test
dt = DeonTreasifi(random_state=666)
5 feature screening
5.1 feature selection - delete 30% columns
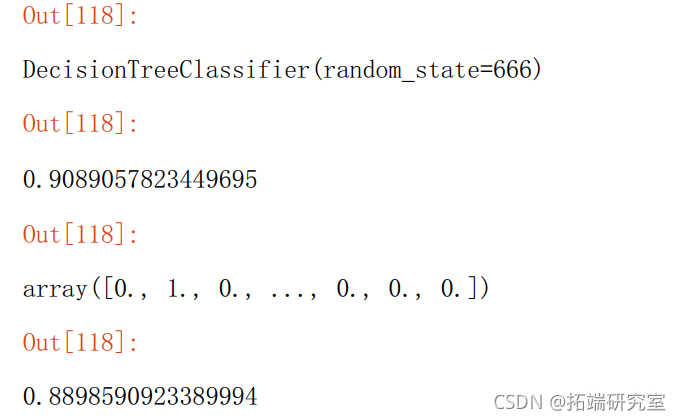
X\_test = X\_test.iloc\[:,sp.get_spport()\]
#Decision tree test
dt = DecisonreeClssifie(random_state=666)
dt.fit(X\_trin,y\_tain)
dt.score(X\_tst,y\_est)
pre = dt.pdict(X_test)
pe\_rob = dt.redicproba(X\_test)\[:,1\]
pr_rob

uc(pr,tpr)
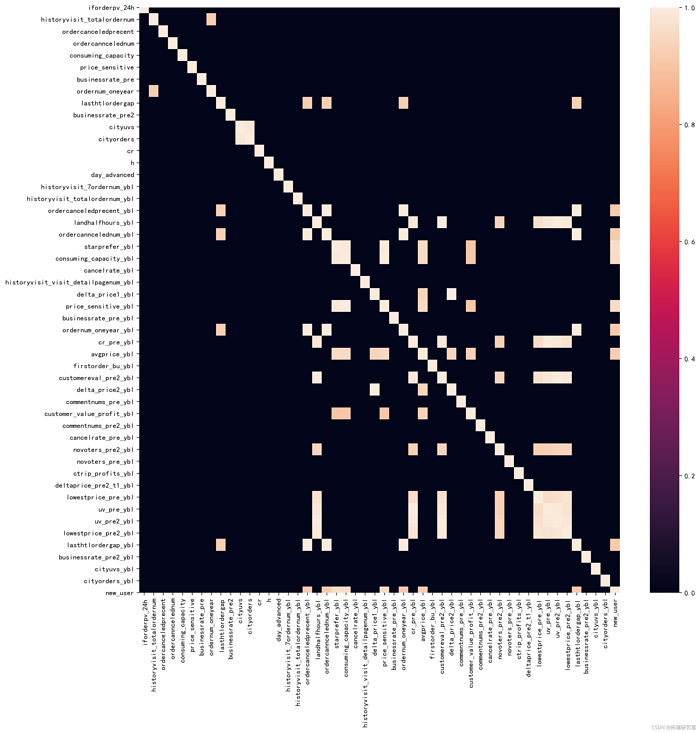
5.2 collinearity / data correlation
#Collinearity -- severe collinearity above 0.9, merge or delete
d = Xtrai.crr()
d\[d<0.9\]=0 #The assignment shows highly relevant variables
pl.fufsiz=15,15,dpi200)
ssheatp(d)
6 modeling and model evaluation
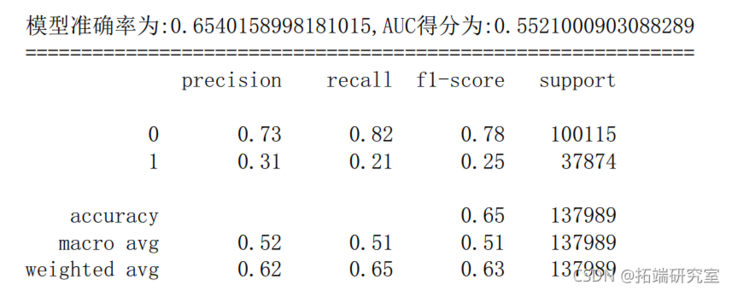
6.1 logistic regression
y\_prob = lr.preictproba(X\_test)\[:,1\]
y\_pred = lr.predict(X\_test
fpr\_lr,pr\_lr,teshold\_lr = metris.roc\_curve(y\_test,y\_prob)
ac\_lr = metrcs.aucfpr\_lr,tpr_lr)
score\_lr = metrics.accuracy\_score(y\_est,y\_pred)
prnt("The accuracy of the model is:{0},AUC Score{1}".fomat(score\_lr,auc\_lr))
prit("="*30
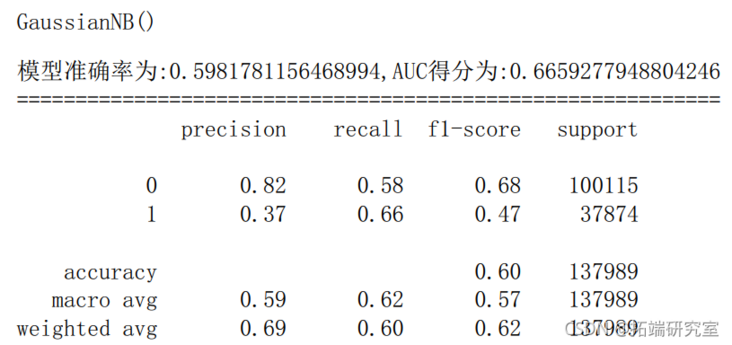
6.2 naive Bayes
gnb = GasinNB() #  Instantiate an LR model
gnb.fi(trai,ytran) #  Training model
y\_prob = gn.pic\_proba(X_test)\[:,1\] #  Probability of predicting class 1
y\_pred = gnb.preict(X\_est) #  Prediction results of the model on the test set
fpr\_gnb,tprgnbtreshold\_gb = metrics.roc\_crve(ytesty\_pob) #  Obtain true positive rate, false positive rate and threshold
aucgnb = meic.aucf\_gnb,tr\_gnb) #  AUC score
scoe\_gnb = merics.acuray\_score(y\_tes,y\_pred) #  Model accuracy
6.3 support vector machine
s =SVkernel='f',C=,max_ter=10,randomstate=66).fit(Xtrain,ytrain)
y\_rob = sc.decsion\_untio(X_st) #  Decision boundary distance
y\_ed =vc.redit(X\_test) #  Prediction results of the model on the test set
fpr\_sv,tpr\_vc,theshld\_sv = mtris.rc\_urv(y\_esty\_pob) #  Obtain true positive rate, false positive rate and threshold
au\_vc = etics.ac(fpr\_sc,tpr_sv) #  Model accuracy
scre\_sv = metrics.ccuracy\_sore(_tst,ypre)
6.4 decision tree
dtc.fit(X\_tran,\_raiproba(X_test)\[:,1\] #  Probability of predicting class 1
y\_pred = dtc.predct(X\_test #  Prediction results of the model on the test set
fpr\_dtc,pr\_dtc,thresod\_dtc= metrcs.roc\_curvey_test,yprob) #  Obtain true positive rate, false positive rate and threshold
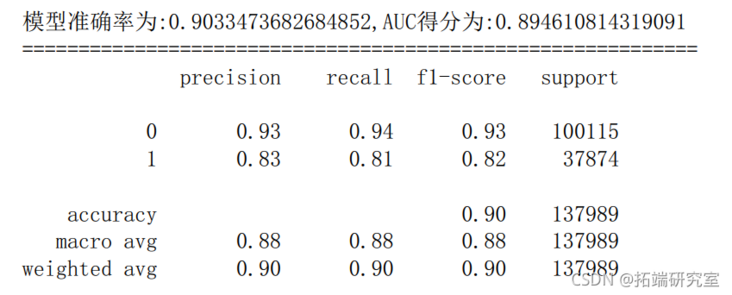
6.5 random forest
c = RndoForetlassiir(rand_stat=666) #  Establish random Sen
rfc.it(X_tain,ytrain) #  Training random forest model
y\_rob = rfc.redict\_poa(X_test)\[:,1\] #  Probability of predicting class 1
y\_pedf.pedic(\_test) #  Prediction results of the model on the test set
fpr\_rfc,tp\_rfc,hreshol\_rfc = metrcs.roc\_curve(y\_test,\_prob) #  Obtain true positive rate, false positive rate and threshold
au\_fc = meris.auc(pr\_rfctpr_fc) #  AUC score
scre\_rf = metrcs.accurac\_scor(y\_tes,y\_ped) #  Model accuracy
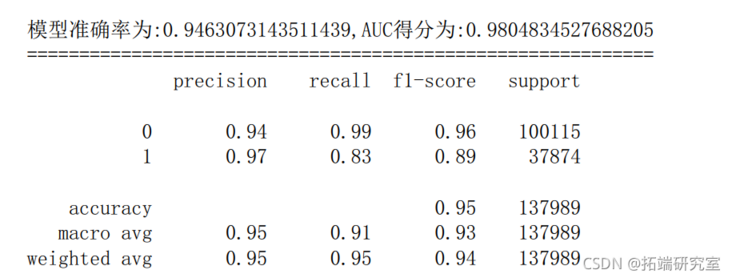
6.6 XGboost
#  Read training data set and test set
dtainxgbatrx(X_rai,yrain)
dtest=g.DMrx(Xtest
#  Set xgboost modeling parameters
paras{'booser':'gbtee','objective': 'binay:ogistic','evlmetric': 'auc'

#  Training model
watchlst = (dtain,'trai)
bs=xgb.ran(arams,dtain,n\_boost\_round=500eva=watchlst)
#  Enter the probability value that the prediction is positive
y_prob=bst.redict(dtet)
#  Set the threshold to 0.5 to get the prediction results of the test set
y\_pred = (y\_prob >= 0.5)*1
#  Obtain true positive rate, false positive rate and threshold
fpr\_xg,tpr\_xgb,heshold\_xgb = metricsroc\_curv(test,y_prob)
aucxgb= metics.uc(fpr\_gb,tpr\_xgb #  AUC score
score\_gb = metricsaccurac\_sore(y\_test,y\_pred) #  Model accuracy
print('The accuracy of the model is:{0},AUC Score:{1}'.format(score\_xgb,auc\_xgb))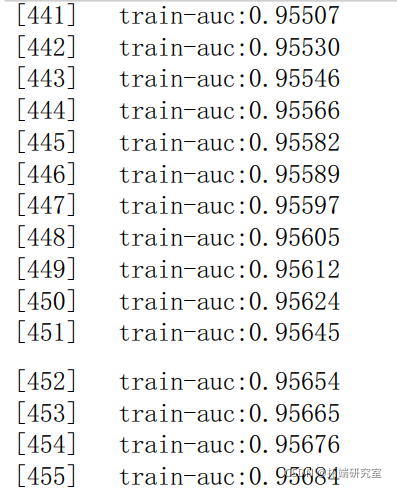
6.7 model comparison
plt.xlabel('False positive rate')
plt.ylabel('True Yang rate')
plt.title('ROC curve')
plt.savefig('Model comparison diagram.jpg',dpi=400, bbox_inches='tight')
plt.show()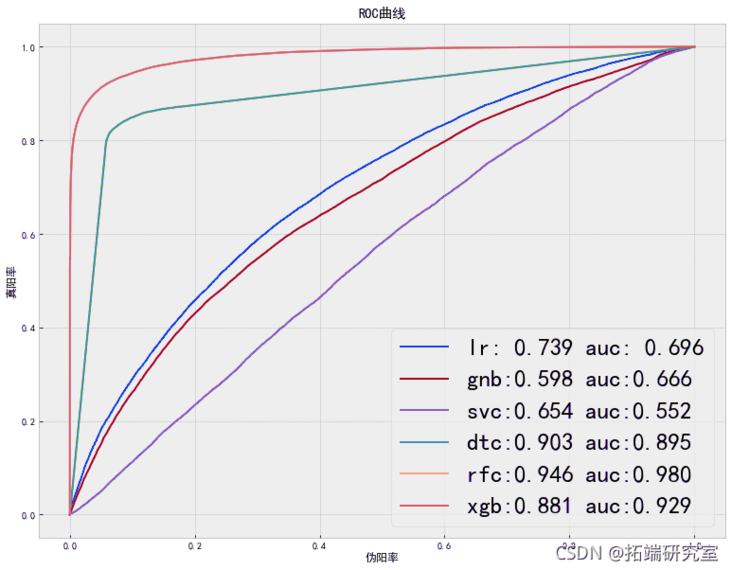
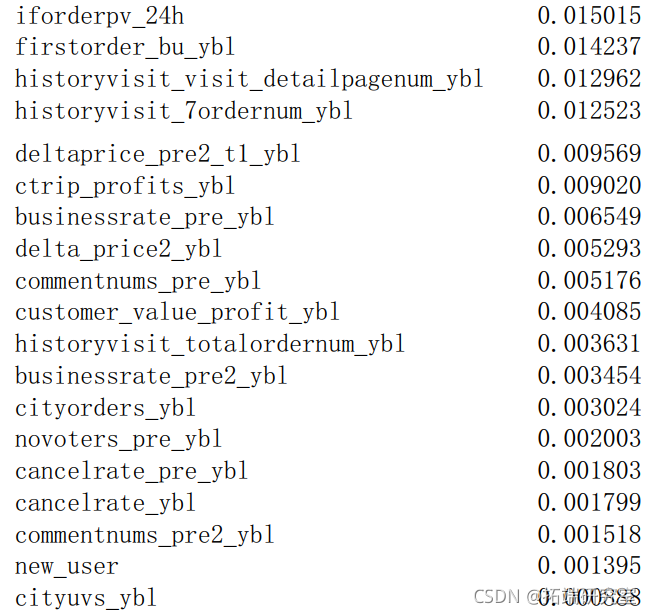
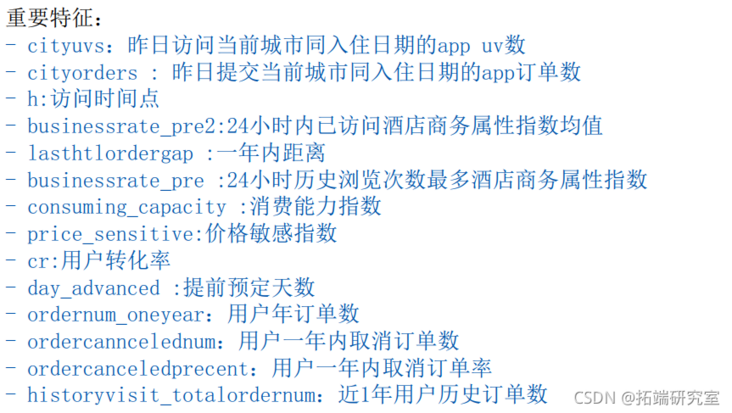
6.8 important features
ea = pd.Sries(dct(list((X\_trclumsfc.eatre\_imortancs_))))
ea.srt_vlues(acedig=False
fea\_s = (fa.srt\_vauesacnding=alse)).idex
6.9 loss cause analysis
- When the cityuvs and cityorders values are small, the loss of users is significantly higher than the average level, indicating the lack of hotel information in small cities on Ctrip platform, and users turn to competitive products with complete hotel information in small cities, resulting in the loss of users
- When the access time is from 7:00 to 19:00, the proportion of user loss is high and average: weekday push should avoid these time points
- The hotel business attribute index is in the range of 0.3-0.9, and the loss of users is greater than the average level, and shows an increasing trend, indicating that there is a gap between the expectations of Hotels with high platform business index and users (too high price or other reasons?), and there is less loss of users with low business attribute
- Within a year, the shorter the time from the last order, the more serious the loss. Due to the negative news broke out by Ctrip from May 2015 to January 2016, enterprises should strengthen their own management and establish a good social image
- The loss of users with low consumption capacity index (10-40) is serious, and this part of users accounts for 50%, which should be paid attention to
- The loss of people with price sensitivity index (5-25) is higher than the average level, and pay attention to hotel quality
- The higher the user conversion rate, the number of users' annual orders and the number of users' historical orders in recent 1 year, the greater the proportion of people who do not visit the order filling page within 24 hours, and the more serious the loss. It is necessary to make a good tracking experience for users after placing an order, invite them to fill in the check-in experience, sort out their opinions and make improvements
- The shorter the advance booking days, the more serious the loss is. The higher the number of orders cancelled by users in a year, the more serious the loss is
6.10 suggestions:
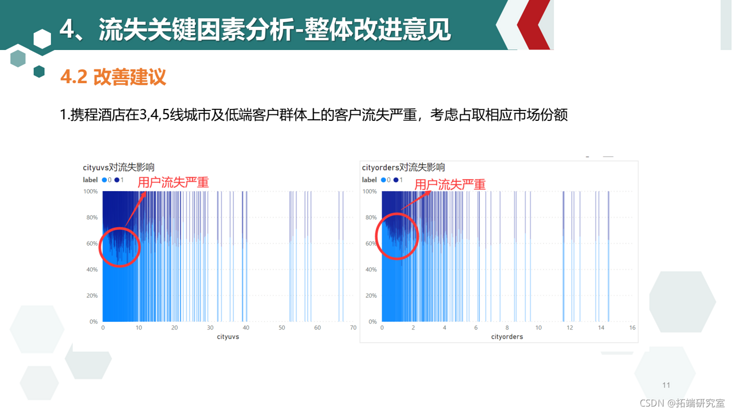
- Consider taking the market share of the third and fourth tier cities and low-end hotels
- Users are vulnerable to the negative news of the enterprise. It is suggested that the enterprise dare to bear social responsibility, strengthen its own management, improve the timeliness of Public Relations News processing, and establish a good image of the brand
- Start the hotel push of popular scenic spots 2-3 weeks before the holiday
- Do a good job in the tracking experience after the hotel orders, invite to fill in the check-in experience, and sort out the user's comments for improvement
7 customer portrait
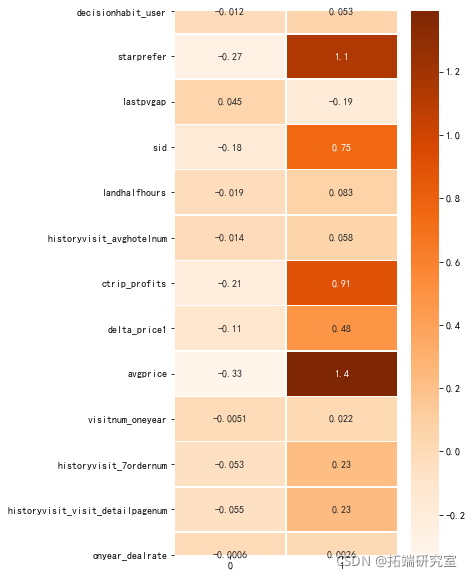
7.1 modeling user classification
#  User portrait features
user\_feature = \["decisiohabit\_user,'starprefer','lastpvgap','sid',
'lernum",'historyvisit\_visit\_detaipagenum',
"onyear_dealrat
\]
#  Loss impact characteristics
fea_lis = \["cityuvs",
"cityorders",
"h",
"businessrate_pre2"

#  Data standardization   Kmeans method is better for normal distribution data processing
scaler = StanardScalr()
lo\_atribues = pdDatarame(scr.fittransfrm(all\_cte),columns=all_ce.coluns)

#  Modeling classification
Kmens=Means(n\_cluste=2,rndom\_state=0) #333
Keans.fi(lot_attributes #  Training model
k\_char=Kmenscluster\_centers_ #  Get each category
plt.figure(figsize=(5,10))
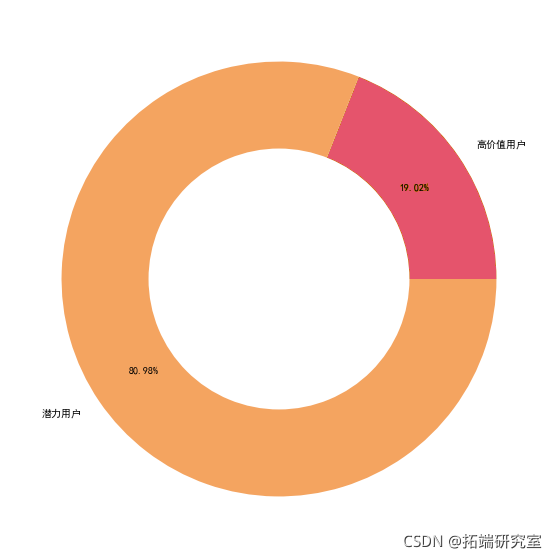
7.2 proportion of user types
types=\['High value user','Potential users'\]
ax.pie\[1\], raius=0.,colors='w')
plt.savefig(User portrait.jpg'dpi=400, box_inchs='tigh')
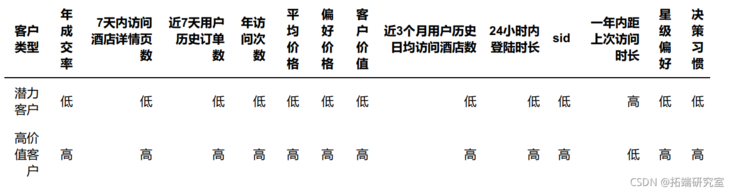
7.3 high value user analysis:
Accounting for 19.02, the frequency of visits and reservations are high, the consumption level is high, the customer value is high, the pursuit of high quality, the requirements for hotel stars are high, and the customer group is mostly concentrated in old customers,
Recommendations:
Recommend more business hotel chains with good reputation and high cost performance to attract users;
Push messages at 11:00, 17:00 and other small peak hours of daytime traffic on non working days.
Provide customers with more travel hotel information;
Increase the cost of customer churn: member point system and launch member discount card
7.4 potential user analysis
Proportion: 80.98% visit frequency and reservation frequency are low, consumption level is low, hotel star rating requirements are not high, customer groups are mostly concentrated in new customers, and customer value needs to be explored. Suggestions:
Because most new users are potential customers, it is recommended to grasp the user's initial experience (such as preferential initial consumption, punch in activities, etc.) and regularly push affordable hotels to such users, so as to cultivate the user's consumption inertia;
The content of push should mostly be big price reduction, big reward, jumping price and so on;
Because this part of users account for a large number, we can analyze the factors of losing customers in combination with the loss of this group, explore the market of this group, further analyze the sinking and explore new time.

Most popular insights
1.Why employees leave from decision tree model
2.R language tree based method: decision tree, random forest
3.Using scikit learn and pandas decision trees in python
4.Machine learning: running random forest data analysis reports in SAS
5.R language uses random forest and text mining to improve airline customer satisfaction
6.Machine learning boosts fast fashion and accurate sales time series
9.Predicting bank customer churn using python machine learning classification in python